Enhanced Risk Assessment for a Traditional LC Separation Method Using ICH Q14 Regulatory Principles and a Simplified HPLC System
Catharine E. Layton, Paul D. Rainville, Amy Woodsmall
Waters Corporation, United States
Published on May 19, 2026
Abstract
USP <1220> and the ICH Q‑series guidelines establish a lifecycle‑based, science‑driven framework for developing, validating, transferring, and maintaining analytical methods. The modern ICH Q14 approach acknowledges a risk‑based, data‑rich method development to provide better predictions of long‑term method performance versus traditional method development. This application note demonstrates the use of DOE‑based, Quality by Design (QbD) software with an easy-to-use LC system. The information obtained provides a path forward for method transfer activities.
Introduction
The United States Pharmacopeia (USP) and International Council for Harmonization of Technical Requirements for Pharmaceuticals for Human Use (ICH) provide the strategies from which safe, reliable, high-quality medicines are developed, registered, and maintained. Regulatory guidelines published by these agencies describe consistent and thorough, science-based harmonization protocols for data driven decision making.1 USP general Chapter 1220, titled "The Analytical Procedure Lifecycle," emphasizes development, validation, transfer, and ongoing monitoring of analytical methods, while robust method development is further described in the ICH “Q series”, or quality-related chapters, for drug development and manufacturing. Protocols illustrated in these chapters ensure that methods measure important critical product Critical Quality Attributes (CQAs), such as specificity/selectivity, accuracy, and precision.2 In the ICH Q14 guideline, both traditional (legacy) and modern (enhanced) approaches for analytical method development are noted. The traditional approach to method development involves a simple statement of method parameters, while the modern approach integrates enhanced elements of risk management to accelerate an understanding of method life-cycle performance. This application demonstrates the use of DoE-based, Analytical Quality by Design (AQbD) LC-focused software with the Alliance™ iS HPLC System with Photodiode Array (PDA) Detector. The methodology provided enhanced method performance and method transfer risk assessment information for a traditional LC separation method.
Experimental
Sample Preparation Methods and Materials
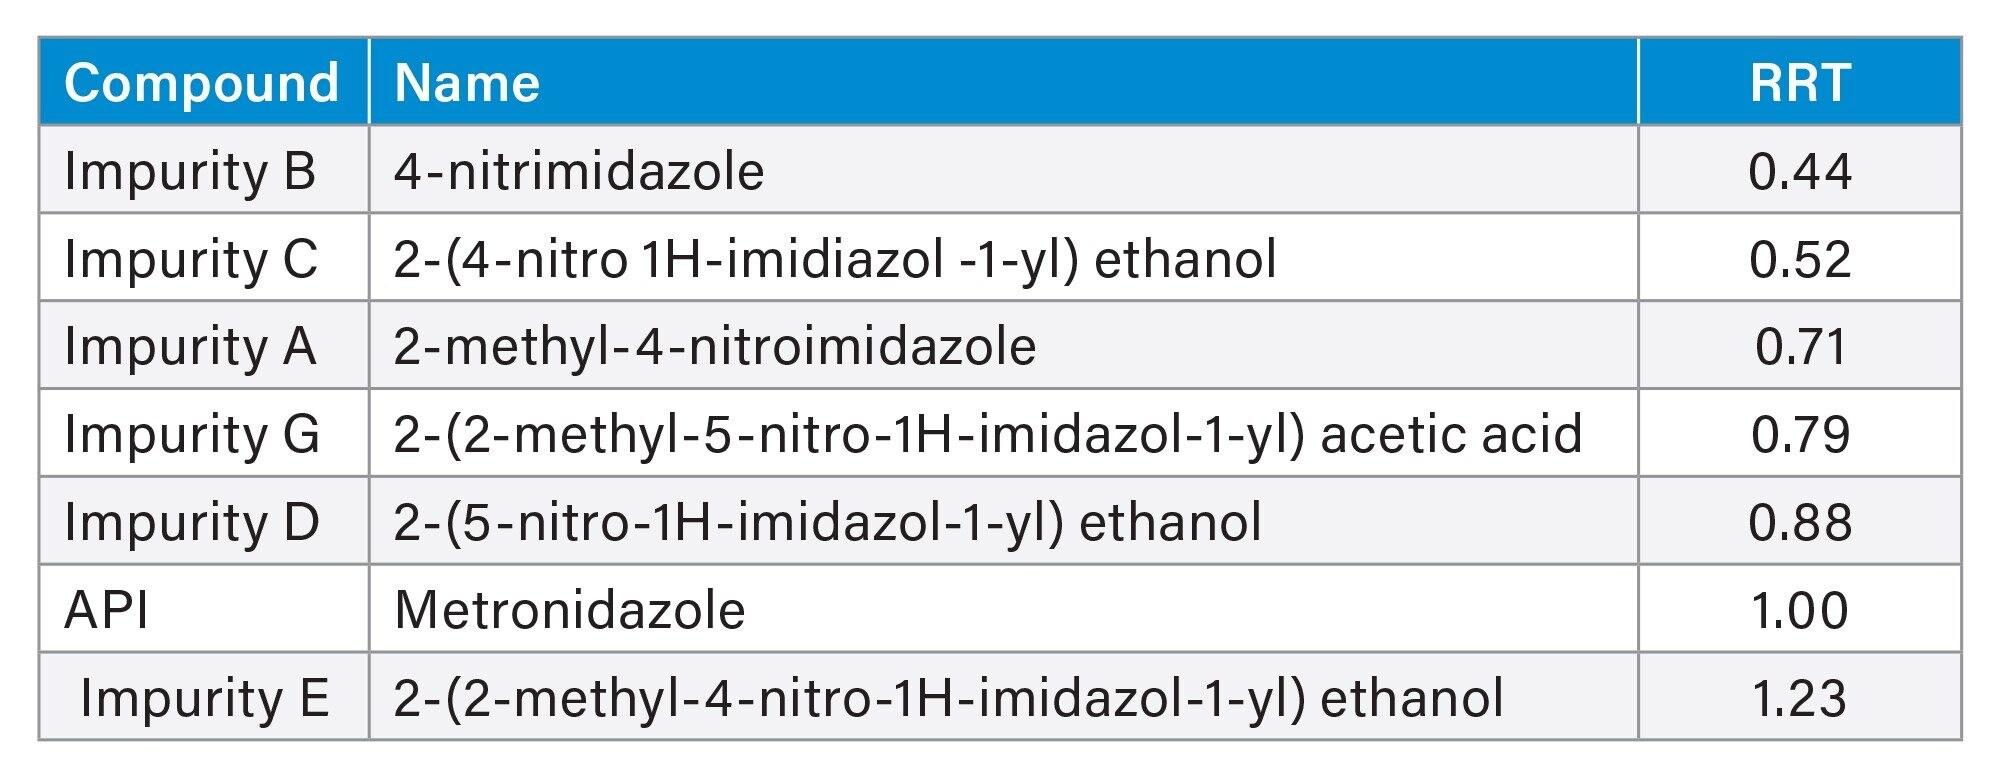
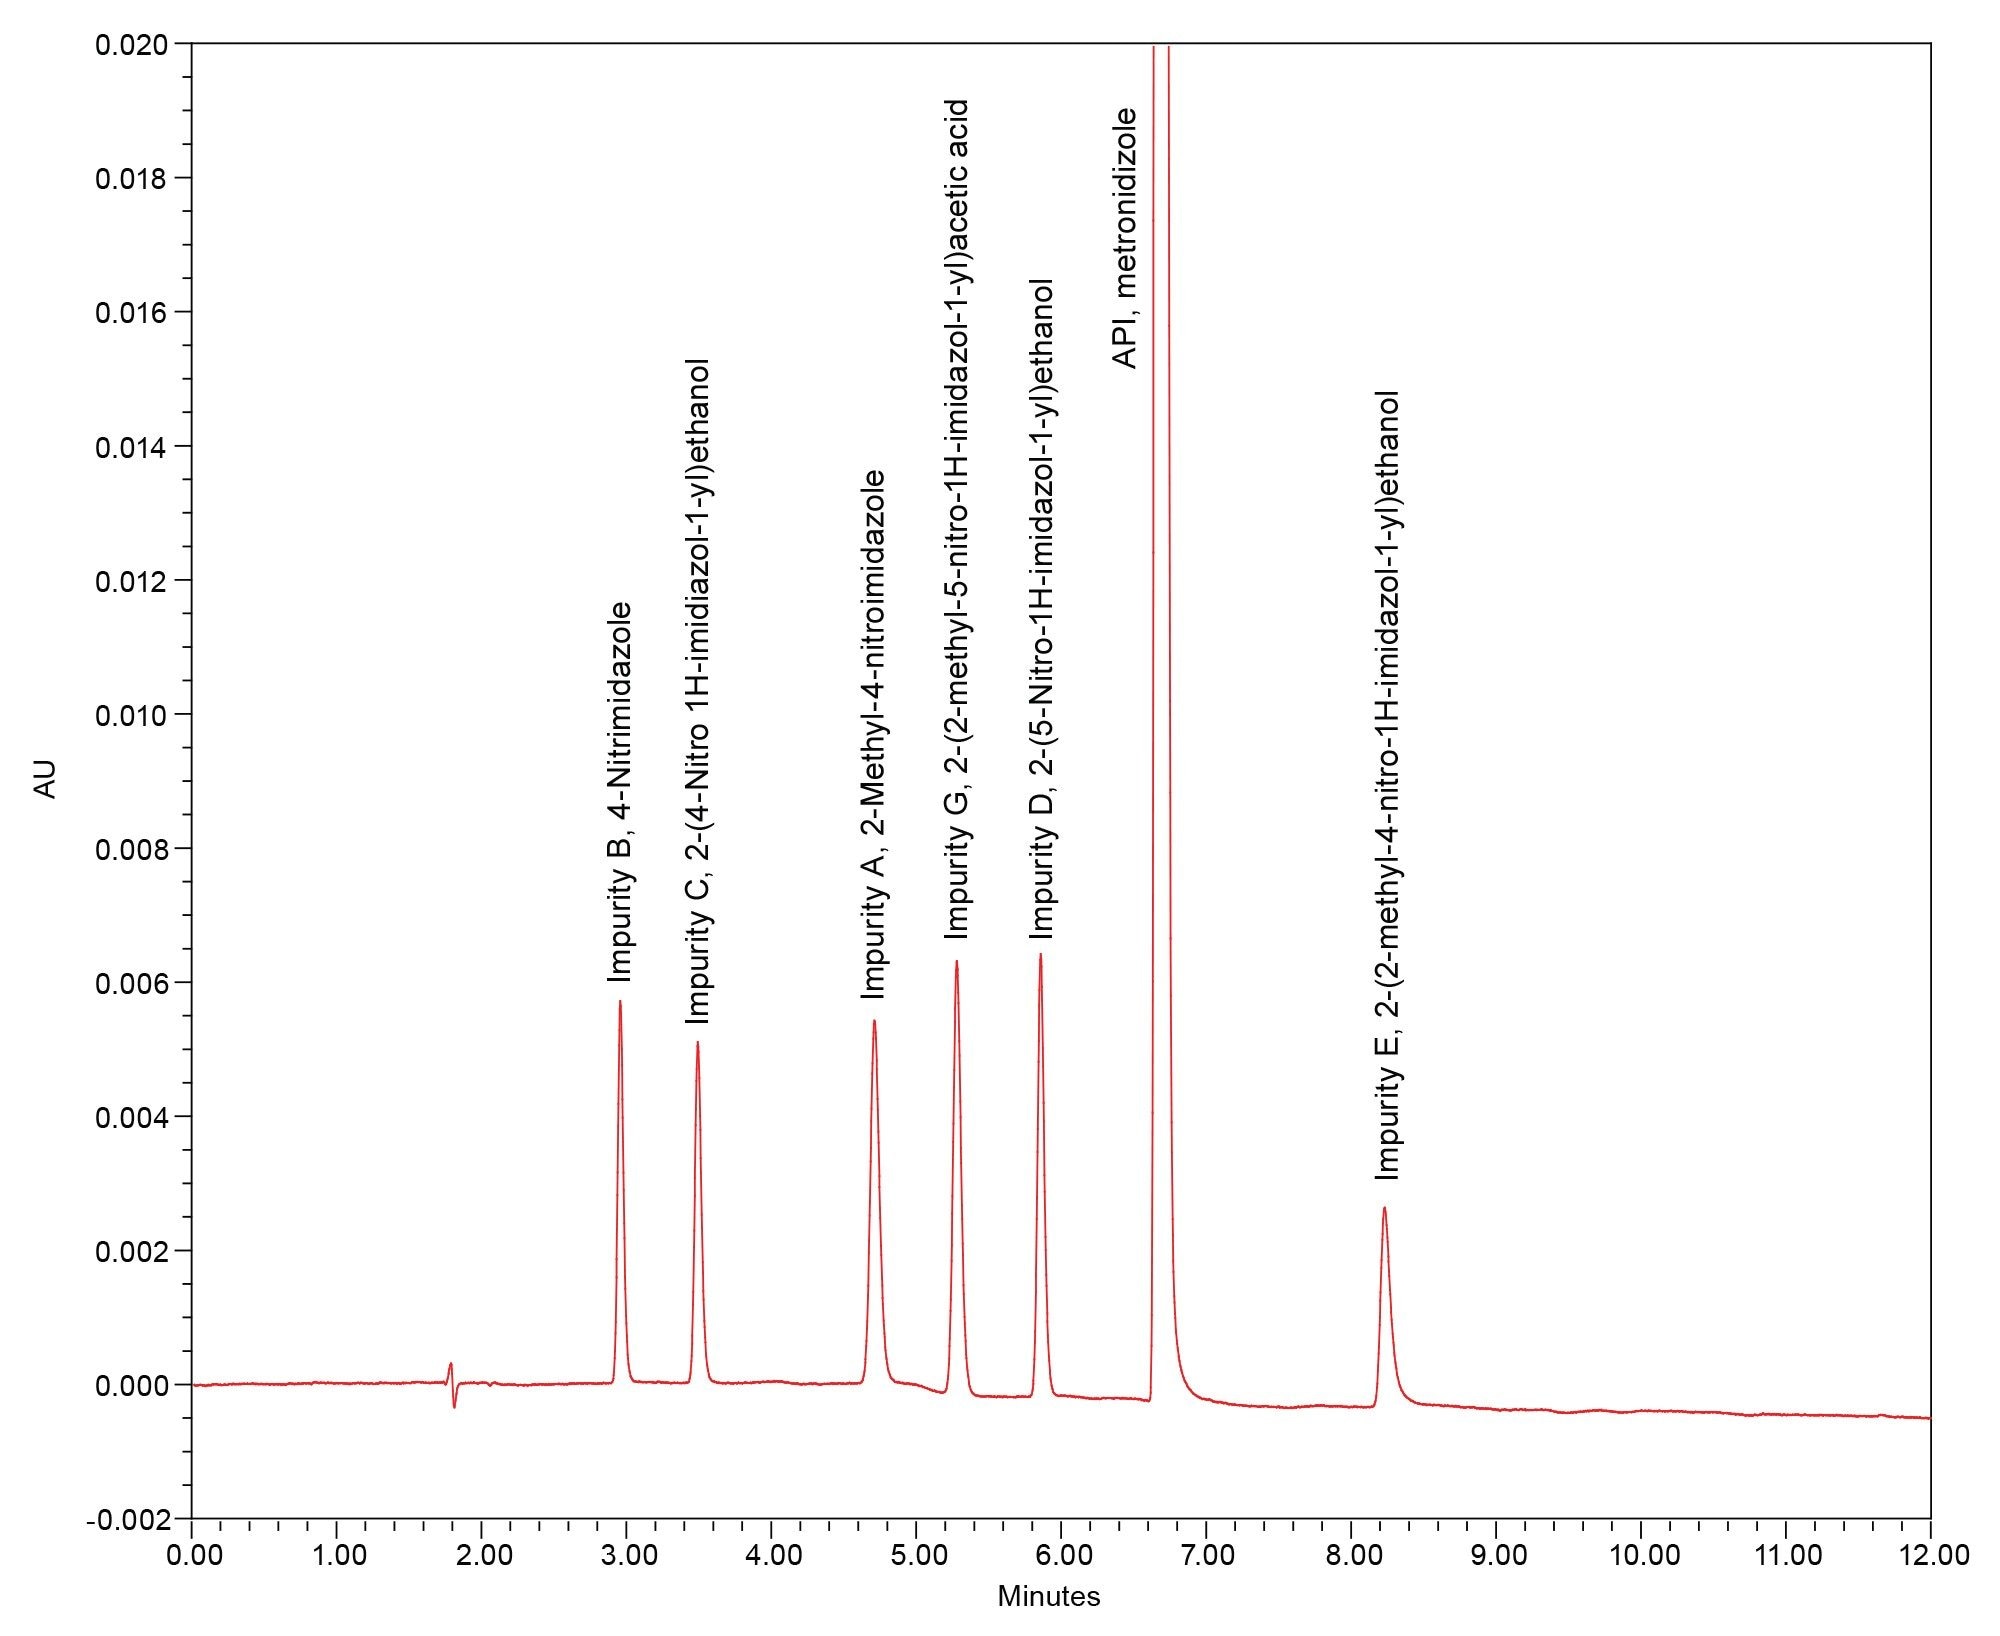
A solution of API (metronidazole) and six impurities was prepared in water at 0.1% to serve as a System Suitability Test (SST) mixture (Table 1). Separation parameters and a target chromatogram for the LC method, summarized in Table 2, Table 3, Table 4, and Figure 1, were employed as target criteria for two Design of Experiment (DoE) matrices. The first enhanced matrix utilized broad-range method screening at ±40% variability from the target method parameters, while the second focused on ±25% variability (Table 5, Table 6). System suitability results were compiled via the QbD software, and peak performance summarized with visual plots and data trending.
Parameters
|
LC system: |
Alliance iS HPLC System with Photodiode Array (PDA) Detector |
|
Column: |
XSelect™ CSH C18 Column, 4.6 x 150 mm, 2.5 µm |
|
Column temperature: |
40 °C |
|
Flow rate: |
1.250 mL/min |
|
Injection volume: |
5 µL |
|
Mobile phase A: |
0.05% Formic acid in water |
|
Mobile phase B: |
0.05% Formic acid in acetonitrile |
|
Detector wavelength: |
315 nm |
|
Equilibration time: |
3.0 minutes |
|
Initial hold time: |
2.0 minutes |
|
Data/run time: |
11.0 minutes |
|
Chromatography data software (CDS): |
Empower 3® Software v3.8.1, Base Package, System Suitability |
|
QbD software: |
Fusion QbD Professional 9.9.2 SR3c, Build 6853 |
Table 1. Traditional method separation parameters.
|
Time |
%B |
|
0 |
2 |
|
2 |
2 |
|
10 |
30 |
|
11 |
30 |
|
11.5 |
85 |
|
12 |
2 |
|
15 |
2 |
Table 2. Traditional method gradient.
|
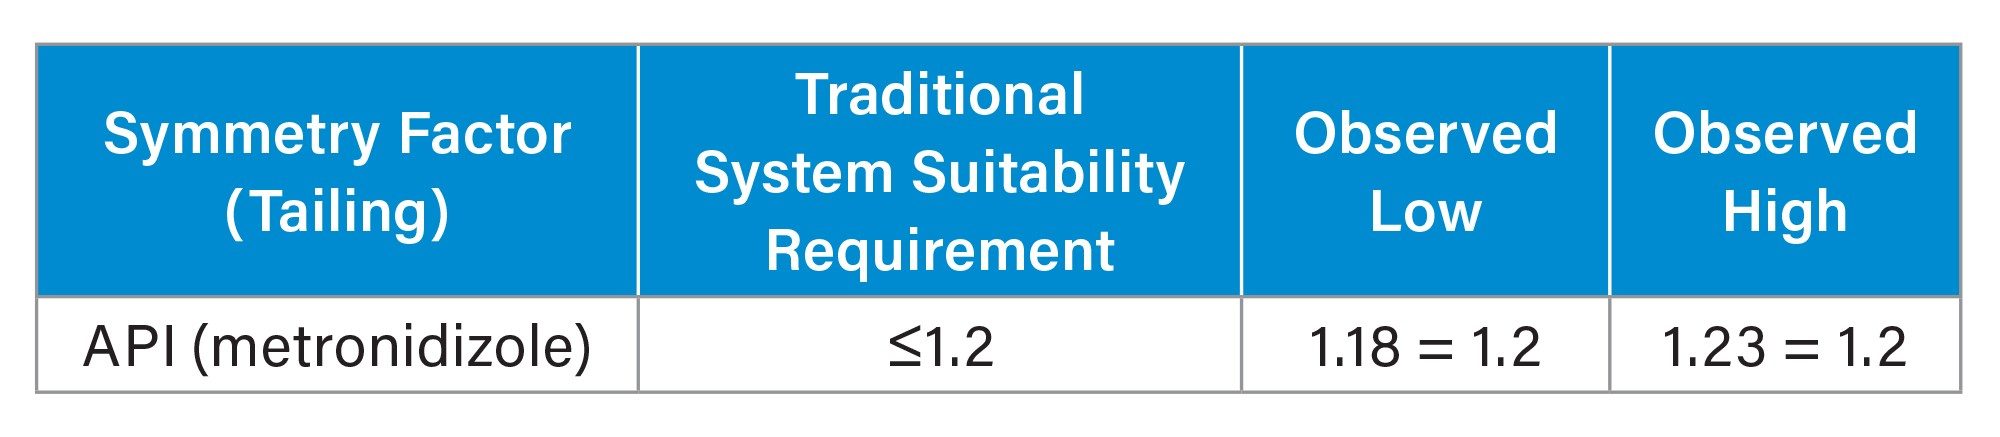
Criteria for the API (metronidazole) |
System suitability requirement |
|
Symmetry Factor(Tailing): |
≤1.2 |
|
USP resolution: |
≥ 2.0 |
|
Relative Retention Time (RRT) and Spectral ID: |
No requirement |
|
Peak identification: |
RRT |
Table 3. Traditional method performance criteria.
|
Parameters |
Range |
|
Pump flow rate (mL/min): |
0.500 - 2.000 |
|
Gradient time (min): |
4.0 - 12.0 |
|
Oven temperature (°C): |
30.0 - 60.0 |
Table 5. Screening matrix parameters (±40%).
|
Parameters |
Range |
|
Pump flow rate (mL/min): |
1.000 - 1.500 |
|
Gradient time (min): |
6.5 - 9.5 |
|
Oven temperature (°C): |
35.0 - 45.0 |
Table 6: Focused matrix parameters (±25%).
Results and Discussion
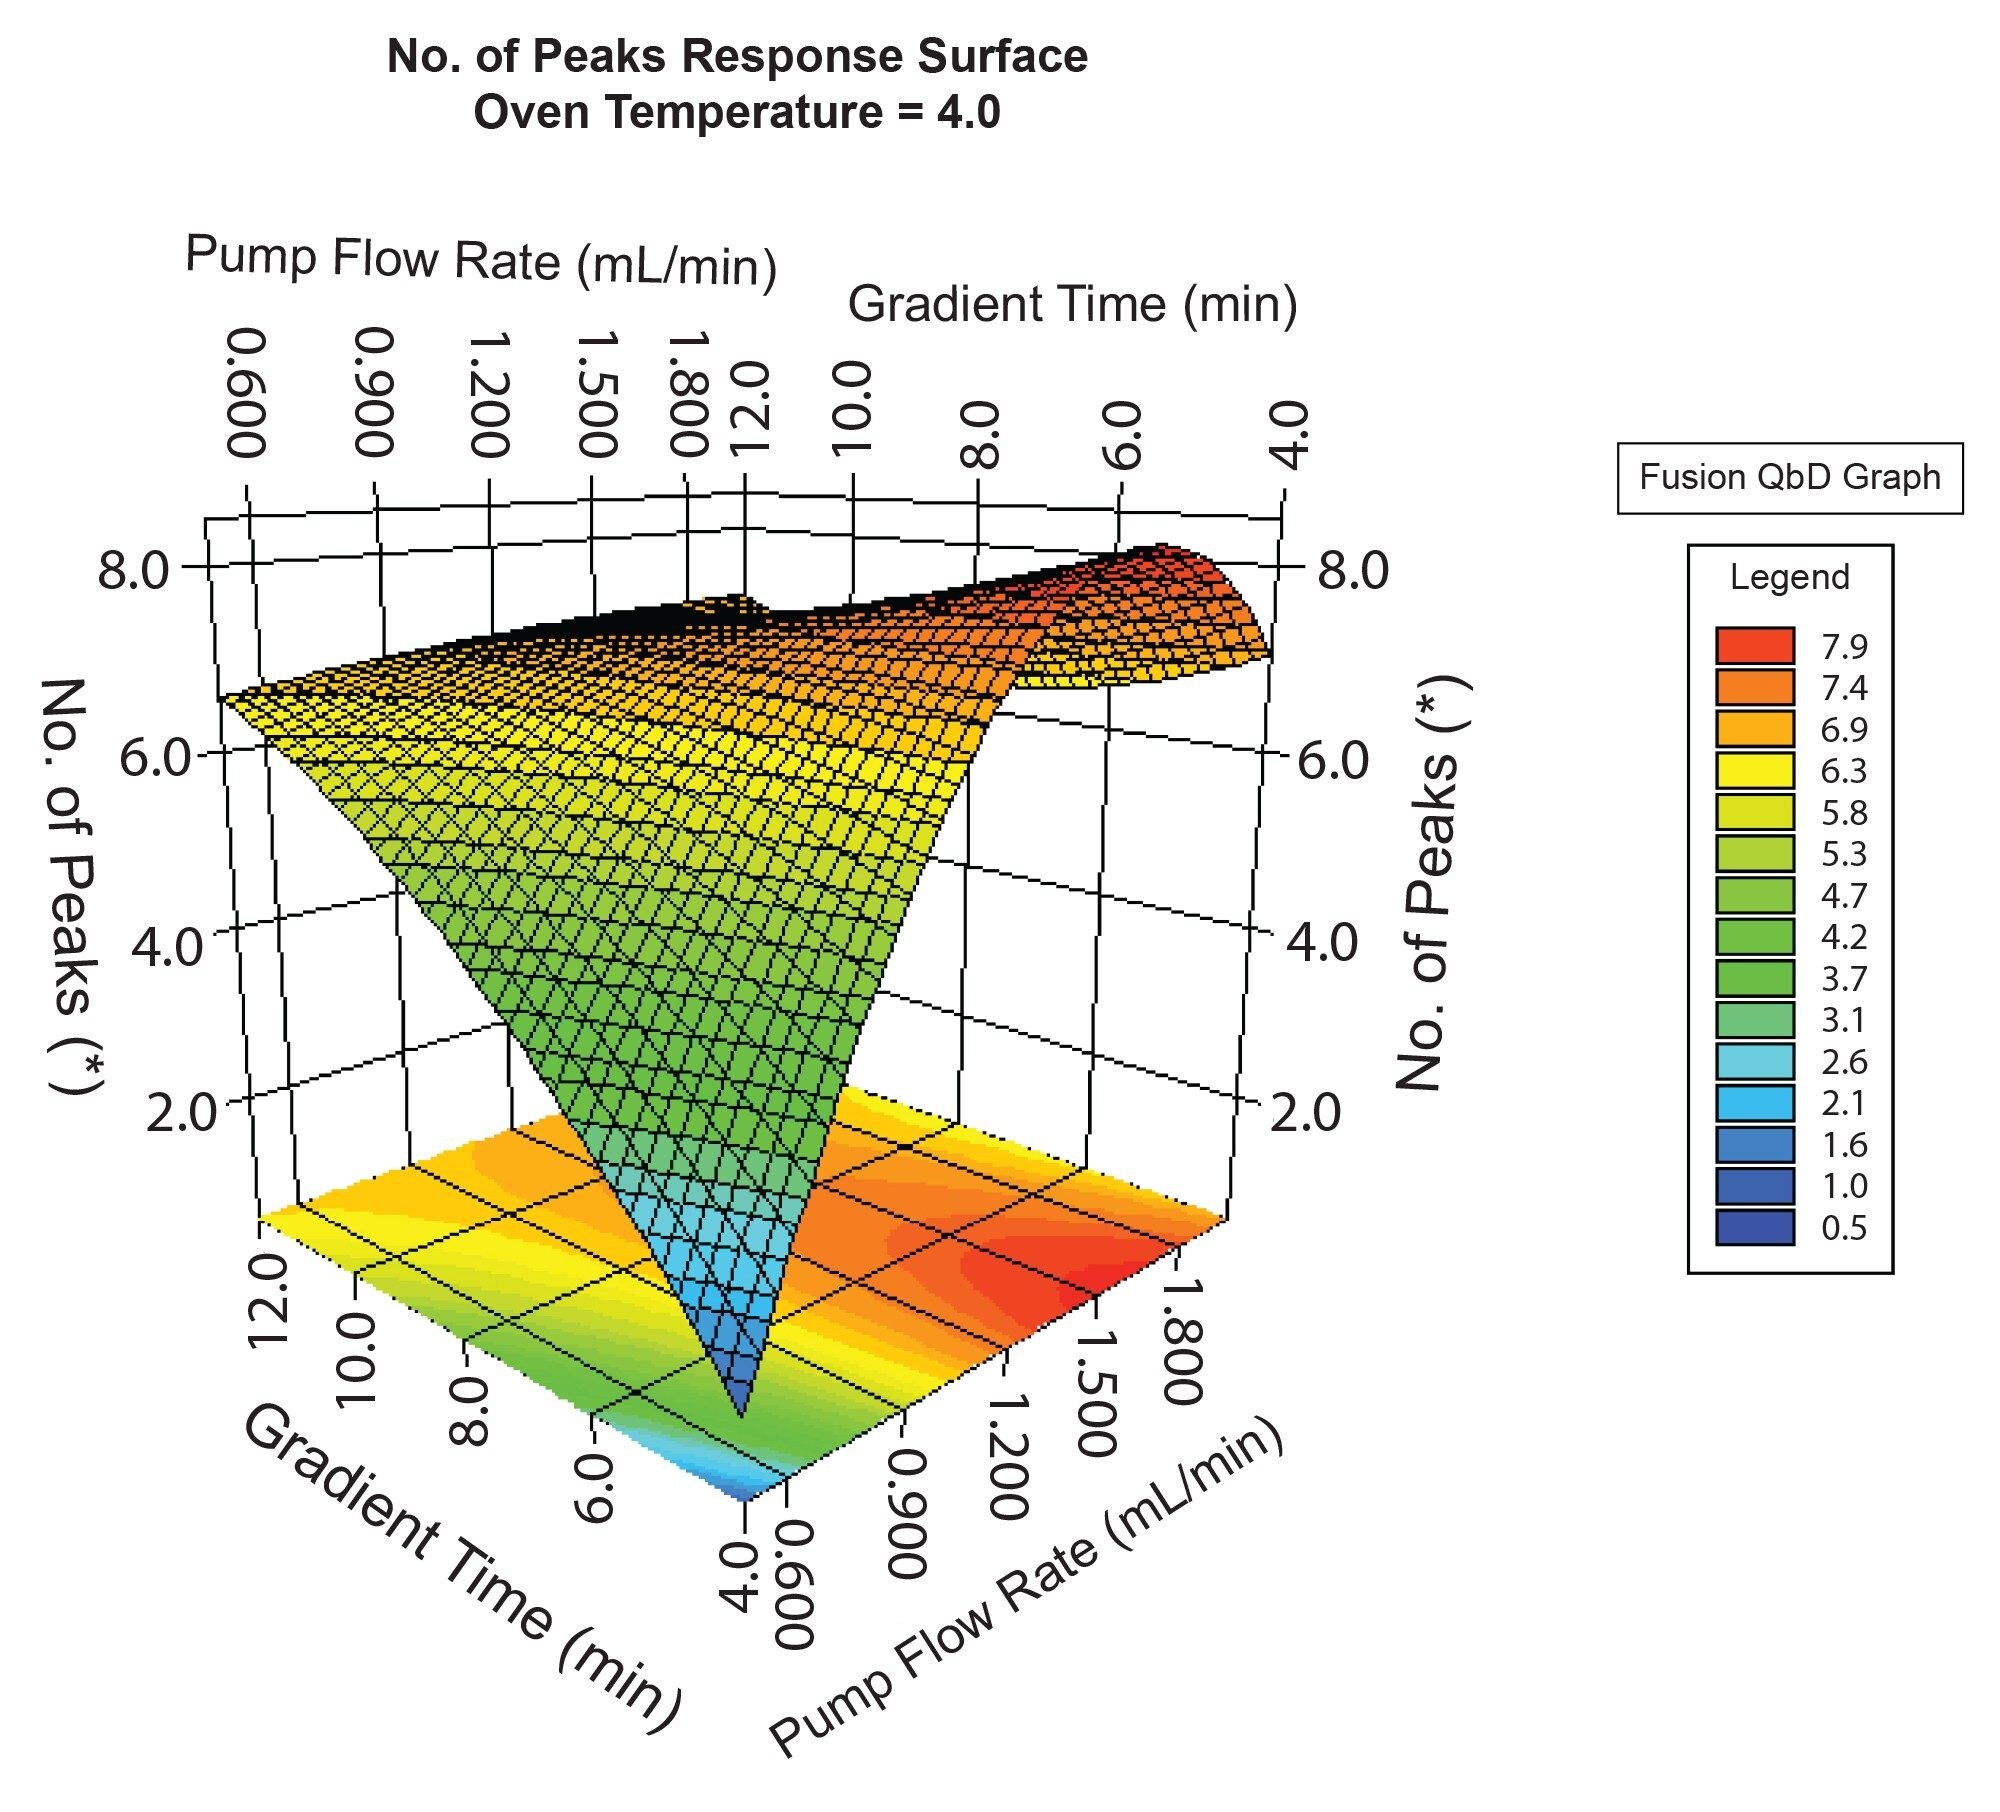
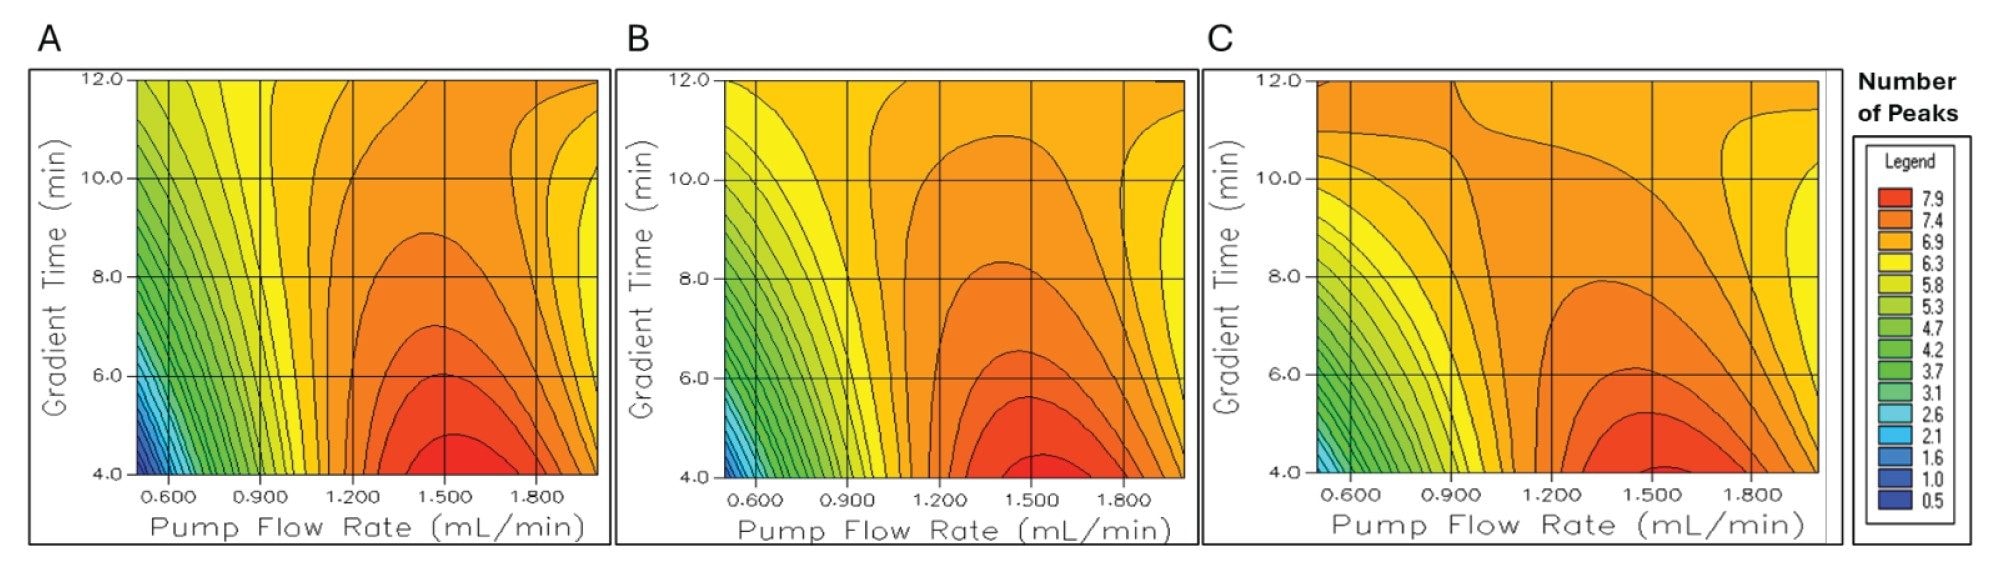
Peak elution order was the same as the traditional method in the screening and focused matrix chromatograms. Chromatographic peaks were identified using a UV spectral library previously generated from reference material injections using the PDA Detector and the Empower 3 Software (data not shown). A representative response surface plot summarizing the overall peak count (number of peaks) was shown in Figure 2, while 2-dimensional contour plots to compare the peak count at 30 °C, 45 °C and 60 °C were summarized in Figure 3. Red and orange regions in the figures indicated that the peak count was greatest when combining the highest flow rate (2.000 mL/min) with a low gradient time (4.0 minutes). Peak count remained stable until flow rates decreased to less than 1.100 mL/min. Operation of the separation method below this flow rate resulted in incomplete elution of all seven peaks from the column within the specified target method run time of 11.0 minutes.
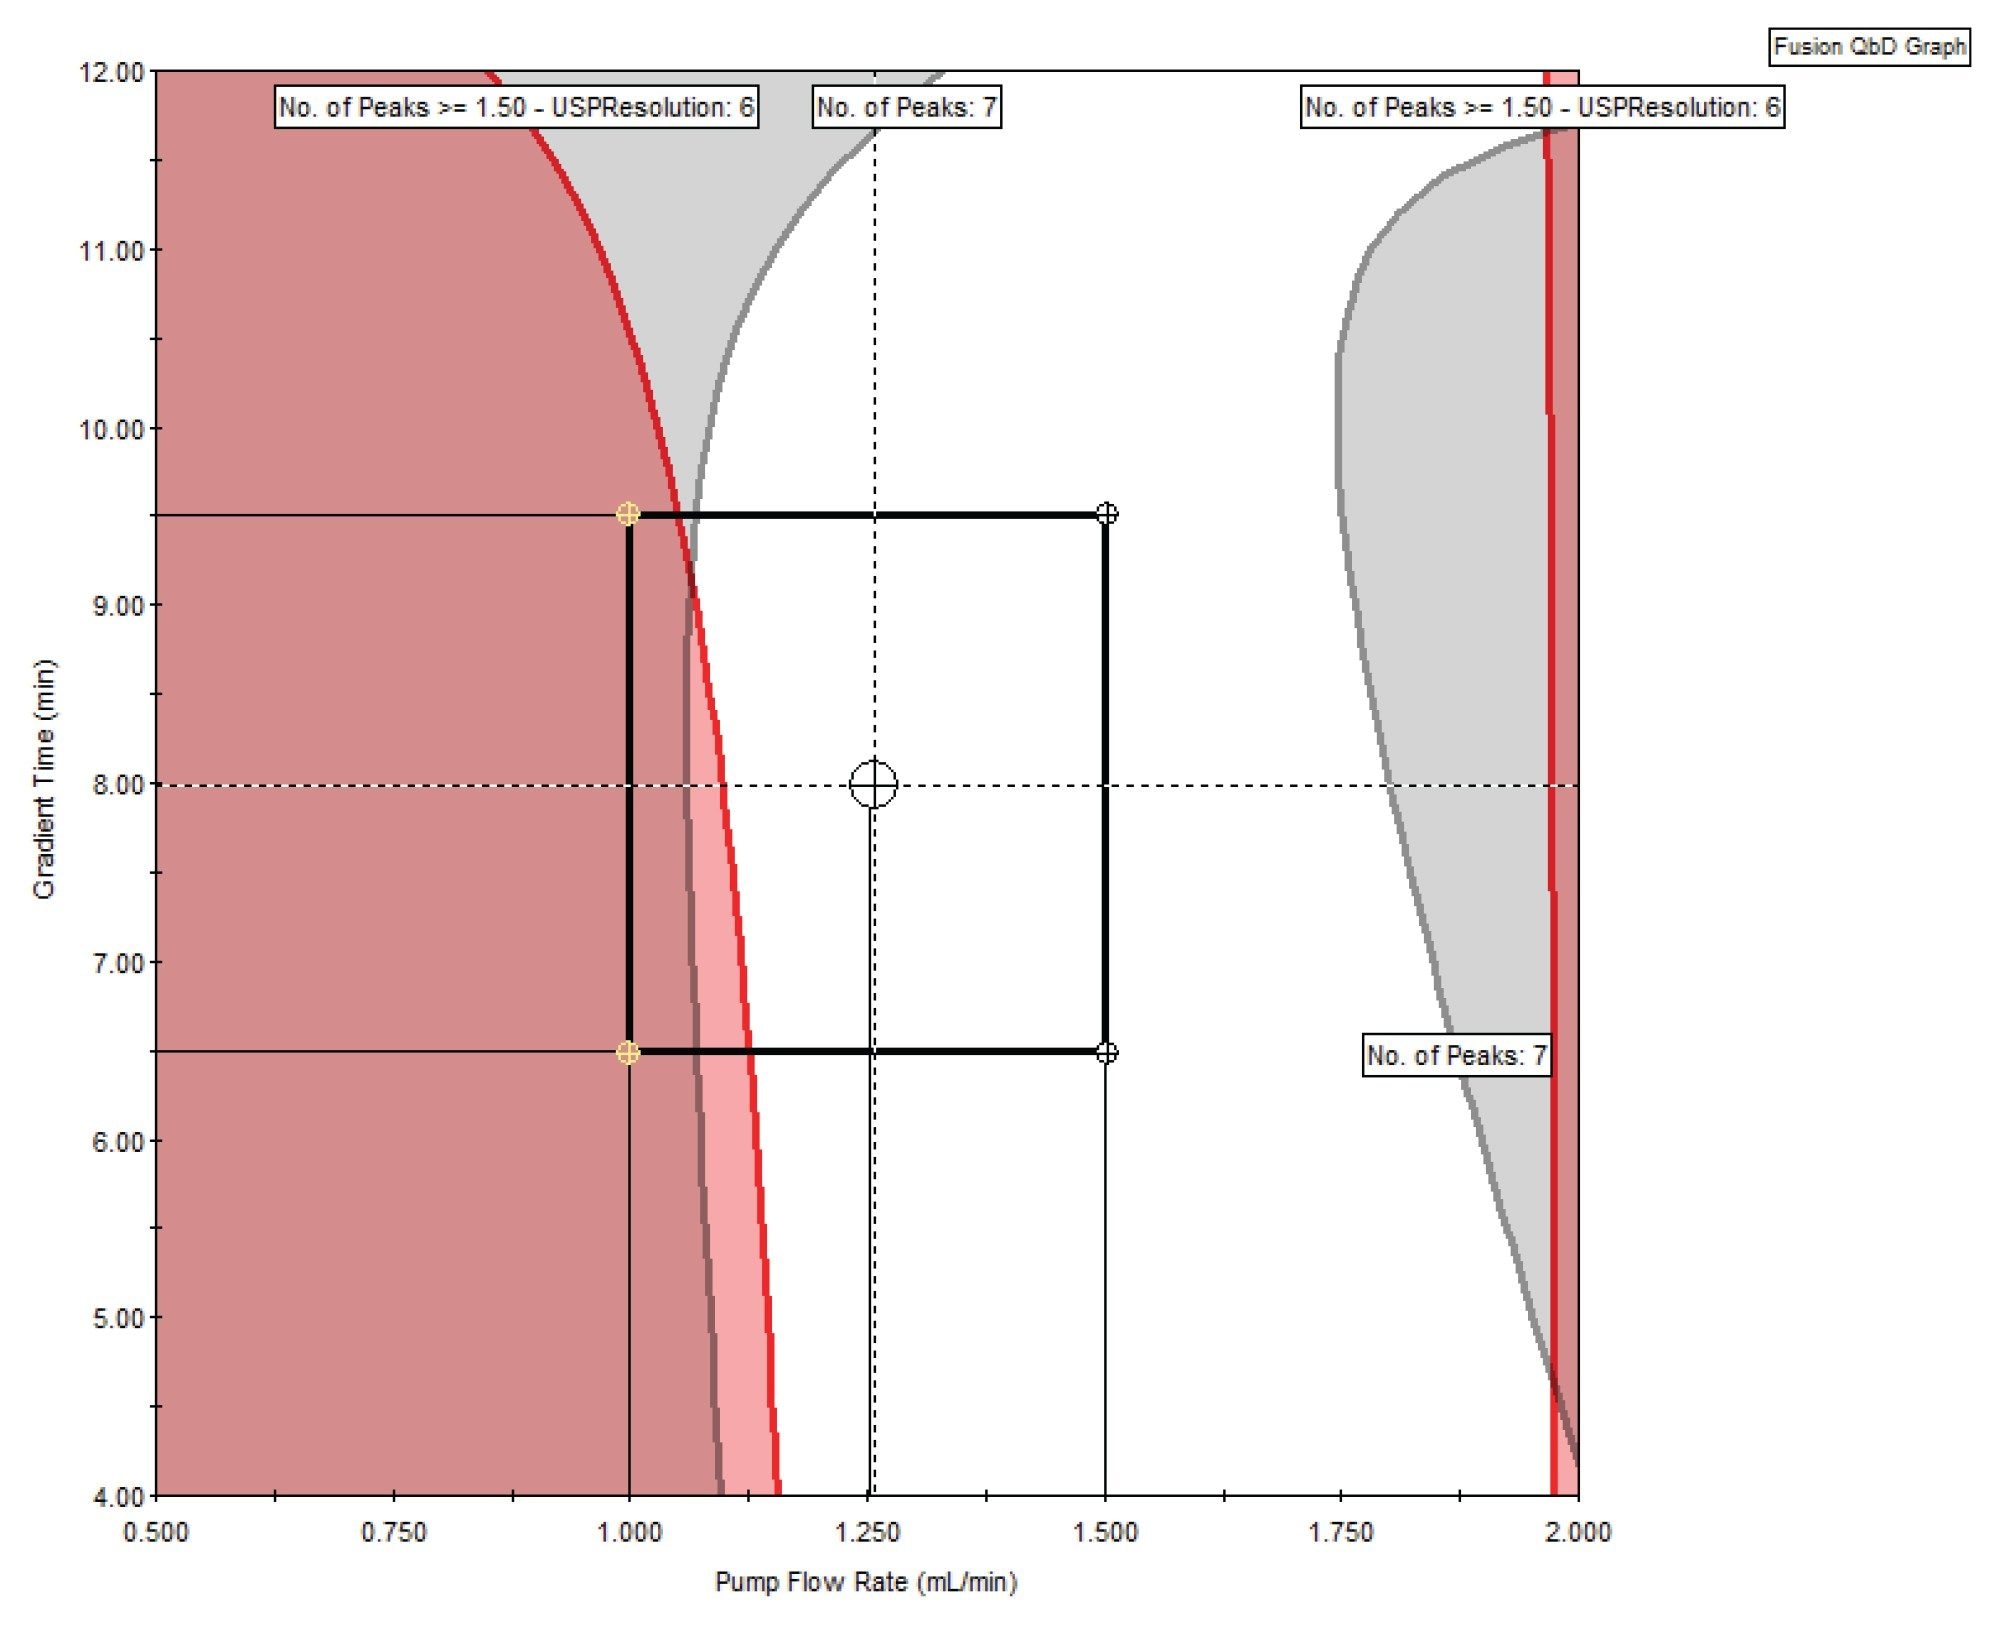
The modified contour overlay plot (Figure 4) summarized SST peak performance at 40 °C. The white region of the plot denoted the Acceptable Performance Region (APR),3 in which SST method requirements were met. The red and grey shaded regions indicated theoretical performance boundaries, or method conditions under which SST requirements did not pass system suitability criteria. Method parameter conditions selected for the focused matrix ( ±25% variation) were conveyed by the four corners of the square as shown within the APR, while the intersection of the four lines indicated the traditional method separation conditions.4
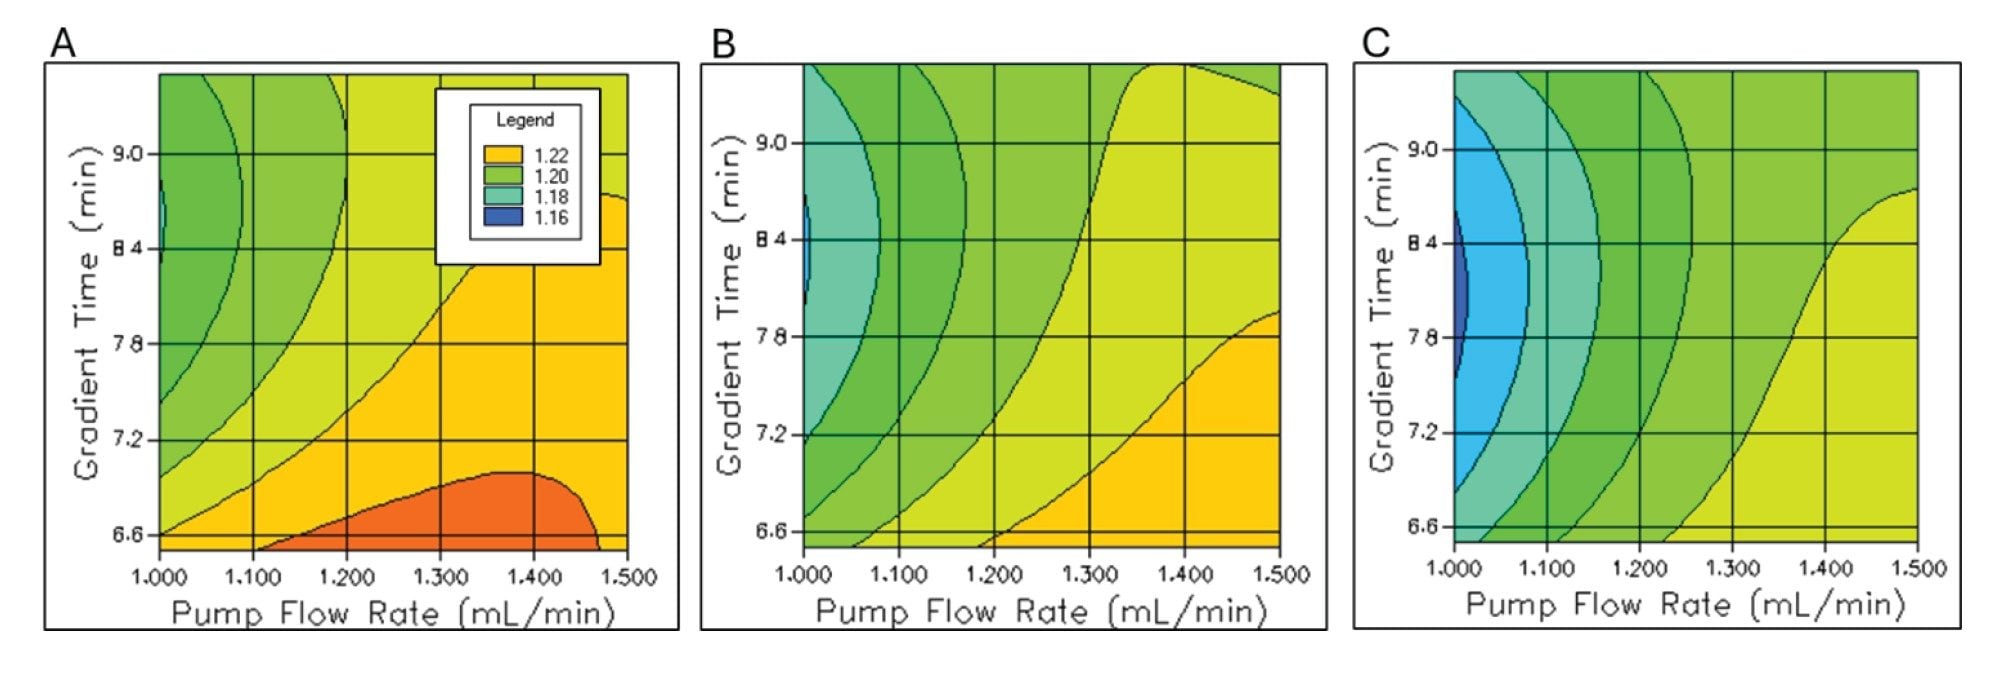
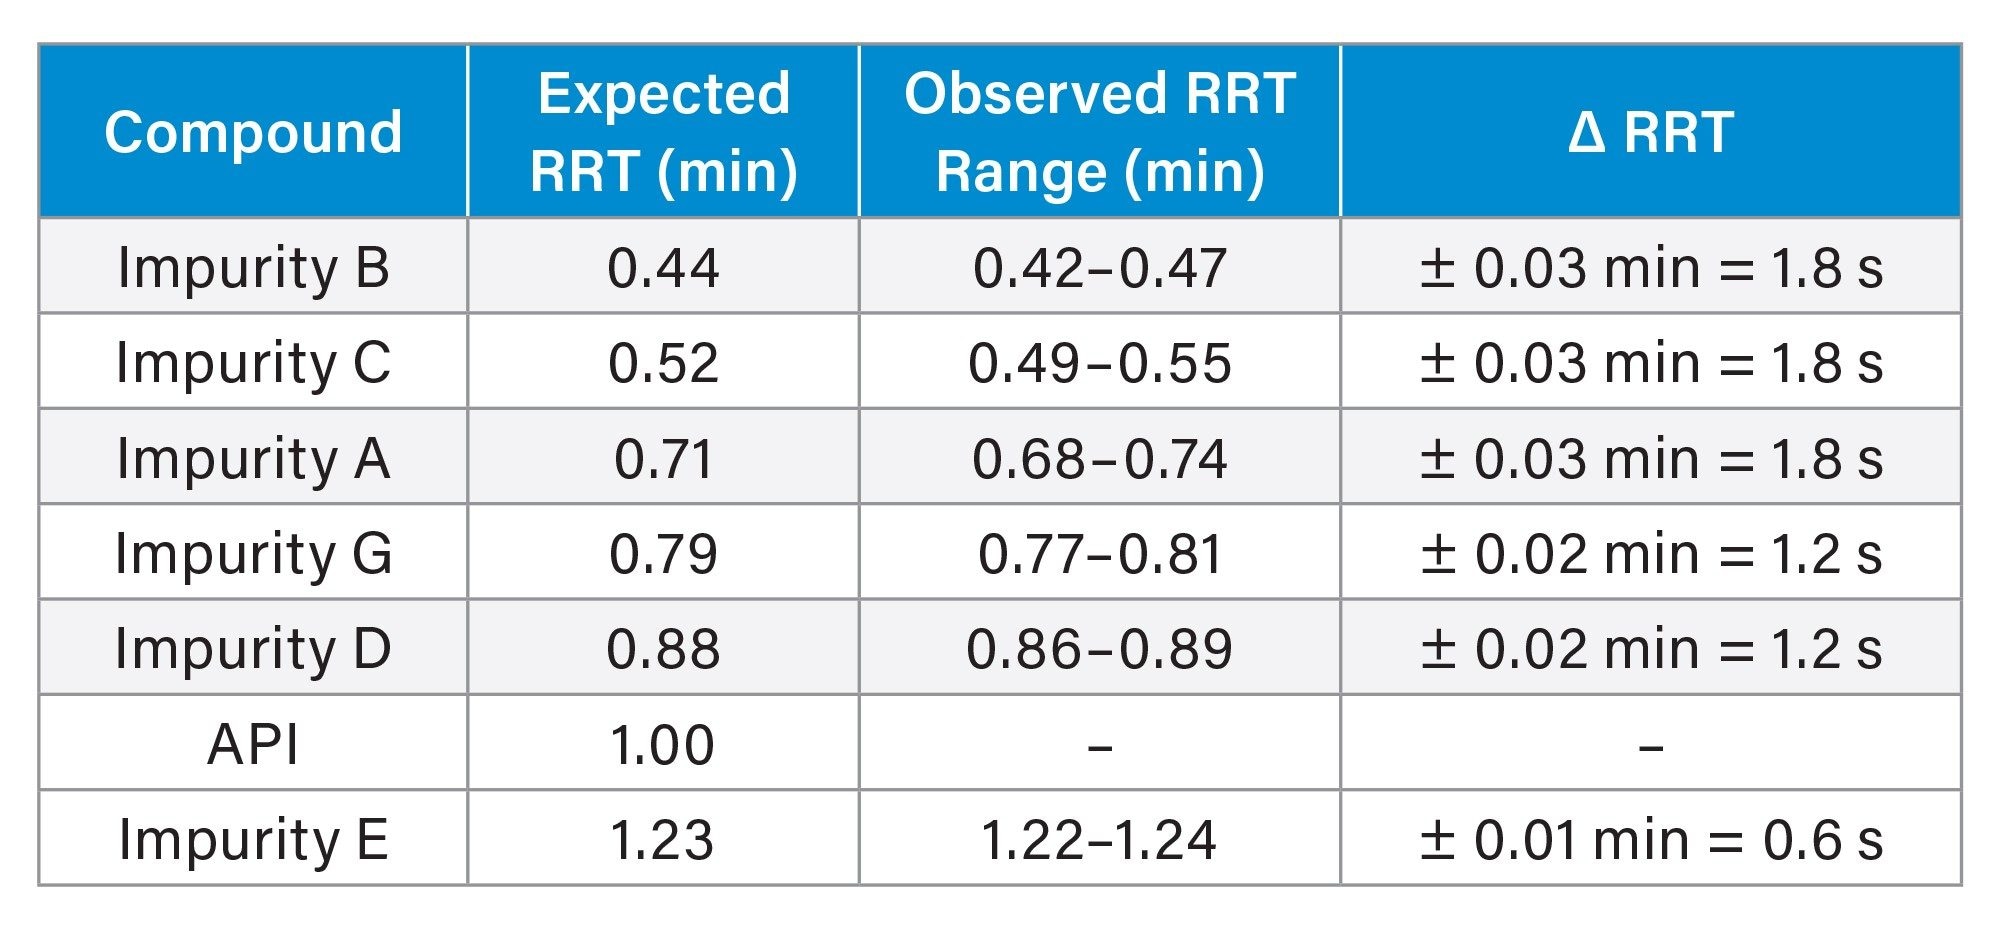
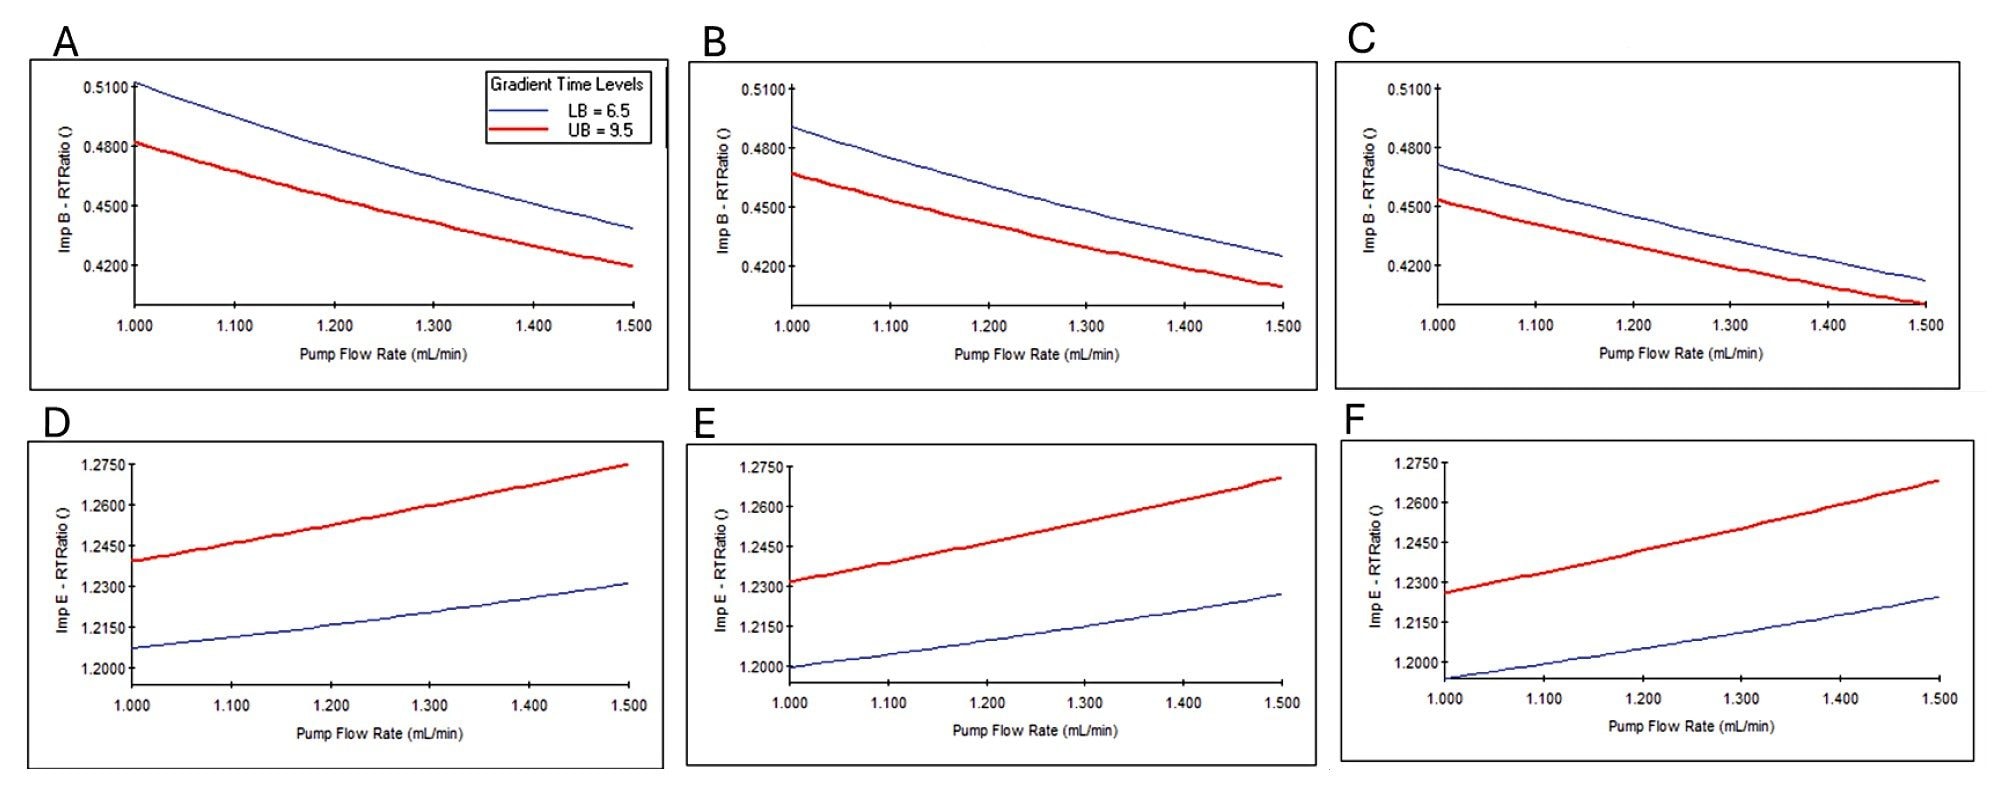
When using QbD software to perform method development, performance verification runs are typically employed to confirm predictions within the APR. In this case, verification runs were performed to include a ±25% parameter range outside of the traditional method conditions. The goal was not to verify the “Proven Acceptable Range (PAR)”4 for the current instrument configuration, but to gather information regarding individual peak performance trends, i.e. peak symmetry (tailing) and RRT. The USP resolution of the API did not significantly change across the verification runs, therefore there was no risk to API assay quantification accuracy under enhanced conditions. For the impurities, RRTs varied by less than two seconds when exposed to the focused conditions (Table 8). Retention behavior tracking for individual peaks was demonstrated by plotting flow rate versus RRT results for impurity B and impurity E, as representatives. The RRT progressively decreased for impurity B when temperature increased from 35 °C and 45 °C. The opposite trend was observed for Impuity E, as demonstrated by the inversion of the slope in Figure 5. Symmetry factor (tailing) for the PAR and impurities passed SST requirements under the focused conditions (Table 7), although the red and yellow regions of the individual contour plots indicated that symmetry factor (tailing) results can be further optimized by moving to lower column temperatures than 40 °C, specified in the traditional method (Figure 6).
Method Lifecycle Considerations
The user can make decisions to support method transfer activities with the enhanced method performance information provided by the QbD data.4,5 From the summary plots presented in this application, a risk assessment checklist such as the “Alliance iS HPLC System: Method Transfer Evaluation Checklist”6 can be executed, in conjunction with an Ishikawa (fishbone) diagram 4 and performance risk-based heat map.
The enhanced screening data revealed that the highest risk to overall SST performance occurred at flow rates below 1.100 mL/min. Flow accuracy should be labeled as “high risk” for method transfer and flagged in an Ishikawa (fishbone) diagram for increased focus during future method transfer activities. Conversly, the focused QbD results revealed that column temperatures did not significantly impact overall API or impurity peak performance. Therefore, the instrument column heater configuration was categorized as “low risk” during the method transfer risk assessment and removed from the Ishikawa diagram for continued focus.
Conclusion
Modern USP and ICH regulatory principles were applied to generate enhanced knowledge regarding the performance of a legacy assay and impurities separation method. Performance trends were observed during exposure to QbD derived method conditions, and trends were summarized in visual plots and statistical analysis. For methods previously developed with the traditional approach, enhanced method performance data gained by performing screening and focused DoE studies aid in the establishment of method transfer risk assessment and control strategies. The Alliance iS HPLC System with PDA Detector was the ideal platform for the assessment due to its straightforward design, ease-of-use, emphasis on quality control, and compatibility with modern LC-focused DoE software.
References
1. “Q14 Analytical Procedure Development Guidance for Industry”, U.S. Department of Health and Human Services Food and Drug Administration Center for Drug Evaluation and Research (CDER) Center for Biologics Evaluation and Research (CBER), ICH-Quality, March 2024.
2. “Analytical Procedures Guidance for Industry,” U.S. Department of Health and Human Services Food and Drug Administration Center for Drug Evaluation and Research (CDER) Center for Biologics Evaluation and Research (CBER), ICH-Quality, Revision 2. March 2024.
3. Fusion QbD Software, LC Method Development User’s Guide. S-Matrix Corporation.
4. Fadi Alhateeb; P.D. Rainville. “Analytical Quality-by-Design Based Method Development for the Analysis of Formoterol, Budesonide, and Related Compounds Using UHPLC-MS”, Waters Corporation, 720006696, October 2019.
5. “Mitigating Risk of Validated Analytical Procedure Failures When Upgrading or Replacing LC Assets: Harnessing the Power of Quality by Design (QbD) Principles”, Waters Corporation, 720007222, May 2021.
6. “Alliance iS HPLC System: Method Transfer Evaluation Checklist”, Waters Corporation, 715010208, October 2025.
Featured Products
720009346, May 2026