Using Targeted MRM MS Imaging With DESI to Visually Localize Isobaric And/or Low Abundance Lipids
Abstract
DESI technique ionizes small molecules such as lipids, efficiently directly from surfaces such as tissue sections, without any sample preparation step. Triple Quadrupole (TQ) Mass Spectrometers are renowned for their sensitivity and specificity when targeted MRM mode of acquisition is used. When implemented with a DESI Mass Spectrometry Imaging (MSI) workflow, the spatial localisation of compounds can be easily visualized. Here, we have implemented DESI targeted MS Imaging (via MRM) methods using the DESI™ XS source mounted on the Xevo™ TQ Absolute Triple Quadrupole Mass Spectrometer. This workflow allowed the determination of the distribution of low abundant and/or isobaric and isomeric compounds from brain tissue sections.
Benefits
- Demonstrating the use of targeted Mass Spectrometry Imaging (MSI)™ workflow with MRM acquisition to map isobaric and isomeric molecules using diagnostic product ions
- Isobaric and isomeric endogenous molecules have different distributions in rodent brain pointing to differential functionality
- Superior specificity and sensitivity of targeted MS Imaging DESI workflow for detecting and visualizing low abundance molecules directly from surfaces
Introduction
The suitability of Desorption Electrospray Desorption Ionization (DESI) for ionizing lipids efficiently, directly from surfaces such as tissue sections, without any significant sample preparation step – has extensively been reported over the last decade.
In a discovery full scan MS workflow, abundant lipids that ionize the most efficiently, such as phospholipids are preferentially detected and therefore more easily imaged. Using a high mass resolution mass spectrometer, isobaric molecules (of nearly the same mass) can be separated based on their m/z. With the addition of ion mobility separation (IMS), it is possible to separate isomeric molecules (of exactly the same elemental composition). A third method to separate isobars/isomers is to perform tandem mass spectrometry by selecting the precursor ions with similar m/z, fragment them in the collision cell and monitor a diagnostic product ion for each molecule.
Using this approach, we have implemented a targeted MS Imaging multiple reaction monitoring (MRM) DESI method using the DESI XS source mounted on the Xevo TQ Absolute Triple Quadrupole Mass Spectrometer, allowing the spatial determination of isobaric and isomeric lipids from rodent brain tissue sections.
Furthermore, isomeric hydroxyeicosatetraenoic acids (HETE) which are low in abundance and difficult to detect directly from tissue were imaged with a good signal intensity due to the selectivity of the MRM acquisitions.
Experimental
Sample Description/Preparation
Rodent brain tissue sections were generated from snap-frozen tissue that were stored at -80 °C, using a cryostat (Leica) at 18 µm thickness and thaw-mounted onto standard microscope slides (1 x 3 inches). Tissue sections were kept at -80 °C until analysis.
Mass Spectrometry
Experiments were performed using a DESI XS source mounted on a Xevo TQ Absolute Triple Quadrupole mass spectrometer in MRM mode of acquisition. The DESI spray conditions were set at 2 µL/min, 95:5 MeOH/H2O using a µBSM nano pump and a N2 nebulizing gas pressure of 10 psi.
A DESI High-Performance sprayer (HPS) was utilized for improved sensitivity, DESI spray focus, robustness, and ease-of-use. Furthermore, a heated transfer line (HTL) was mounted directly onto the ion block of the Xevo TQ Absolute Triple Quadrupole Mass Spectrometer and heated to 450 °C for the negative mode isomeric phospholipid experiment. This enhanced the desorption and transfer of the charged droplets into the mass spectrometer resulting in increased sensitivity.
MS Conditions
|
MS systems: |
Xevo TQ Absolute Triple Quadrupole Mass Spectrometer |
|
|
Source type: |
DESI XS |
|
|
Polarity: |
Positive and Negative |
|
|
Source temperature: |
150 °C |
|
|
MS1 resolution: |
Unit (0.7 Da) |
|
|
MS2 resolution: |
Unit (0.7 Da) |
|
|
Experiment type: |
MRM |
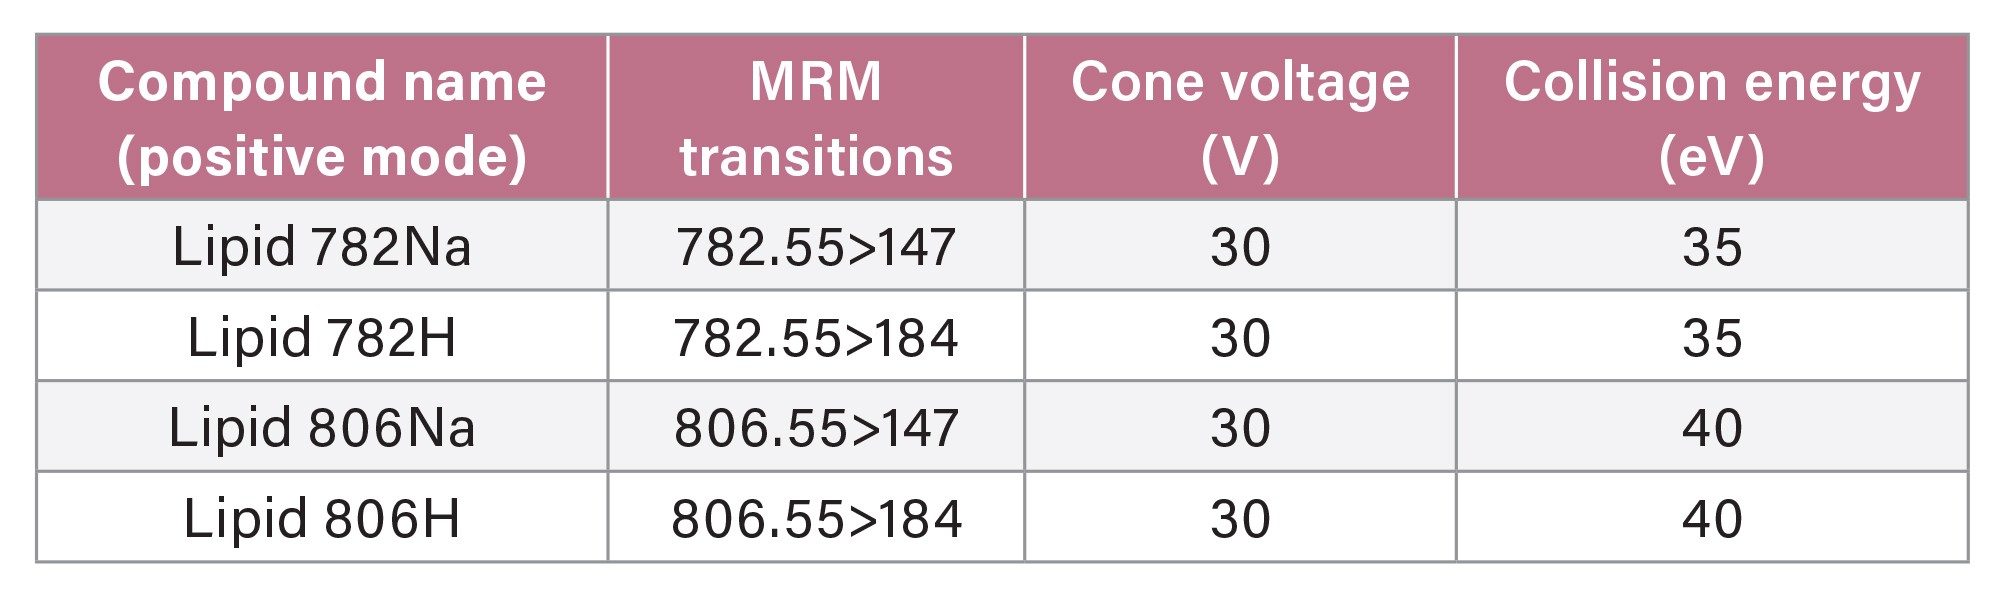
MRM Parameters in Positive Ionisation Mode
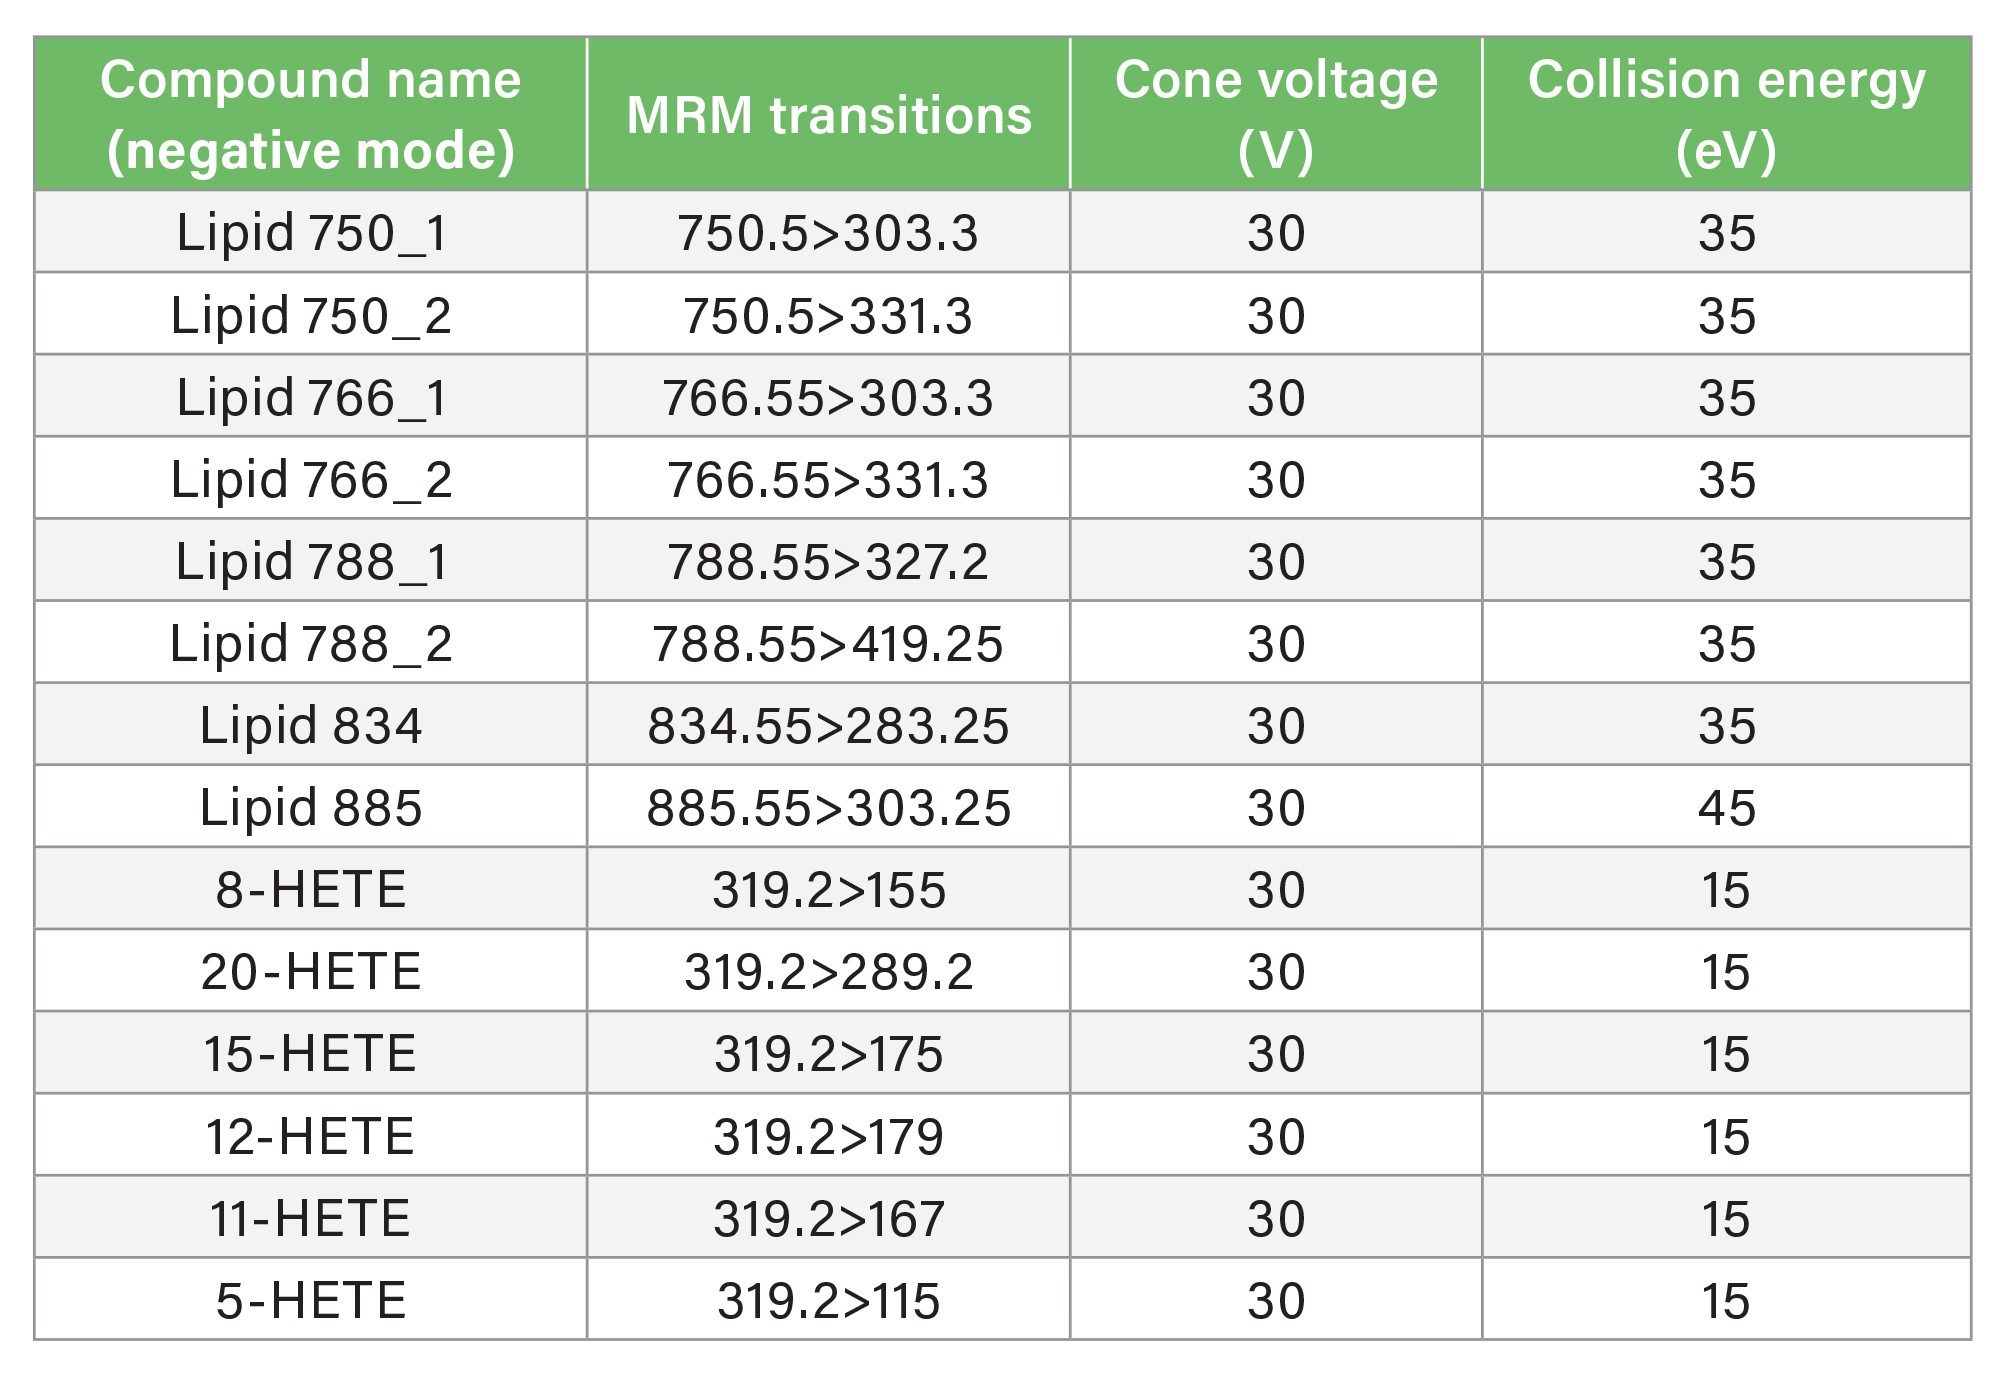
MRM Parameters in Negation Ionisation Mode
DESI Setup
|
Capillary voltage (kV) : |
0.65–0.70 |
|
Nitrogen flow (psi): |
10 |
|
Solvent: |
95% Methanol, 5% Water |
|
Solvent flow rate: |
2 µL/min |
|
Heated transfer line temperature: |
25 °C (positive) / 450 °C (negative) |
|
Pixel size: |
25 µm |
Data Management
|
MS software: |
MassLynx™ v4.2 Software (SCN 1046) (For Xevo TQ Absolute Triple Quadrupole Mass Spectrometer) |
|
Informatics: |
High Definition Imaging (HDI™) Software 1.8 |
Results and Discussion
Phospholipids are the main component forming the cell membrane lipid bilayer. This basic cellular structure acts as a barrier helping to protect the cell against environmental danger. Additionally, this phospholipid bilayer enables multiple intercellular and intracellular processes to occur.1 Understanding individual phospholipid localisation may help us to determine which compounds are moving in and out of certain substructures the tissues and aid understanding of their biological mechanism or process alterations occurring due to disease state.
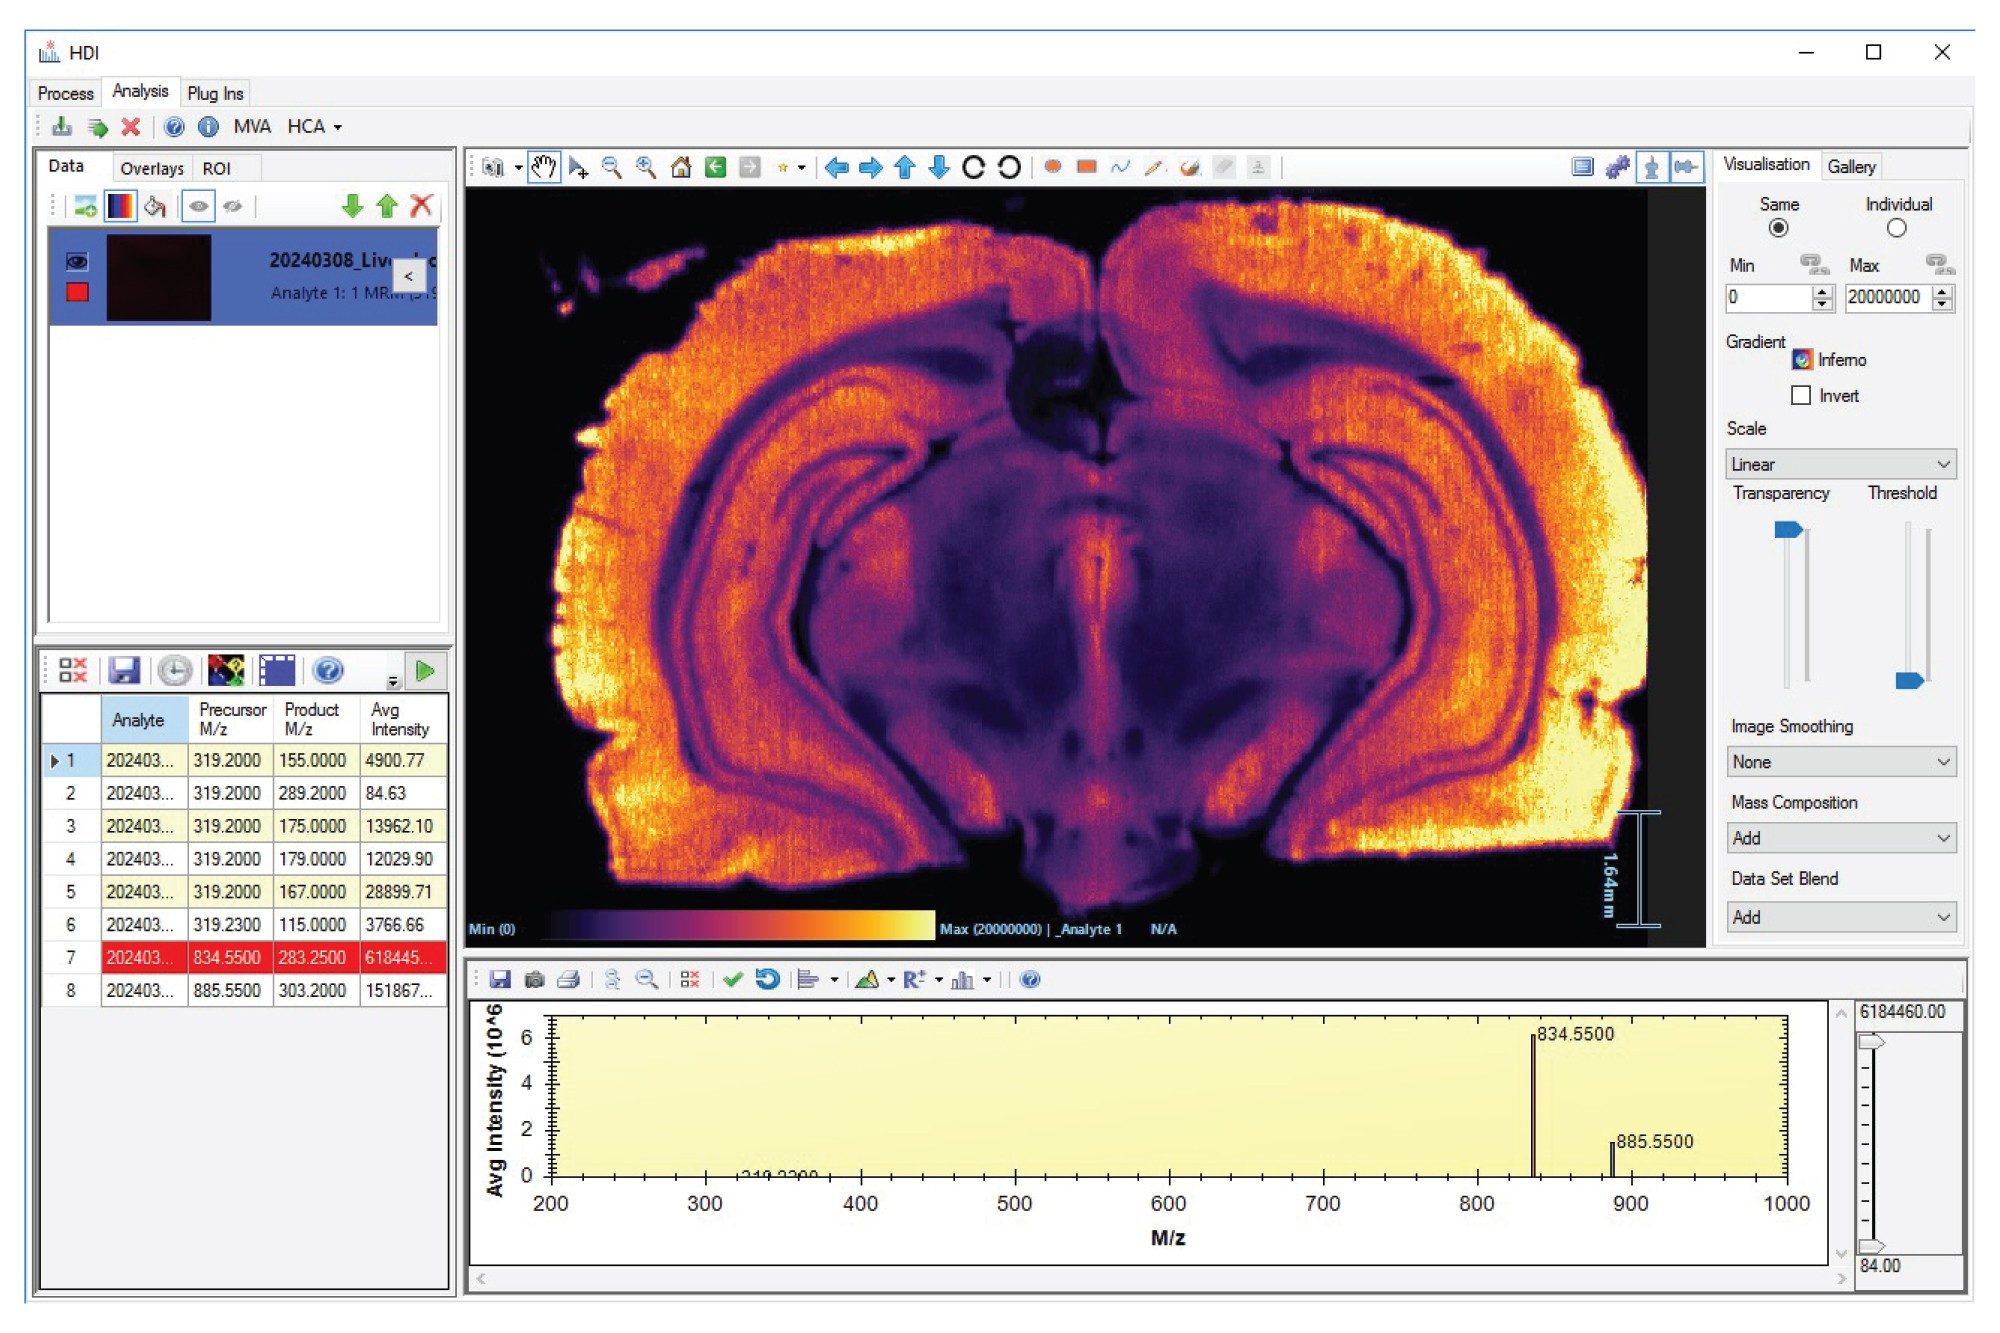
All DESI MSI MRM processed datasets were easily loaded and visualized in High Definition Imaging (HDI) Software 1.8 as shown in Figure 1, where the ion image of MRM m/z 834.55>283.25 is displayed. The product ion with an m/z of 283.25 corresponds to fatty acid chain FA [18:0] with a precursor m/z of 834.55 putatively identifies this lipid as PS [18:0_22:6], H-.
A) Phospholipids Analyzed in Positive Mode
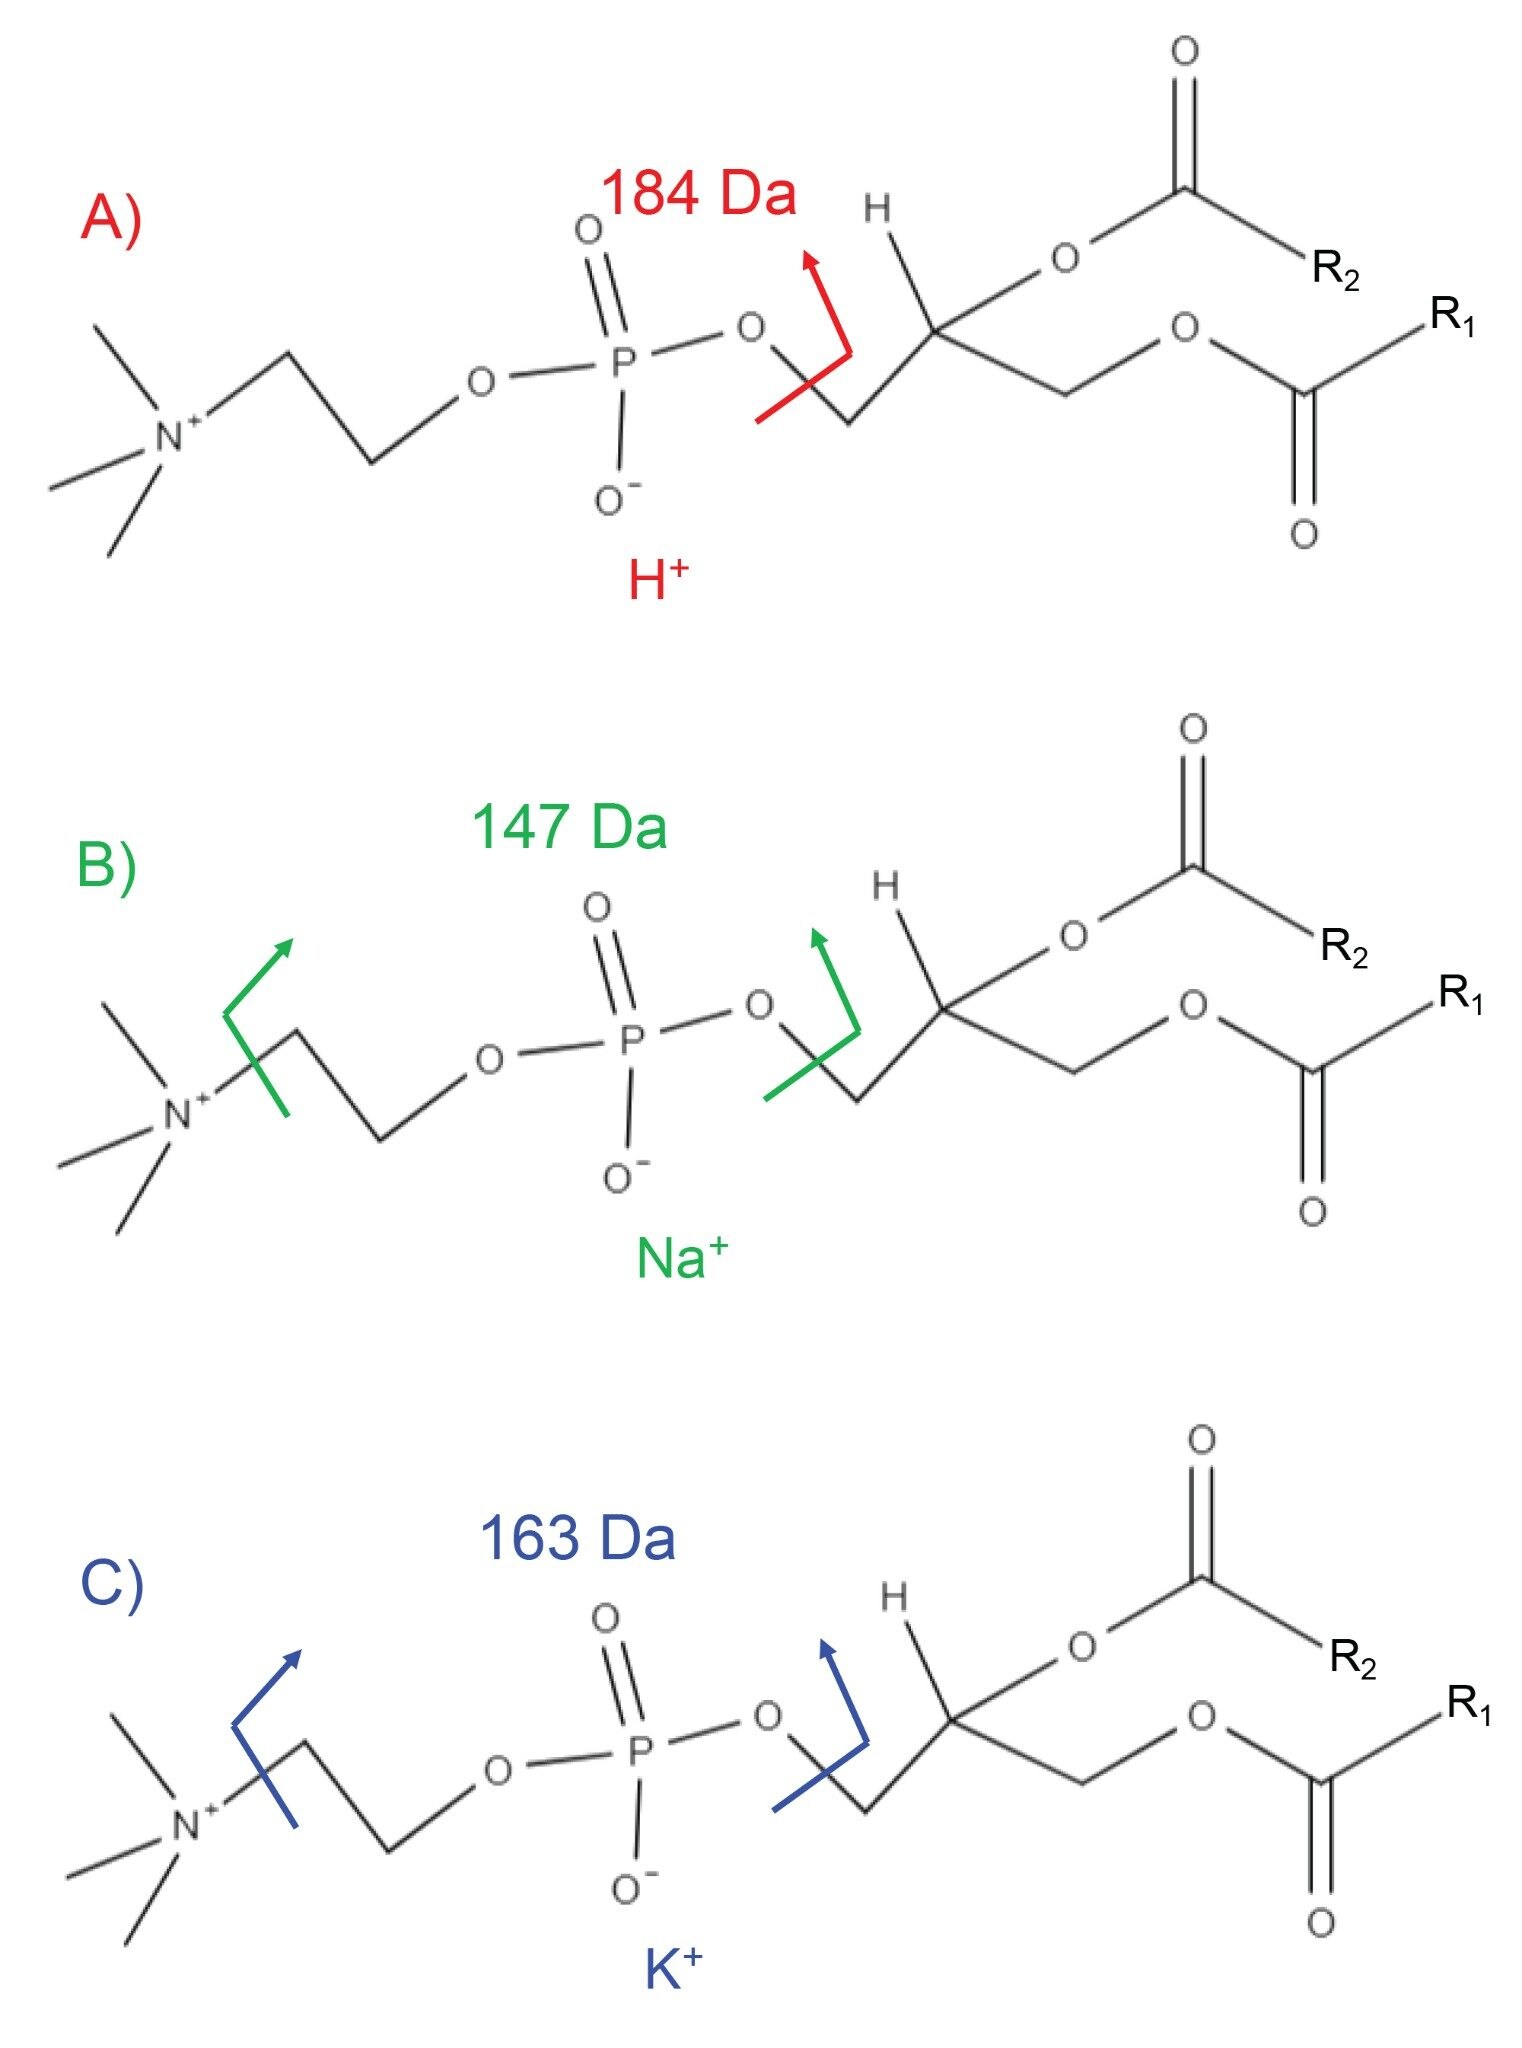
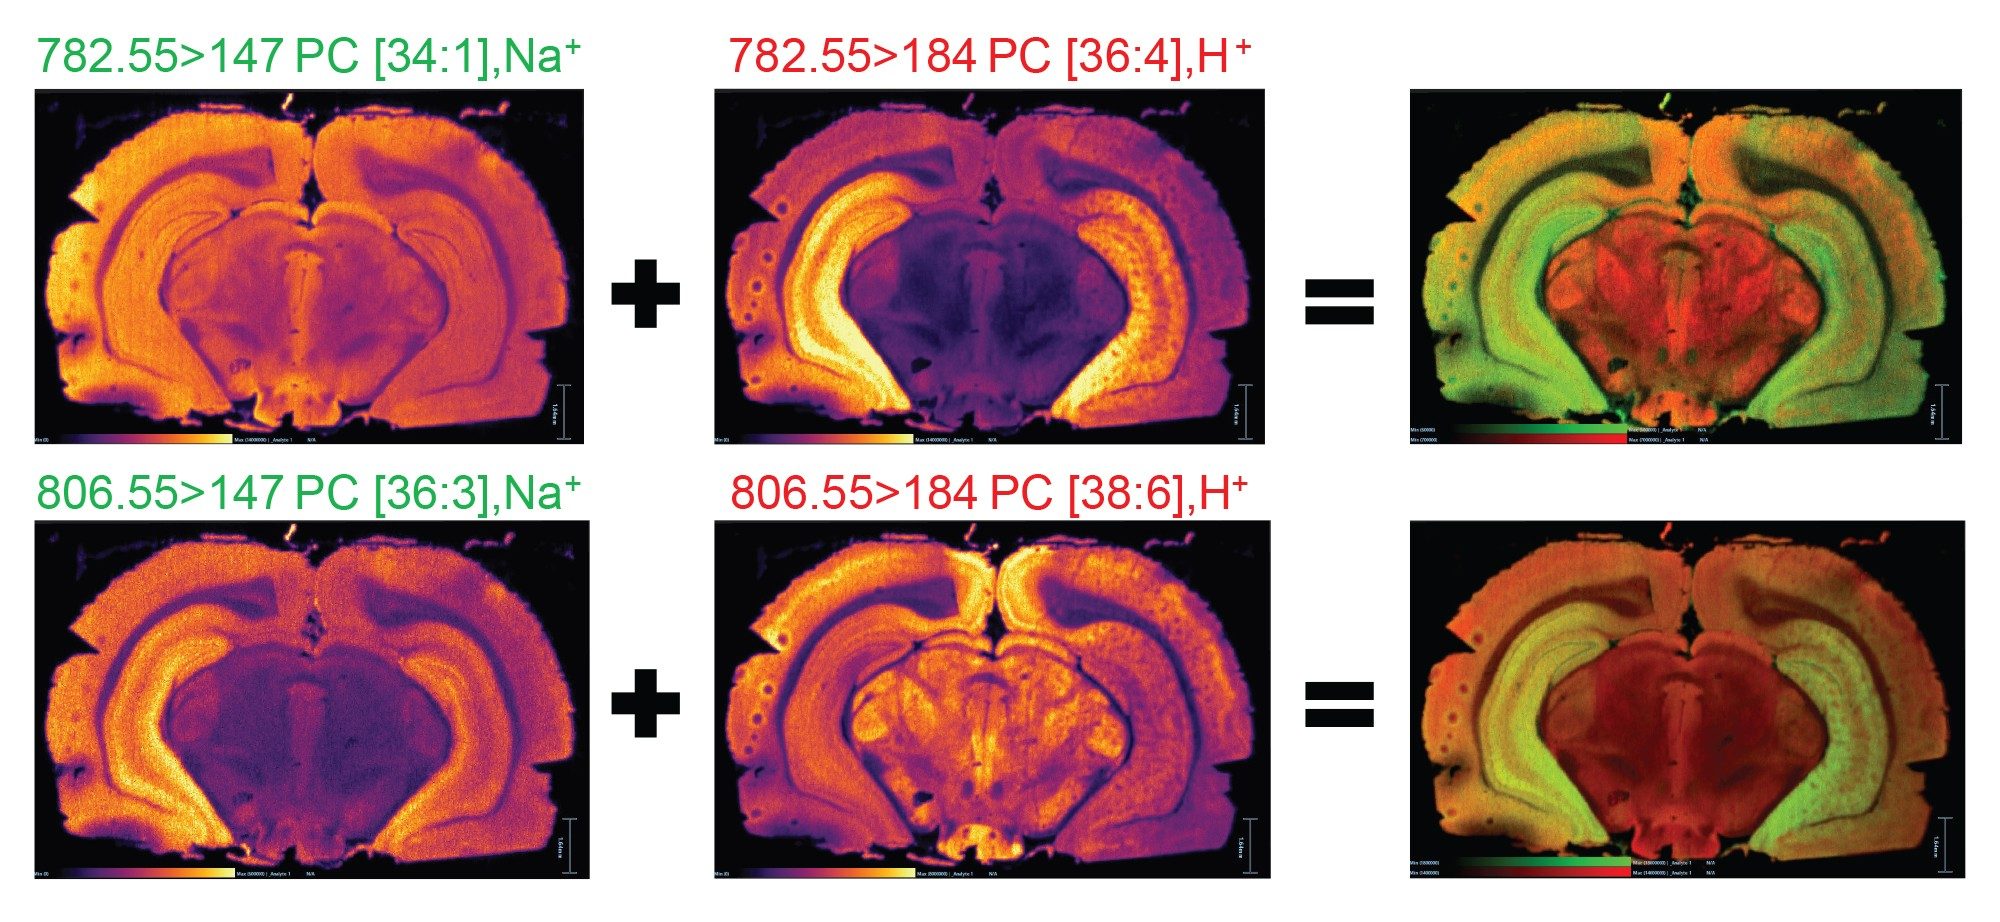
Phospholipid molecules such as phosphatidylcholines (PCs) are a major component of biological membranes and as such are highly abundant in mammalian tissue. They ionize very efficiently by DESI with proton, sodium and/or potassium cations when analyzed directly from tissue section in positive ionization mode. The presence of multiple adducts complicates the full MS spectrum and subsequent compound identification, resulting in multiple peaks being present within a 1 Da window (corresponding to various PCs containing different cations). However, when subjected to an MS/MS experiment, the headgroup of the PCs fragments easily and fragment ions are diagnostic to the type of cation charging the precursor ion, as seen in Figure 2. These diagnostic fragment ions give increased confidence as to the correct identification of the lipid.
By setting the MRM transition to correspond with the headgroup of a specific cation, it was possible to display the different distribution isobaric lipids. For example, two isobaric lipids at m/z 782.55 putatively identified as sodiated PC [34:1] and protonated PC [36:4] distributions are shown in Figure 3A. A second example is displayed in Figure 3B for two isobaric lipids m/z 806.55: sodiated PC [36:3] and protonated PC [38:6].
B) Phospholipids Analyzed in Negative Mode
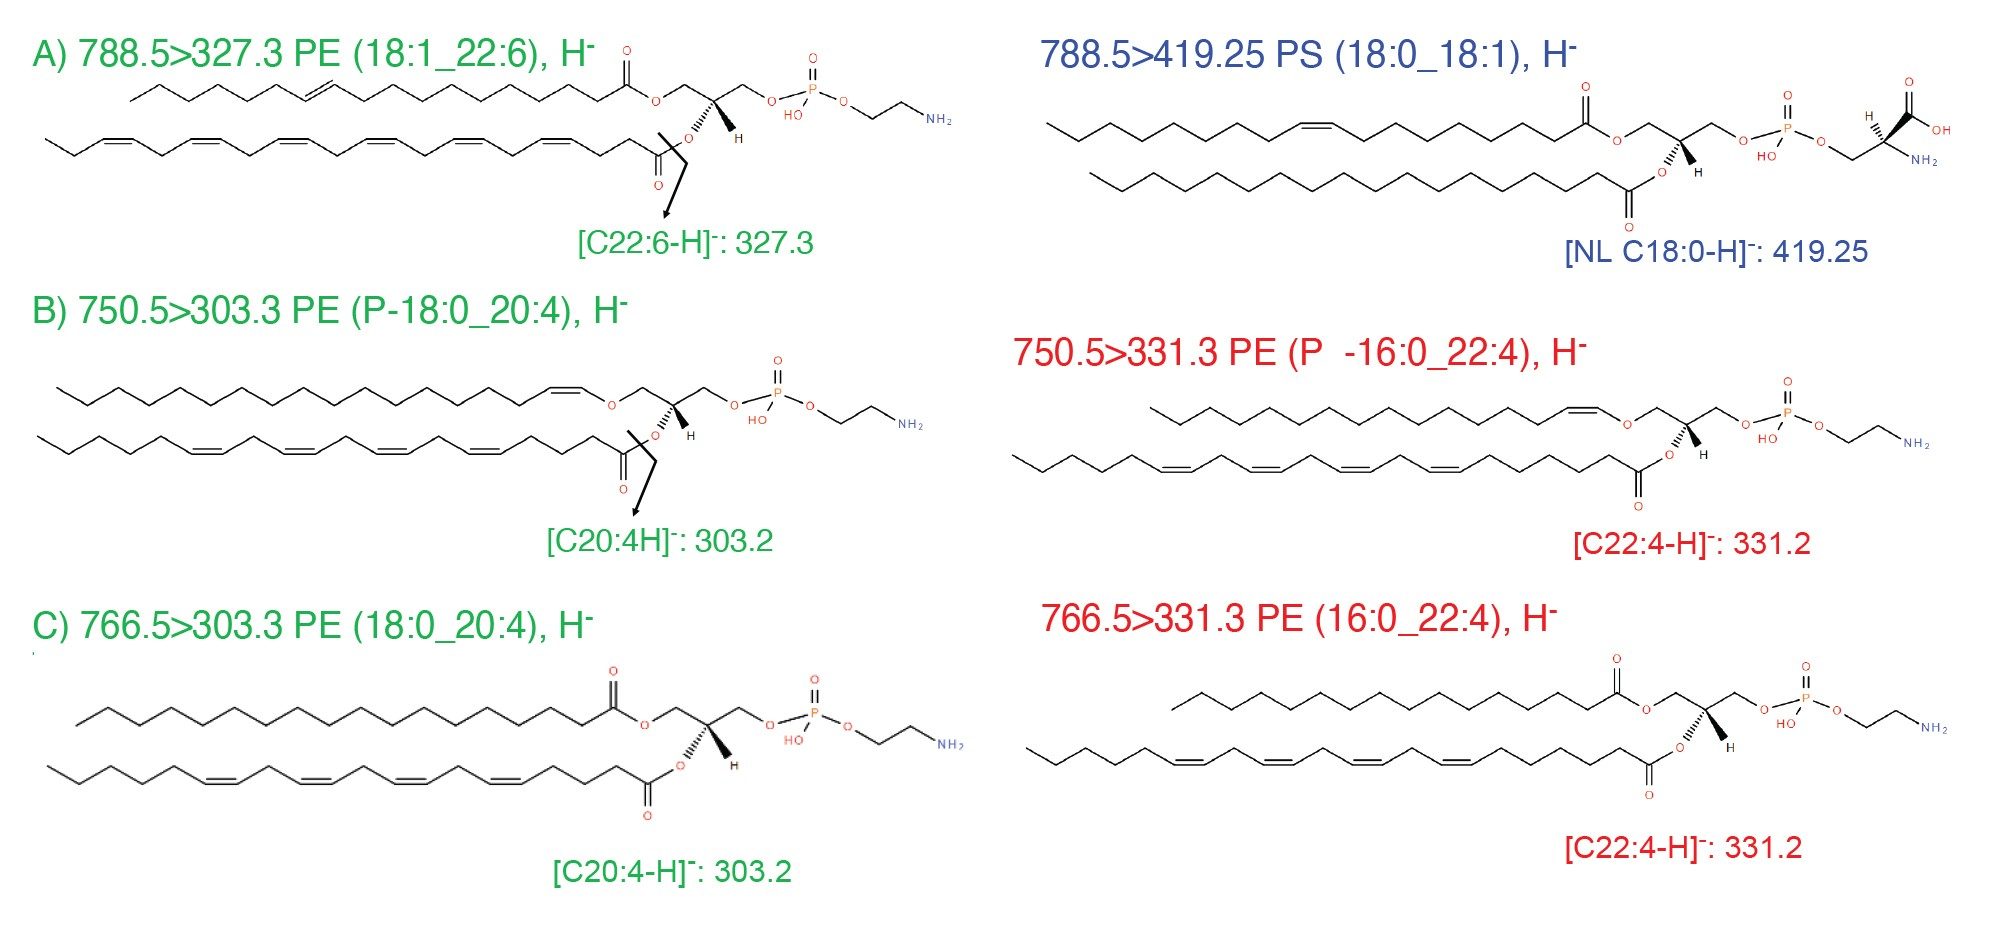
In negative mode, phospholipids produce intense fragments corresponding to the fatty acid chains R1COO- and R2COO-.
Examples of fragmentation are shown in Figure 4, with two isobaric lipids at m/z 788.5: PE (18:1_22:6) and PS (18:0_18:1), and two pairs of isomeric lipids at m/z 750.5: PE(P-18:0_20:4) and PE (P-16:0_22:4) and at m/z 766.6: PE (18:0_20:4) and PE (16:0_22:4).
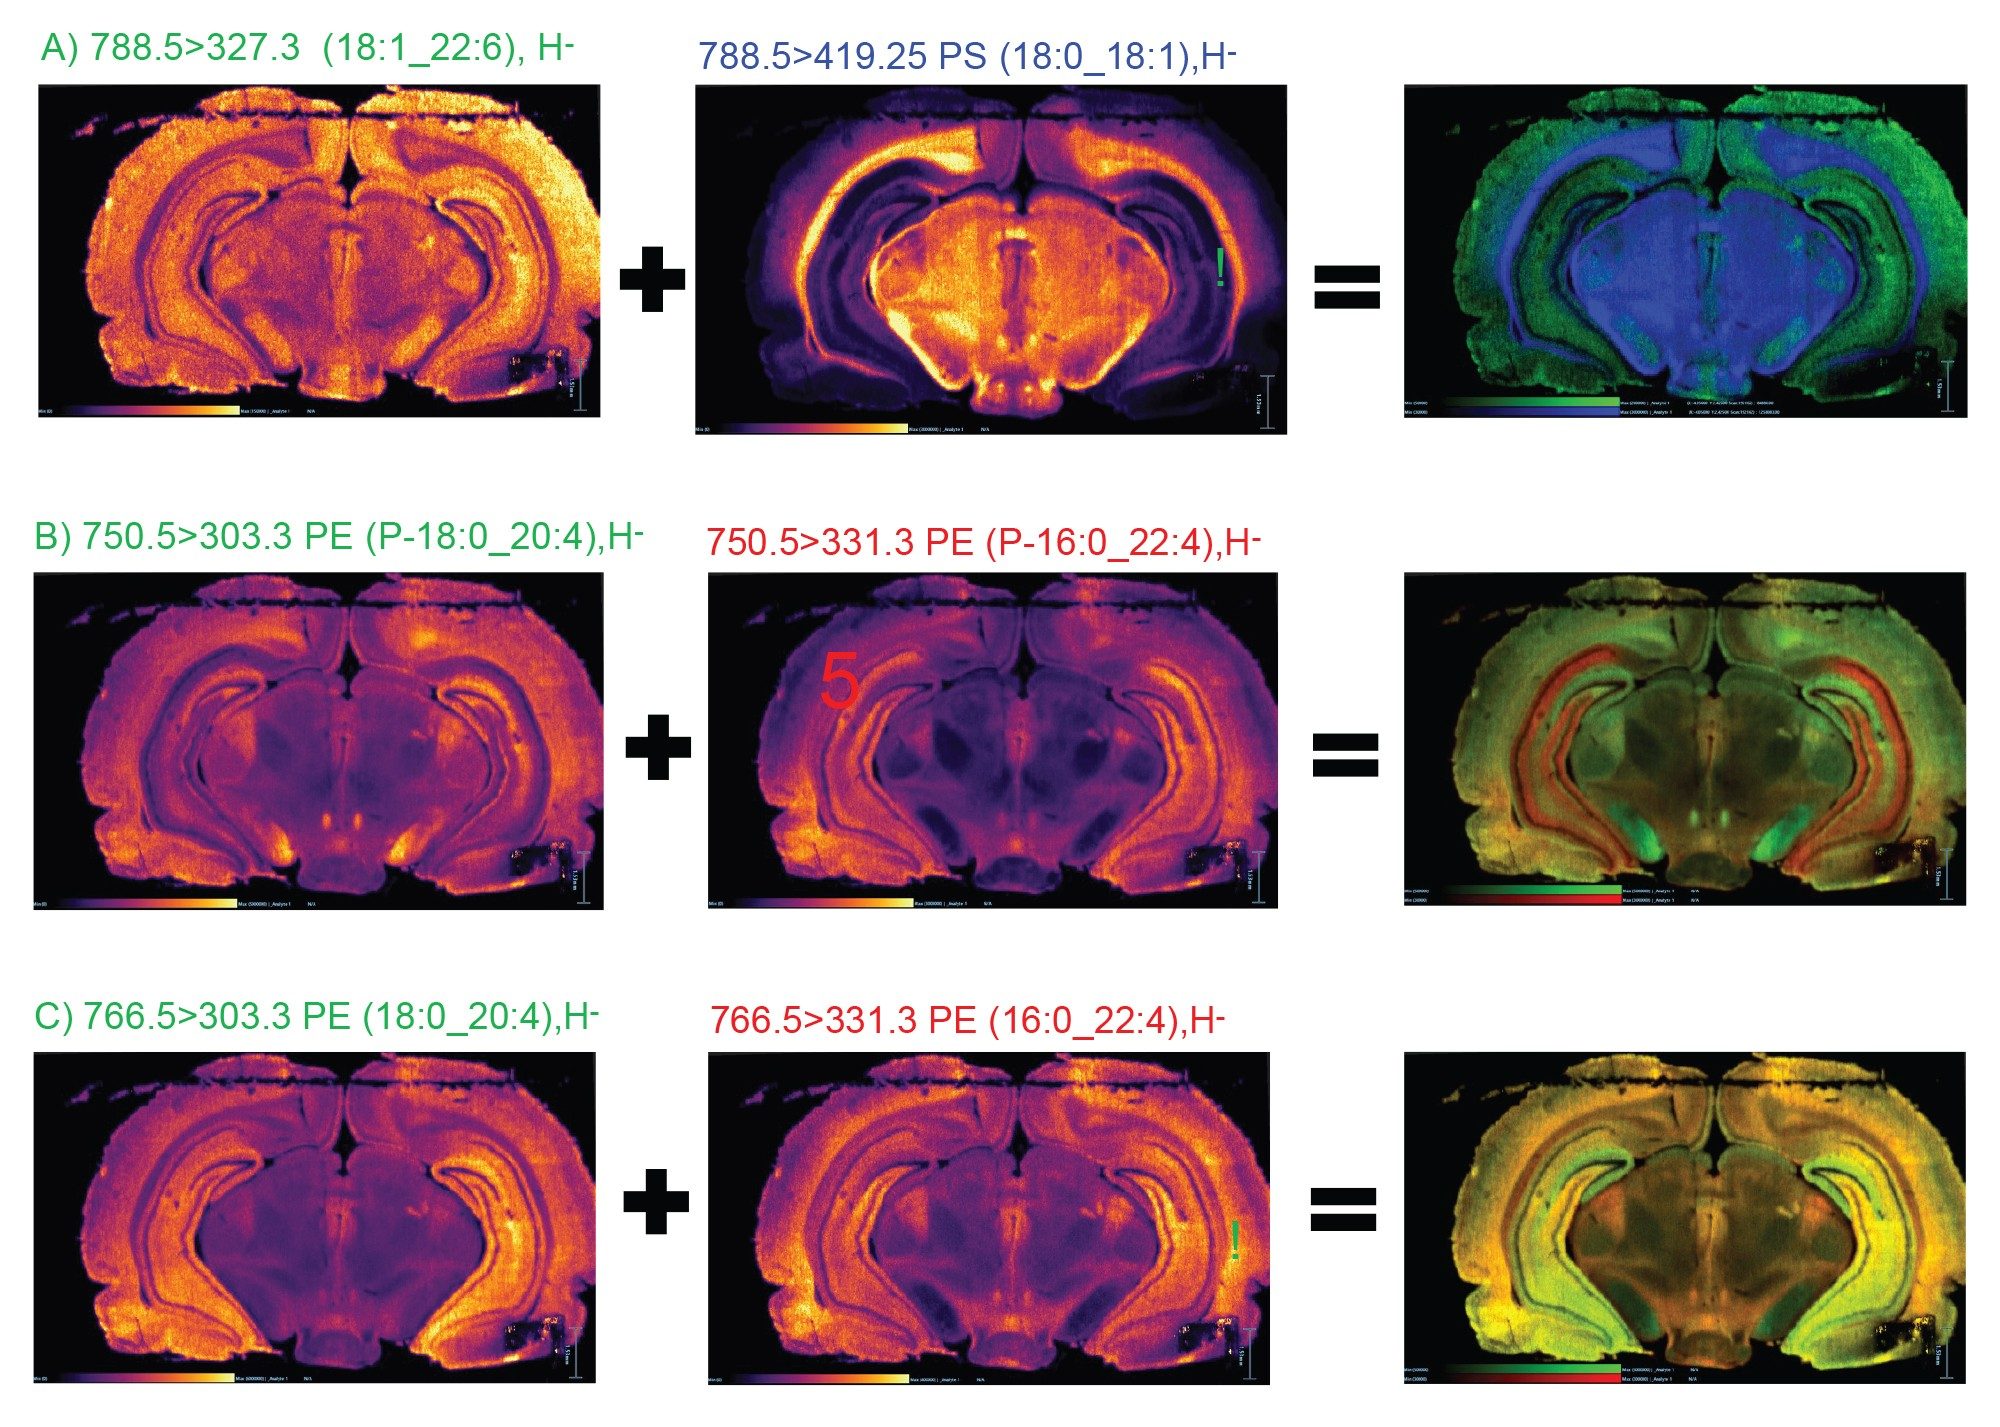
MRM transitions for each of the phospholipids were applied for a DESI Targeted MSI imaging experiment on a murine brain tissue section.
As seen in Figure 5A), two isobaric lipids at m/z 788.5 display almost inverse distribution in the brain.
The two pairs of isomeric lipids (Figure 5B and 5C) display different localizations that are highlighted in the RGB overlay.
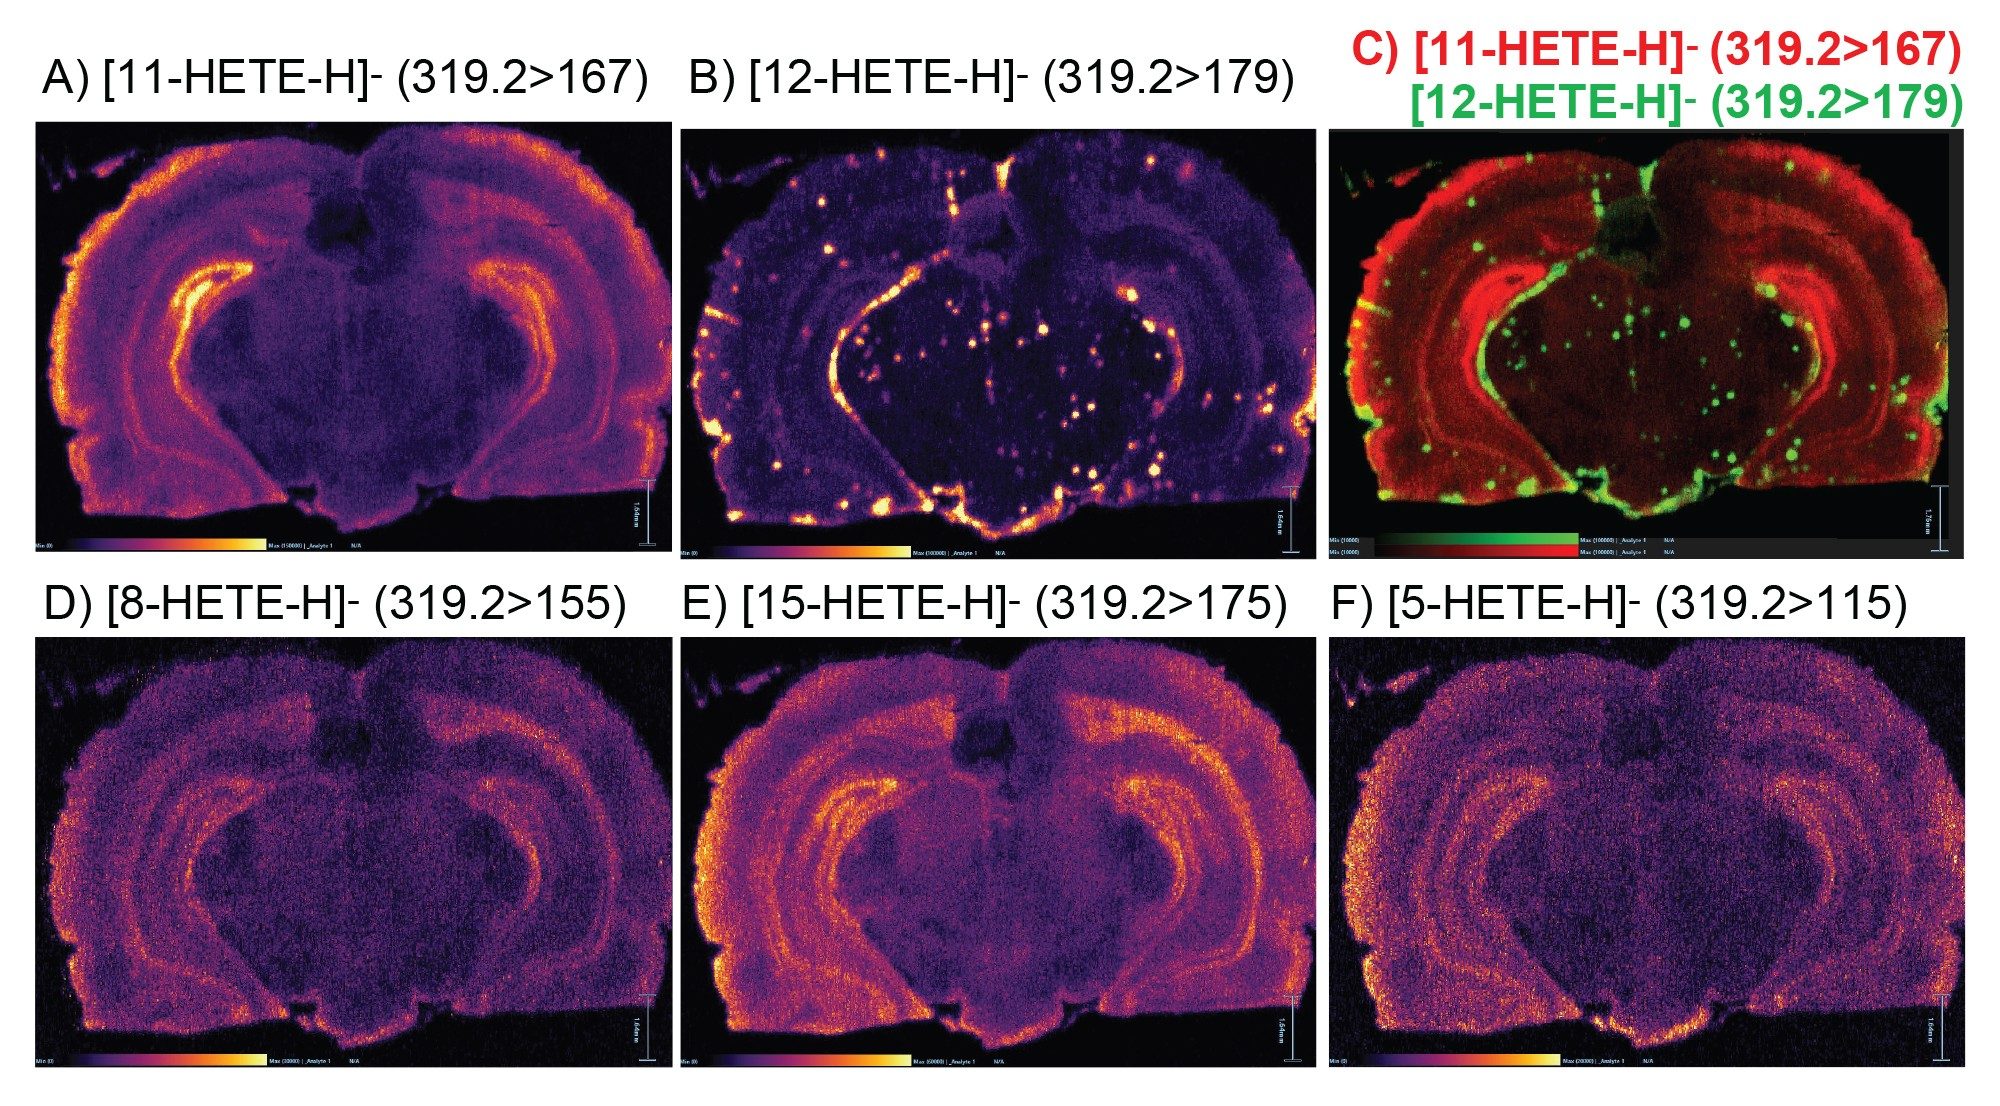
C) Eicosanoid Isomers Analyzed in Negative Mode
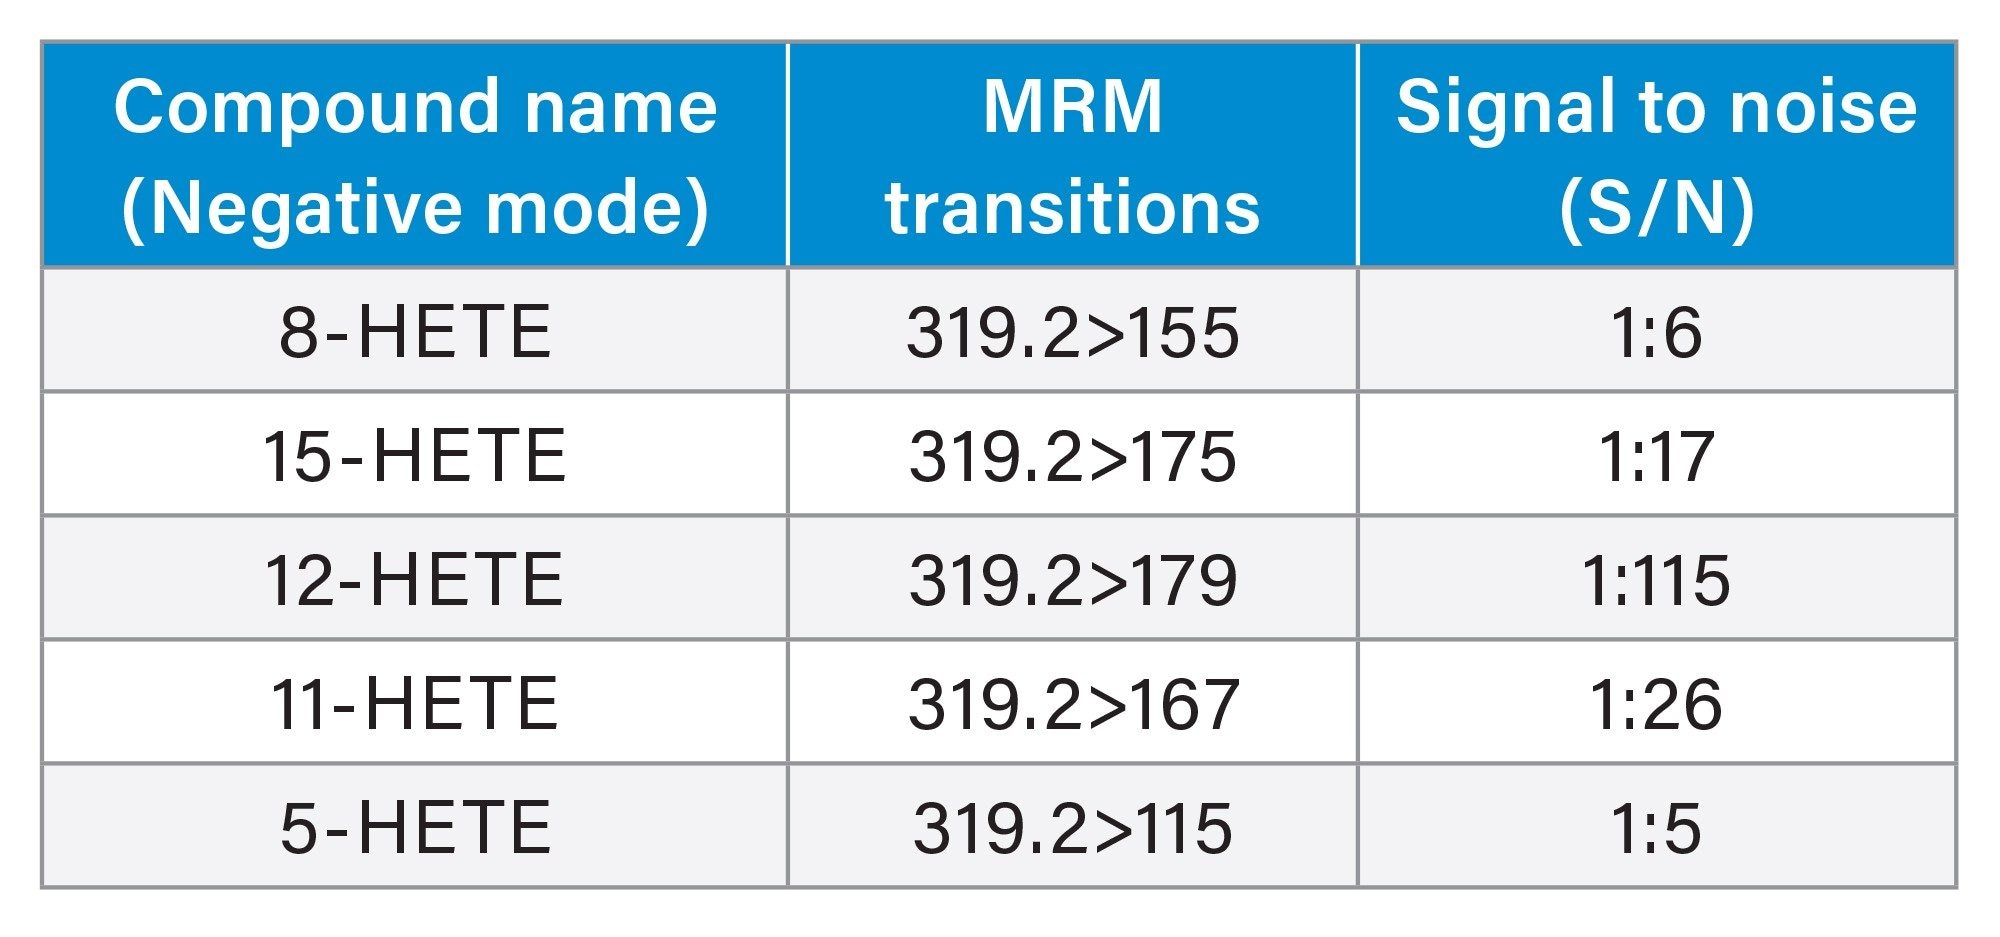
Endogenous compounds such as eicosanoids are typically found low in abundancein healthy tissue.2 Eicosanoids are localized signalling molecules made by the enzymatic or non-enzymatic oxidation of arachidonic acid or other polyunsaturated fatty acids (PUFAs). The formed eicosanoids function to regulate a physiological response, including tissue homeostasis, pain, host defence and inflammation (Esser-von Bieren, 2019). Hydroxyeicosatetraenoic acid isomer compounds (HETE) are generated from arachidonic acid (AA) by different pathways such as cyclooxygenase (COX), lipoxygenase (LOX), and cytochrome P-450 (CYP 450).3,4
In this study five isomer HETE compounds were monitored and imaged simultaneously using DESI XS targeted MSI in MRM mode with specific diagnostic product ions for each HETE: m/z 319.2>115 (5-HETE), m/z 319.2>155 (8-HETE), m/z 319.2>167 (11-HETE), 319.2>179 (12-HETE), and 319.2>175 (15-HETE). All five HETEs were easily detected with signal to noise (S/N) above 1:5 as seen in Table 1.
Conclusion
We have demonstrated that the targeted MS Imaging workflow combining DESI XS with MRM acquisition on the Xevo TQ Absolute Triple Quadrupole mass spectrometer is a powerful system to image isomeric and endogenous species directly from tissue sample without additional sample preparation step.
Truly isomeric phosphatidylethanolamine (PE) lipids were analysed using MRM transitions with product ions specific for each isomer and their distribution in rat brain showed different spatial localisation.
The selectivity and sensitivity of the DESI XS with MRM TQ targeted workflow enabled low abundant hydroxyeicosatetraenoic acid isomer compounds (HETE) to be easily detected and imaged.
Understanding phospholipid and eicosanoid location may help us to determine which substances can flow in and out of certain substructures within tissues and give us information about molecule movement and cell signalling.
References
- Dai Y, Tang H, Pang S. The Crucial Roles of Phospholipids in Aging and Lifespan Regulation. Front Physiol. 2021 Nov 23;12:775648. doi: 10.3389/fphys.2021.775648. PMID: 34887779; PMCID: PMC8650052.
- A.Wrong, DR Sagar, CA Ortori, DA Kendall, V Chapman, DA Barrett; Simultaneous Tissue Profiling of Eicosanoid and Endocannabinoid Lipid Families in a Rat Model of Osteoarthritis; Journal of Lipid Research, Jul 2014, 55(9):1902–1912. doi.org/10.1194/jlr.m048694.
- W.S.Powell, J.Rokach; Biosynthesis, Biological Effects and Receptors of Hydroxyeicosatetraenoic Acids (Hetes) and Oxoeicosatetraenoic Acids (Oxo-Etes) Derived From Arachidonic Acid. Biophys Acta. 2015 Apro; 1851(4): 340–355. doi: 10.1016/j.bbalip.2014.10.008.
- https://www.lipidmaps.org/resources/lipidweb/lipidweb_html/lipids/fa-eic/eic-hete/index.html
720008692, February 2025