Improving Throughput and Analytical Greenness in Pharmaceutical Discovery Using Ultrashort (2.1 x 10 mm) HPLC Columns
Kenneth Berthelette, Christopher Collins, Thomas H Walter
Waters Corporation, United States
Published on October 14, 2025
Abstract
High-throughput is critical for analytical methods used in drug discovery. This application note examines the use of 2.1 x 10 mm columns for high-throughput HPLC compared to longer 2.1 x 30 mm and 2.1 x 50 mm columns. The overall analysis time for 96 samples was determined for each column, and Analytical Method Greenness Scores (AMGS) were calculated. The 10 mm column greatly improved throughput while also improving the overall greenness of the analysis, although at the cost of lower column efficiency.
Benefits
- Up to 60% decrease in analysis time using the ultrashort (2.1 x 10 mm) column
- Lower AMGS metric values indicating improvements in analytical method greenness
Introduction
Drug discovery is a fast-paced, high-throughput environment where chemists screen large numbers of samples to determine if a suitable compound has been created. Supporting these efforts from an analytical standpoint using liquid chromatography (LC) or liquid chromatography-mass spectrometry (LC-MS) can present challenges. For many discovery workflows, hundreds if not thousands of samples are analyzed for the determination of drug concentrations in biological matrices, for structural confirmation or for an assessment of purity. Analytically speaking, this means that the number of samples that may be analyzed per unit time, or throughput, is valued more highly than is achieving baseline separation of all components. To maximize throughput, rapid (“ballistic”) gradients can be employed along with short analytical columns.1 Ballistic gradients are designed to run at the highest flow rate possible while using the steepest gradient slope, in terms of percent solvent per column volume (%/VC).2 This allows for the fastest elution off the column possible. Shorter columns are used not only to limit the pressure generated by the column, thereby allowing faster flow rates, but also to reduce the analysis time.
In this application note, the use of a 2.1 x 10 mm 2.5 µm XSelect™ HSS T3 Column is examined compared to 2.1 x 30 mm and 2.1 x 50 mm columns packed with the same stationary phase. These three columns were used to analyze a full 96-well QuanRecovery™ Plate to simulate the output of a drug discovery environment where multiple samples need to be run as fast as possible. Prior to sample analysis, instrument methods were created to increase throughput by limiting the inter-injection delay. The inter-injection delay time was calculated and recorded. The total analysis time for each column configuration was determined and compared, along with the AMGS. While the loss of efficiency in using a 10 mm column was expected, the shorter column configuration achieved adequate results for a single component sample. Coupling this column with mass spectrometry for peak identification would be sufficient for high-throughput discovery screening where separation quality is not the most important attribute of the analysis, but rather speed is of the highest value.3
Experimental
Sample Description
Assay sample: Acetaminophen was prepared in water at a concentration of 250 µg/mL and placed into a QuanRecovery Plate for injection.
Method Conditions
Reversed Phase LC Conditions
|
LC system: |
ACQUITY™ Premier Binary Solvent Manager with Column Manager, TUV Detector, and Xevo™ TQ Absolute Mass Spectrometer |
|
Detection: |
UV 254 nm |
|
Vials and plates: |
QuanRecovery with MaxPeak™ HPS 700 µL Plate (p/n:186009184) |
|
Columns: |
XSelect HSS T3, 2.1 x 50 mm, 2.5 µm (p/n: 186006149) XSelect HSS T3, 2.1 x 30 mm, 2.5 µm (p/n: 186006148) XSelect HSS T3, 2.1 x 10 mm, 2.5 µm (p/n: 186011466) |
|
Column temperature: |
30 °C |
|
Sample temperature: |
10 °C |
|
Injection volume: |
1.0 µL (10 mm), 3.0 µL (30 mm), 5.0 µL (50 mm) |
|
Flow rate: |
0.34 mL/min |
|
Mobile phase A: |
0.1% Formic Acid in Water |
|
Mobile phase B: |
0.1% Formic Acid in Acetonitrile |
|
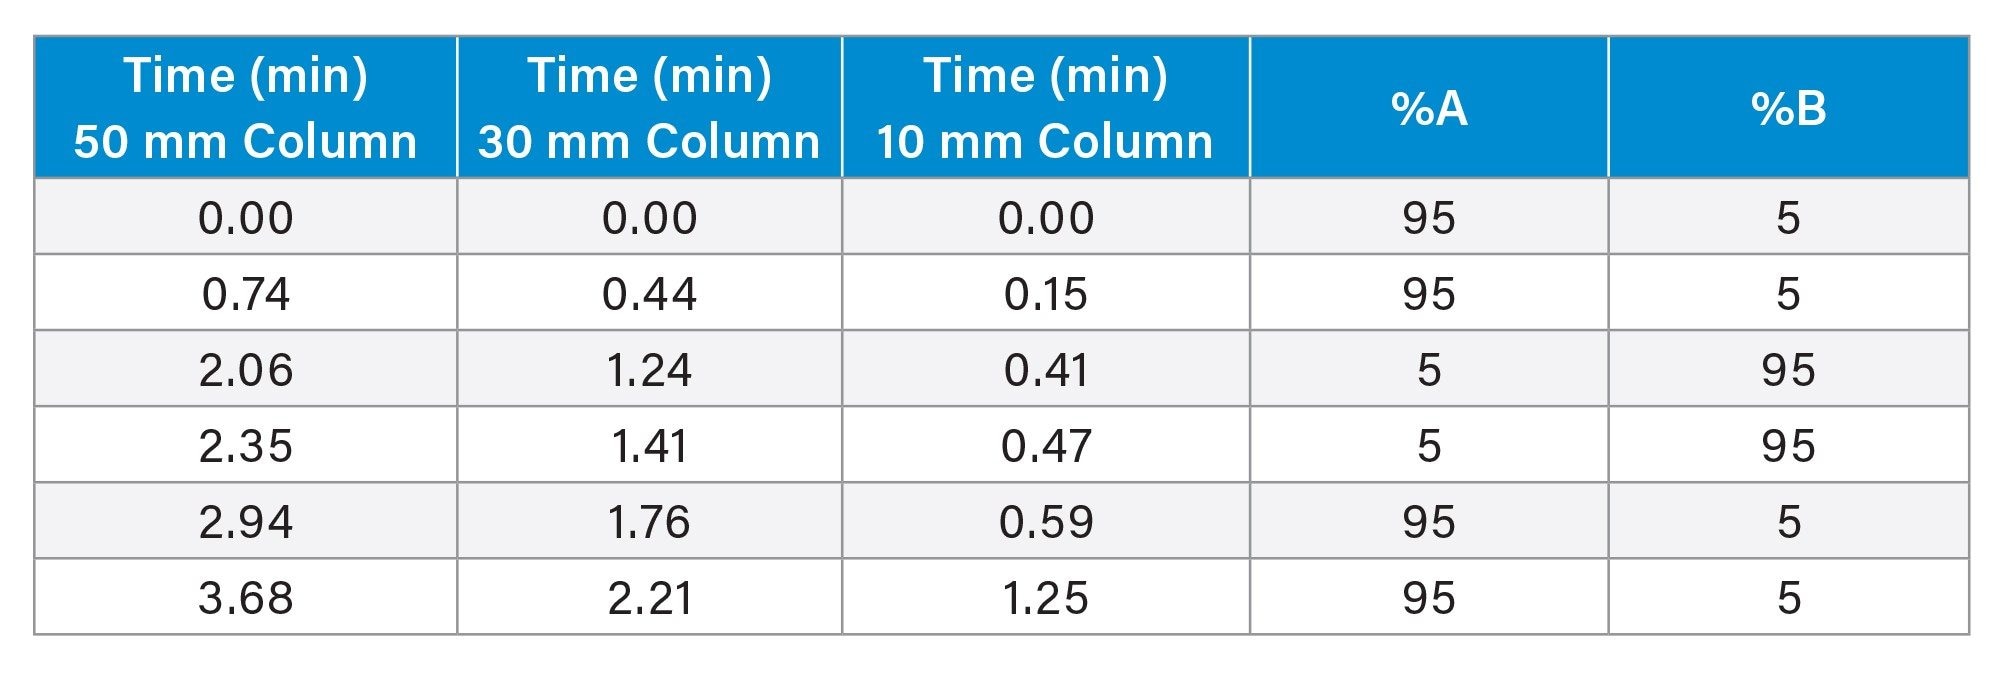
Gradient conditions: |
See Table 1 |
Data Management
|
Chromatography software: |
MassLynx™ V4.1 Software |
Results and Discussion
Instrument Considerations
Prior to sample analysis, the system being used was considered. For Waters™ LC systems, there are a few parameters in the inlet method that can be adjusted to speed up the time between injections, or inter-injection delay. This delay comes from the sequence of steps that the system takes to draw the sample and inject it into the flow path of the LC. The parameters that need adjustment are all located in the sample manager panel of the instrument method or inlet method. Figure 1 shows screenshots of the sample manager panel and where the mentioned parameters are located.
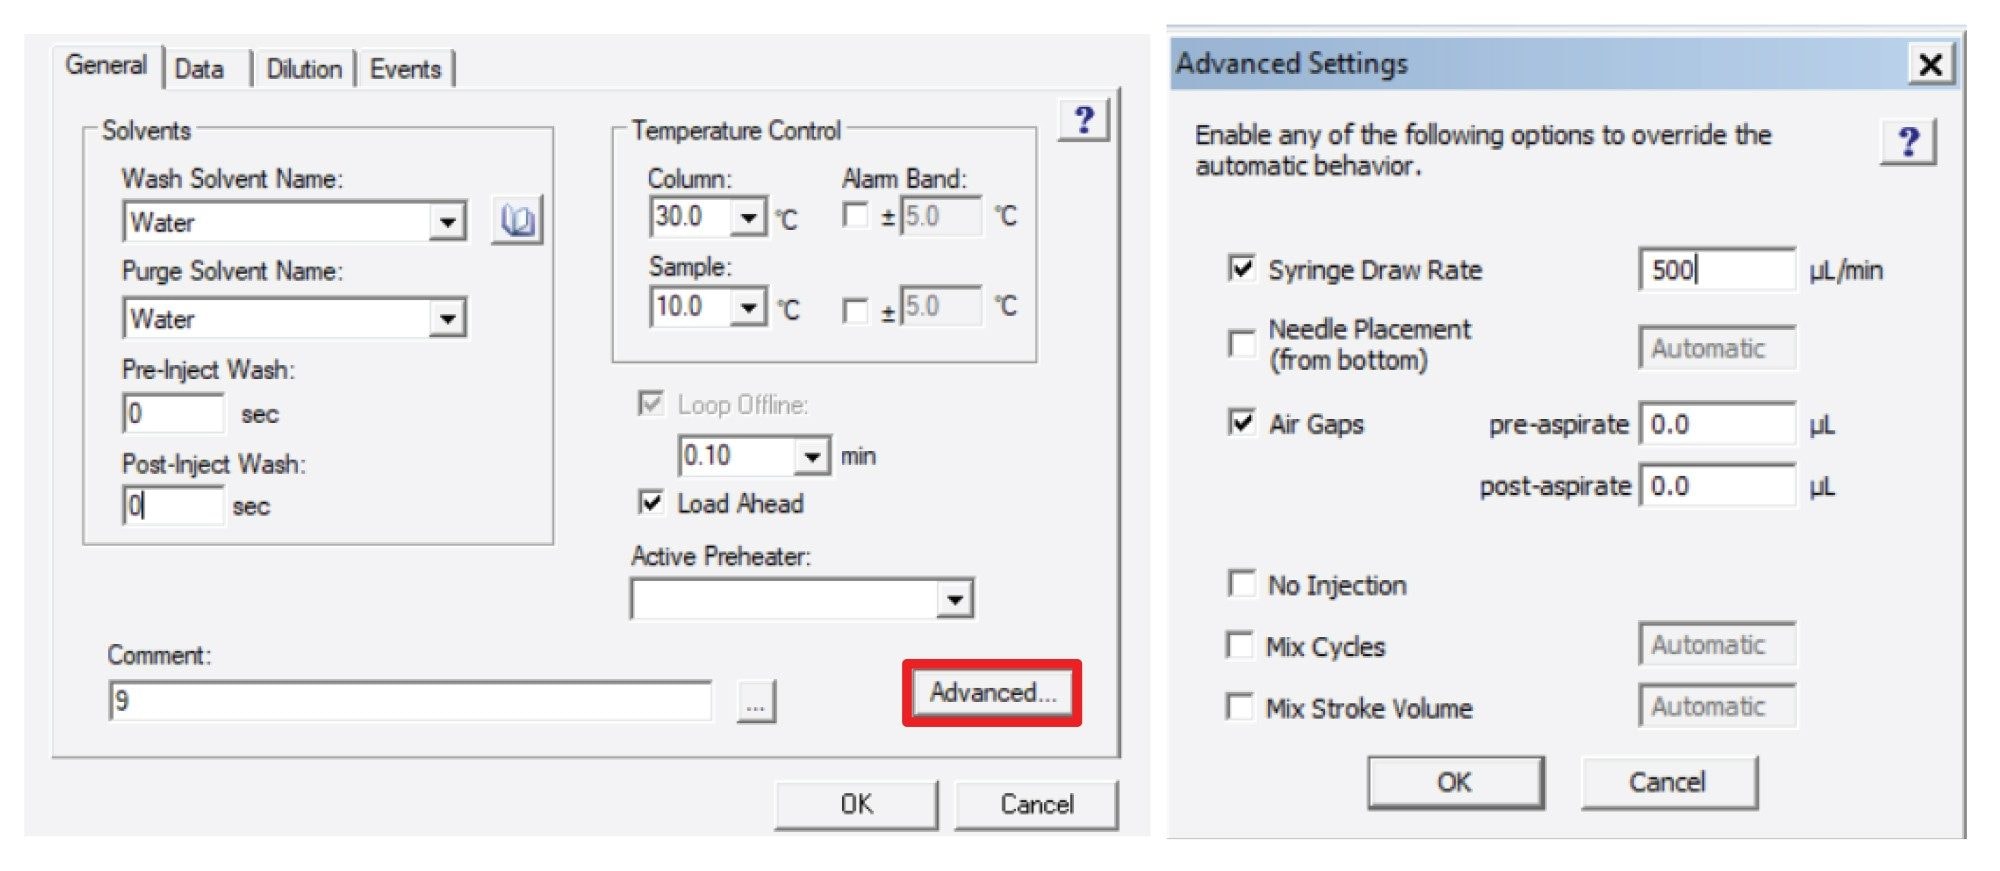
The parameters in question are the pre- and post-injection wash times, the air gap volumes, the syringe draw rate, and the use of load ahead. In the case of pre- and post-injection wash times, by eliminating the pre-injection wash step, the needle will not be washed before the injection, saving valuable time. Depending on the sample manager design, the post-injection wash may not add time to the injection cycle as the post-injection wash would happen during the analytical run. To prevent potential additional delay time, both were reduced to zero. This can shorten the analysis time but may cause carryover between samples. As such, eliminating these washes should be used only when carryover is not a concern. The air gap volumes being reduced to 0.0 µL means that the system will not need to draw up air gaps to properly measure the injection volume. The removal of air gaps may cause increased variability of replicate injection peak areas, or linearity of calibration curves due to slight variations in the injected volume. This should only be adjusted when single injections are performed, or when injector reproducibility and linearity are not paramount.
The syringe draw rate of 500 µL/min is the maximum allowable for the instrument that was used. This speeds up the rate at which the sample is drawn from the vial, reducing the time needed for the injection. However, for very viscous samples, this may not be suitable as faster draw rates may cause increased variability in injected volume or incomplete draws, affecting quantitation. However, for samples diluted in typical LC solvents like acetonitrile, methanol, or water, the increased draw rate will lower the inter-injection delay without negatively impacting the resulting data. Lastly, load ahead is a function which does what the name implies. While an analysis is running the sample manager loads the next sample by taking the needle out of the flow path and preparing the sample for the next injection.
By employing each of these parameters the inter-injection delay of the system is reduced, increasing throughput. However, no matter how fast the system can inject the sample, there will always be some inter-injection delay unless a more specialized instrument is used. For the ACQUITY Premier BSM System using a Sample Manager with Flow-Through Needle (SM-FTN), with all the parameters set up as indicated, the average inter-injection delay was measured to be 29.4 seconds based on four replicate injections. This means that for analyses with a run time less than 30 seconds, the rate limiting step for increased throughput would be injection delay and not the actual analysis. It should be noted that depending on the instrument type and control software the inter-injection delay time may vary from system to system.
Sample Analysis Using Varying Column Lengths
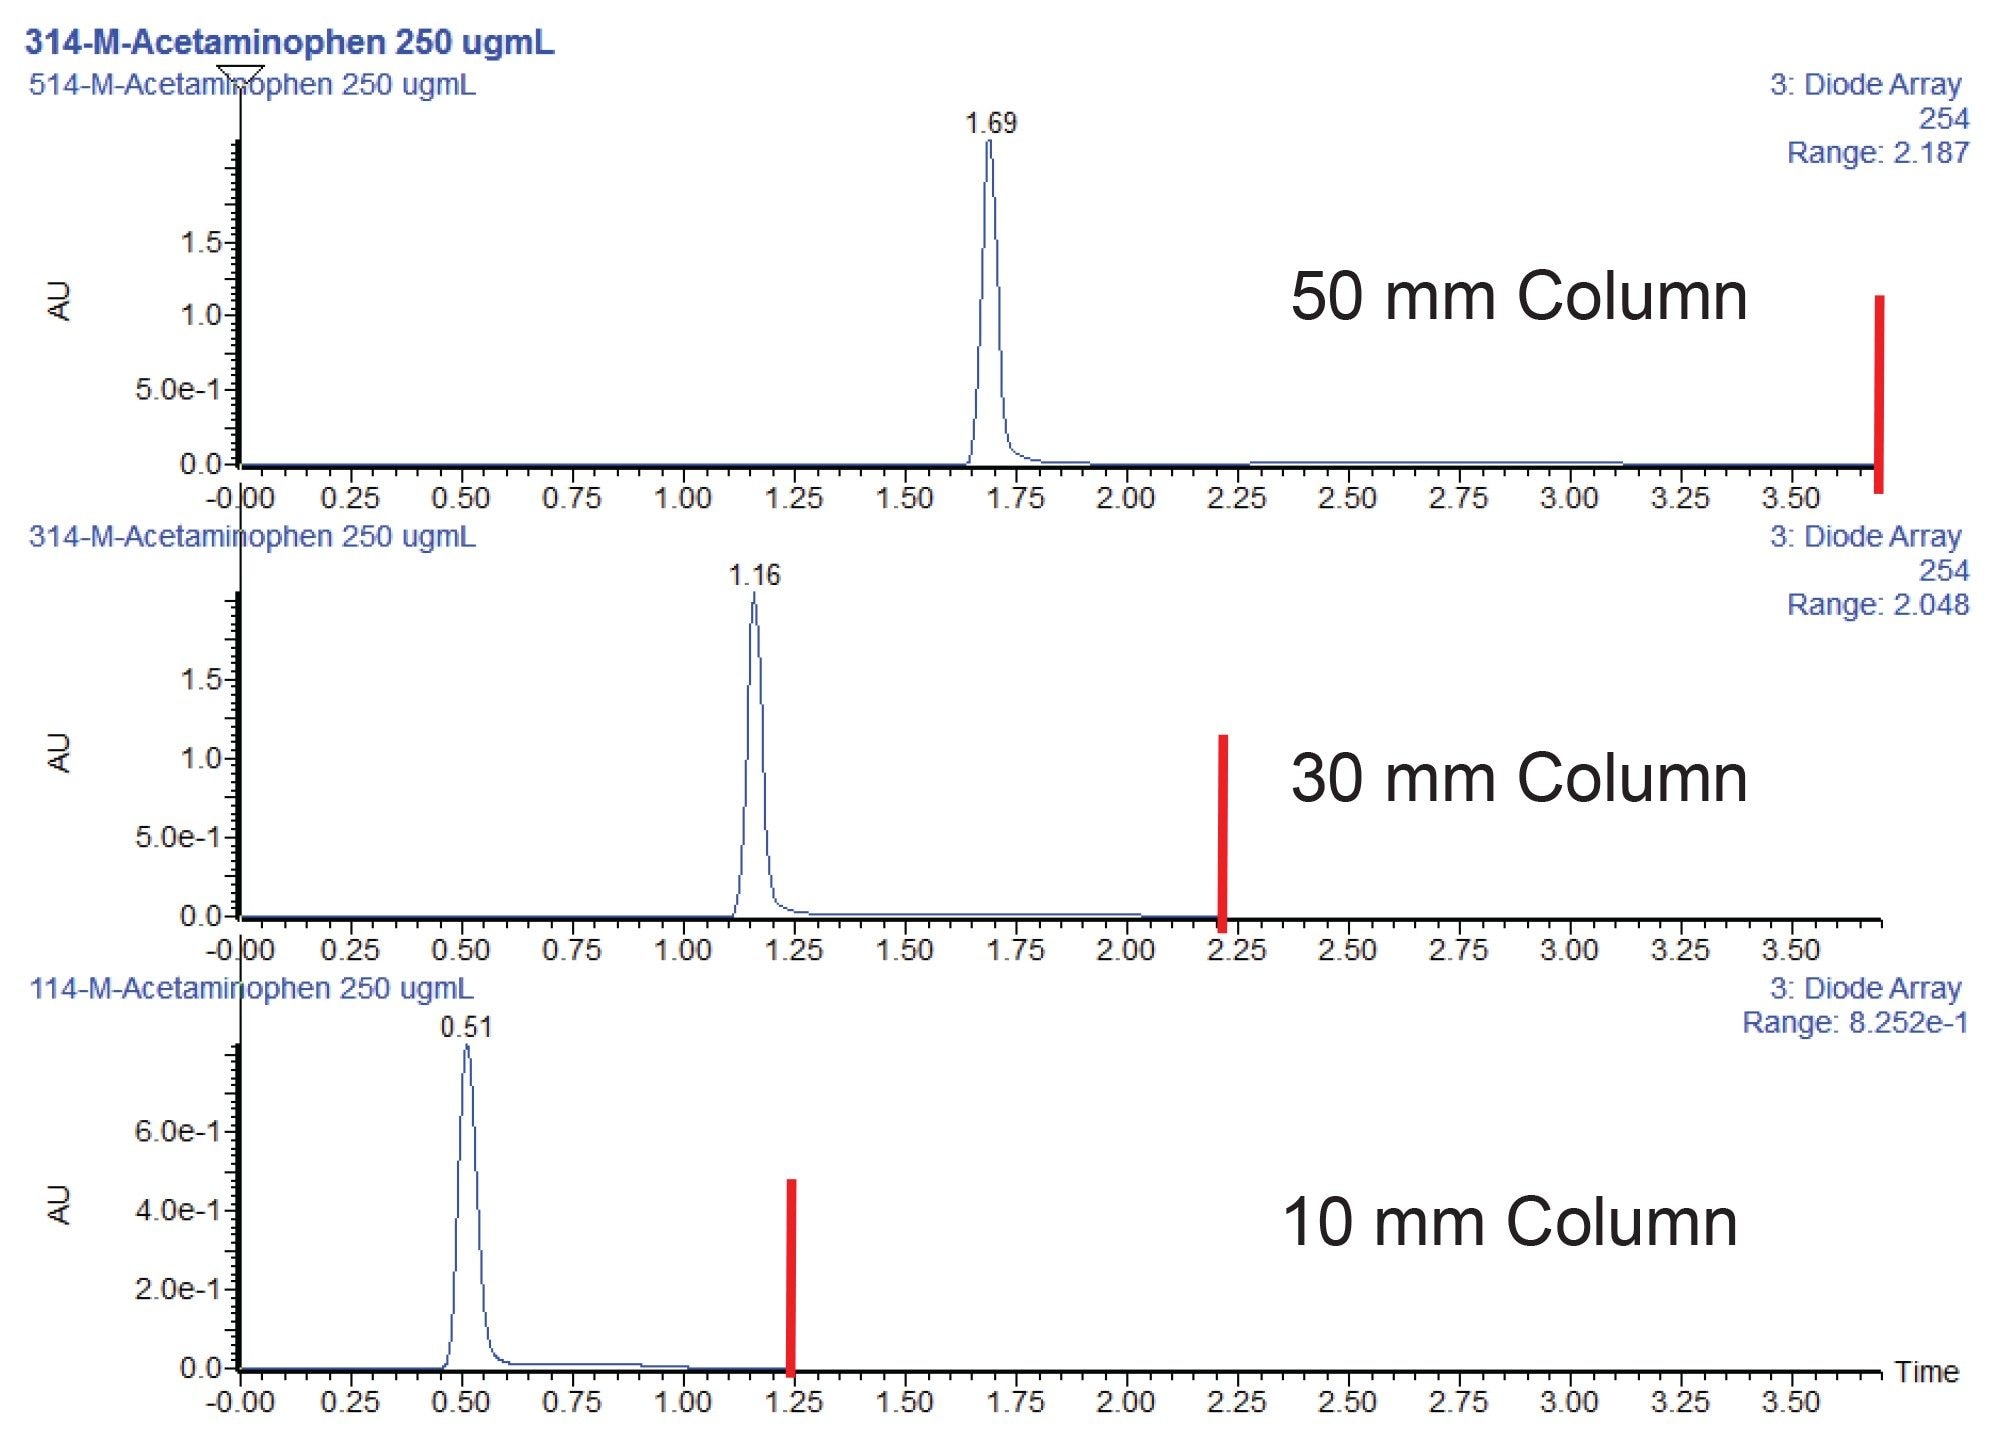
To illustrate the benefits of using shorter columns to increase throughput, a 96 well plate was loaded with a standard containing 250 µg/mL acetaminophen in water. All three columns were packed with the same stationary phase, XSelect HSS T3 2.5 µm sorbent. The columns had an internal diameter of 2.1 mm and lengths of 50, 30, or 10 mm. The columns were installed onto the system and tested using the sample described previously. The sample was loaded into a QuanRecovery Plate, and a total of 96 injections were performed on each column to simulate the entire plate being run. Examples of the chromatography obtained for the acetaminophen sample on the three columns are shown in Figure 2. As expected for a single peak assay, the use of 10 mm columns is sufficient. The lower efficiency of the shorter column does not have any significant impact on the assay test as only one analyte is in the sample. It should be noted that the difference in peak height seen between the chromatograms is due to the scaled injection volumes between the three columns. Due to the shorter bed of the 10 mm column, potential downsides to chromatographic performance are possible, including decreased loading capacity and susceptibility to strong solvent effects.
Throughput and AMGS Comparisons
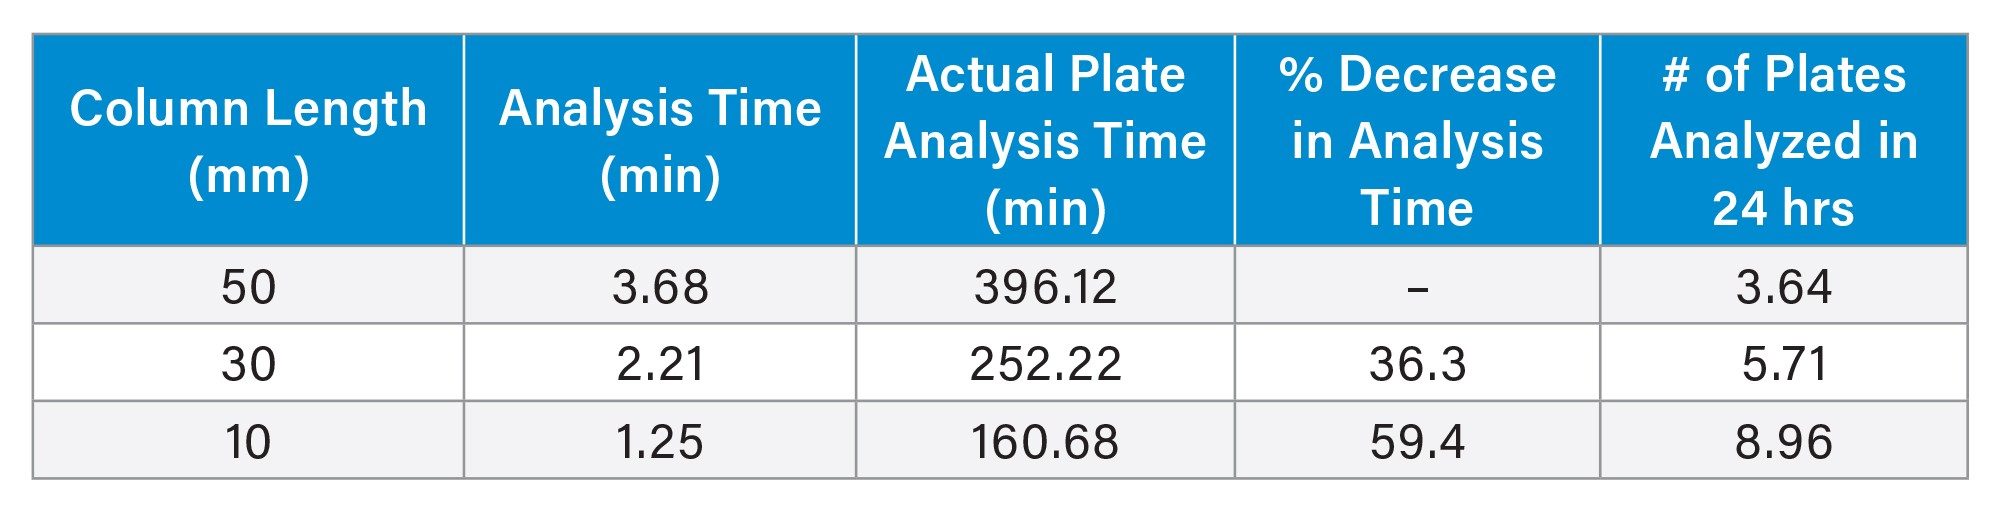
As mentioned, 96 injections were performed for all columns. By examining the time stamps for injections 1 and 96, and accounting for the analysis times, the total analysis time for 96 samples can be determined for each column. Table 2 shows the total analysis time on each column tested. The 50 mm column required a total of 396.12 minutes, or 6.6 hours to fully analyze a 96 well plate, even with a ballistic gradient. The 30 mm column only required 252.22 minutes, or 4.2 hours, which is a 36.3% reduction in total run time. Lastly, the 10 mm column completed the plate analysis in just 160.68 minutes, or 2.68 hours, a 59.4% reduction in total analysis time compared to the 50 mm column. The reduced analysis time associated with the 10 mm column enables the processing of multiple 96-well plates within a single workday, accelerating data acquisition and increasing throughput.
The use of the shorter columns not only provides a throughput benefit, but also an improvement in analytical greenness, as measured by the AMGS. AMGS is a metric developed by several different pharmaceutical companies to compare the greenness of different HPLC and SFC methods.4 The calculation of an AMGS is done using an online tool that is readily accessible for anyone to use.5 Table 3 shows the calculated AMGS values for the three columns and associated methods. In these calculations, the sample preparation volume was kept constant at 0.6 mL for all three columns, along with the number of samples at 96. The sample diluent was set as water for all columns. Lastly, the number of analytes per sample was set to 1, which is the worst case scenario from an AMGS standpoint.
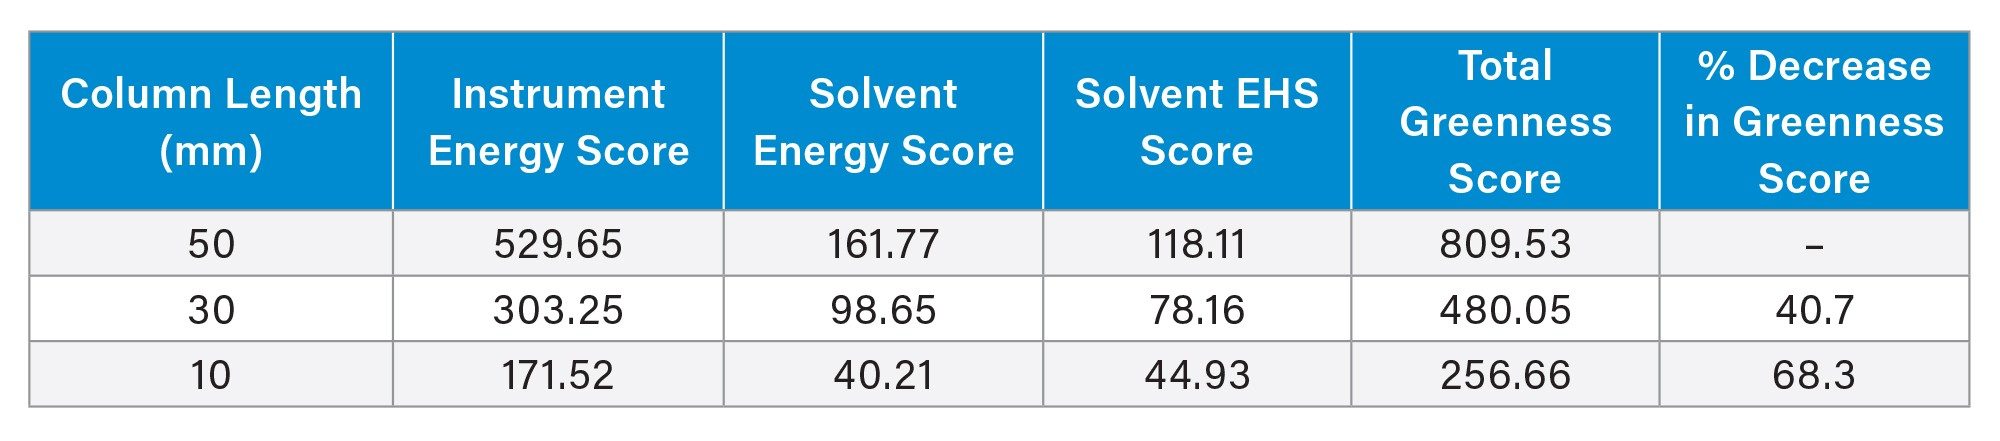
For AMGS values, a lower total greenness score indicates a more sustainable method.6–7 Not surprisingly, the method using the 10 mm column has the lowest AMGS at 256.66, followed by the 30 mm and 50 mm column methods. The decreased run time for the 10 mm column not only decreases the solvent usage, but also reduces the energy needed to power the instrument. These factors combine to generate a lower AMGS.
Conclusion
The use of high-throughput LC separations in pharmaceutical discovery allows new lead compounds to be selected quickly and efficiently. This may be achieved using short columns with ballistic gradients. To support these activities 2.1 x 10 mm columns were developed and used to analyze a full 96-well plate of samples. Comparing the results obtained on the 10 mm column to those produced using 30 and 50 mm columns showed a 57–146% higher throughput. Additionally, the use of the 10 mm column was determined to be substantially “greener” as measured by the analytical method greenness scores, with decreases of 40 and 68% relative to 30 and 50 mm length columns.
References
- Romanyshyn LA, Tiller PR. Ultra-short columns and ballistic gradients: considerations for ultra-fast chromatographic liquid chromatographic-tandem mass spectrometric analysis. J. Chrom A. (2001) 928, 41–51.
- De Nardi C, Bonelli F. Moving from fast to ballistic gradient in liquid chromatography/tandem mass spectrometry pharmaceutical bioanalysis: matrix effect and chromatographic evaluations. Rapid Commun. Mass Spectrom in MS. (2006), 20, 2709–2716.
- Liu C. High-throughput mass spectrometry in drug discovery. SLAS Technology (2025), 32, 100292.
- Hicks MB, et al. Making the move towards modernized greener separations: introduction of the analytical method greenness score (AMGS) calculator. Green Chem. (2019) 21, 1816.
- AMGS calculator.
- Berthelette K, Walter TH, DeLoffi M, Kalwood J, Haynes K. Creating Greener HPLC Methods as Measured by the AMGS Metric: A Case Study of Improving USP Monograph Methods. Waters application note. 720008281.
- Berthelette K, Walter TH, Colins C, DeLoffi M, Haynes K. Applying Analytical Method Greenness Scoring to the USP Monograph of Naproxen; Improving the Sustainability of Validated Methods by Modernizing to Newer Technology. Waters application note. 720008366.
720009074, October 2025