Detect, Identify, and Characterize Cellular versus Non-cellular Aggregates with the Aura CL System
Published on June 02, 2021
Introduction
Cell, protein, and viral aggregates are critical quality attributes (CQAs) for all biological products.1 Subvisible biotherapeutic product aggregates indicate low product stability and low shelf life. In addition, these attributes are a crucial indicator of potential immunogenicity for a given biological drug. The FDA suggests that “strategies to minimize aggregate formation should be developed as early as feasible in product development.”1
Quantifying subvisible particle content in cellular therapies is incredibly challenging since cells themselves are subvisible in nature.2 The inherent complexity in the manufacture and supply of CAR-T cell therapies, from collection, viral transduction, expansion, and storage, results in greater potential for the formation of large cell and non-cell aggregates affecting clinical safety and efficacy outcomes.3 The complex nature of cell therapy formulations which can include high protein concentrations of human serum albumin for stability purposes, remnant viral vectors from transfection, and cell debris can facilitate the formation of cell aggregates, negatively impacting the therapeutics’ efficacy. Current analytical techniques make the characterization and differentiation of cell aggregates from other subvisible particles virtually impossible. Flow imaging and cytometry techniques struggle to differentiate cell aggregates from other subvisible particles due to the inherent low refractive index contrast of particles in liquid matrices, influencing sizing accuracy, undercounting and under sizing cell populations in excess of 50%.4
The Aura CL™ System is the first system specifically designed to detect, count, characterize, and ID cellular aggregates and subvisible particles for product quality measurements in cell therapy, cell line development, and gene therapy applications. Aura CL System is powered by fluorescence membrane microscopy (FMM) to identify fluorescently labeled cells and particles to produce the most accurate and complete characterization of cell and gene therapy products. Aura CL System is a fluidics-free platform, preventing clogging issues seen in other methodologies. It enables high-throughput, high refractive index contrast, and 100% measurement efficiency for suspended cells, protein, and viral aggregates found in cell and gene therapies.
This application note introduces the advanced capabilities of the Aura CL System to accurately count, characterize, and differentiate immunotherapeutic cells from other aggregates and subvisible particles. Here, the system’s compatibility with well-established cell and protein aggregate staining protocols for particle ID is demonstrated.
Experimental
Method
Two DNA specific dyes, 4′,6-diamidino-2-phenylindole (DAPI) and Hoechst 33342, were specifically chosen and used interchangeably in this application note to distinguish cells from proteins and other particles. Hoechst 33342 is membrane permeable and can stain both live and dead cells while DAPI is cell impermeant at low concentration but can stain live cells at concentrations >1.0 µg/mL.
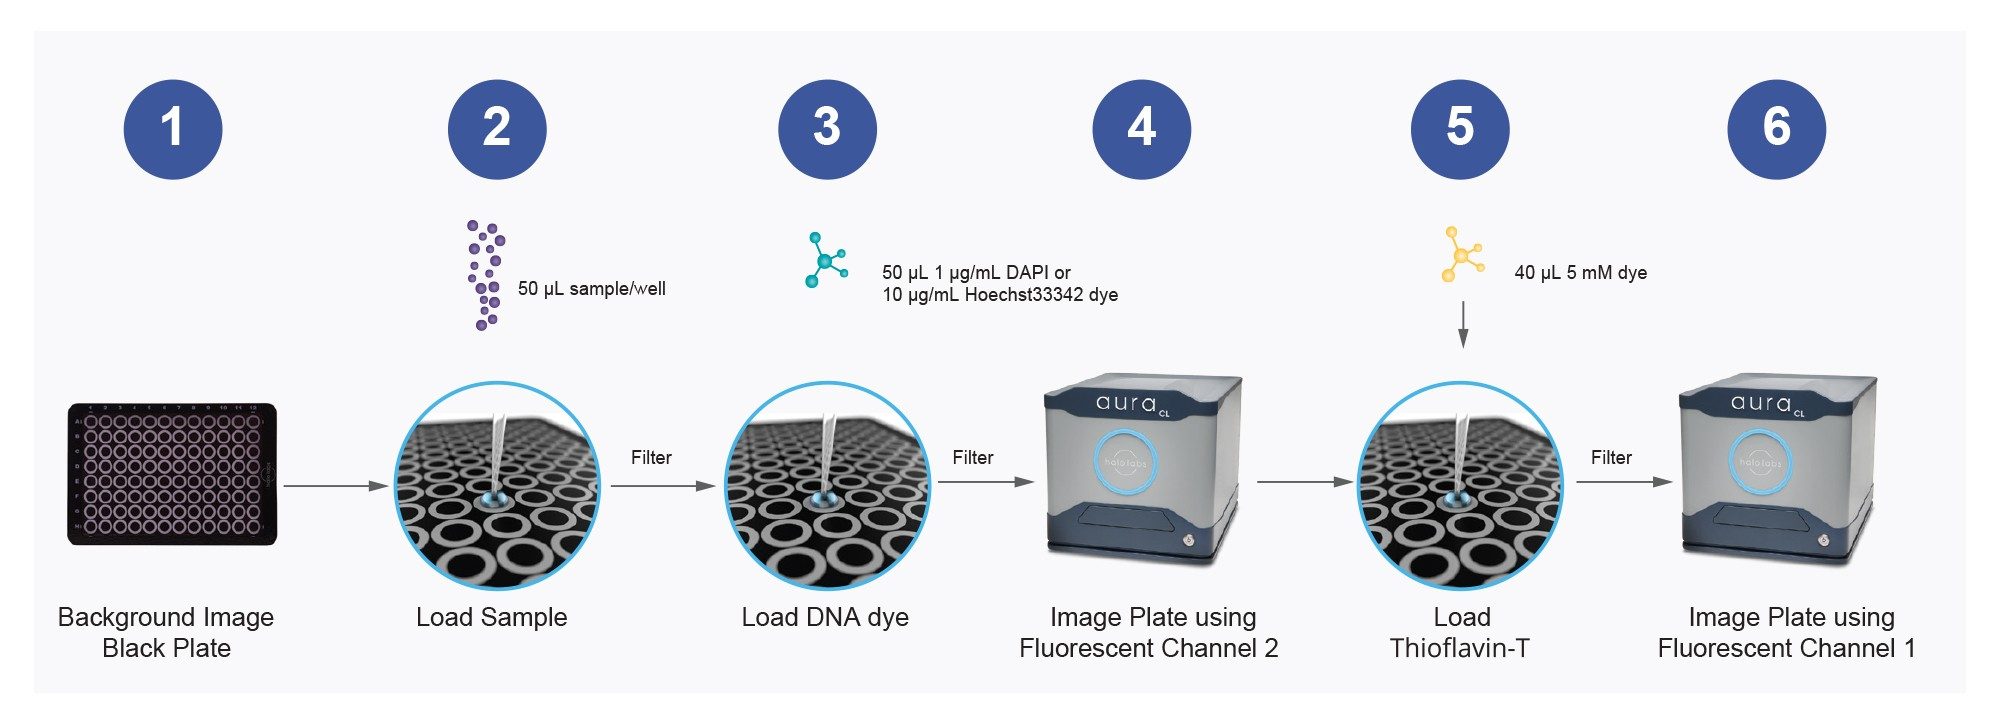
In Figure 1, CAR-T cells were labeled using an “onmembrane” staining protocol. The CAR-T cells were reconstituted at 1 x 10⁵ cells/mL in PBS before 50 µL was loaded onto a previously background imaged black membrane plate. Samples were vacuumed through and imaged in the Aura CL System using brightfield to view all the particles in the sample and side illumination membrane imaging (SIMI) to view non-biologic particles.
50 µL of either 1 µg/mL DAPI or 10 µg/mL Hoechst 33342 was added to the plate and incubated for 10 minutes in the dark to label the cells before the plate was re-imaged using FMM. Nuclear DNA was imaged in the FL2 channel. Samples could also be counterstained on the membrane with thioflavin T (ThT), which specifically labels protein aggregates, and detected using FMM in the FL1 channel.
Results and Discussion
Singlet and Multimer Analysis
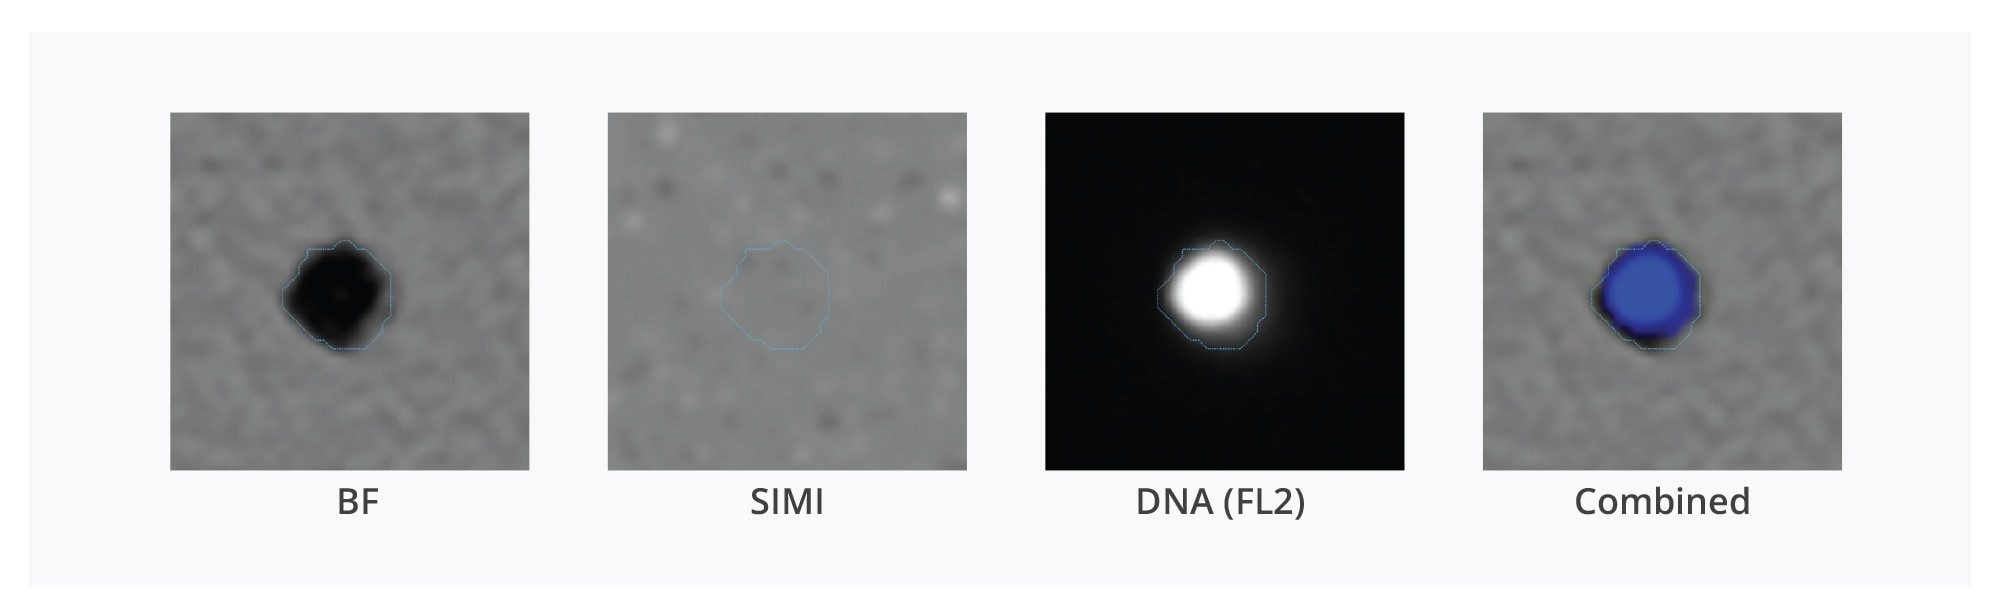
In Figure 2, an individual CAR-T cell imaged in brightfield (BMI), SIMI, and fluorescence (FL2 channel) is shown. With BMI, CAR-T cells demonstrate the distinctive morphology of a lymphocyte, with a concentric condensed nucleus and scanty cytoplasm, with little or no SIMI intensity. In combination with the DNA stain, the CAR-T nucleus is positively identified in the fluorescent channel (FL2).
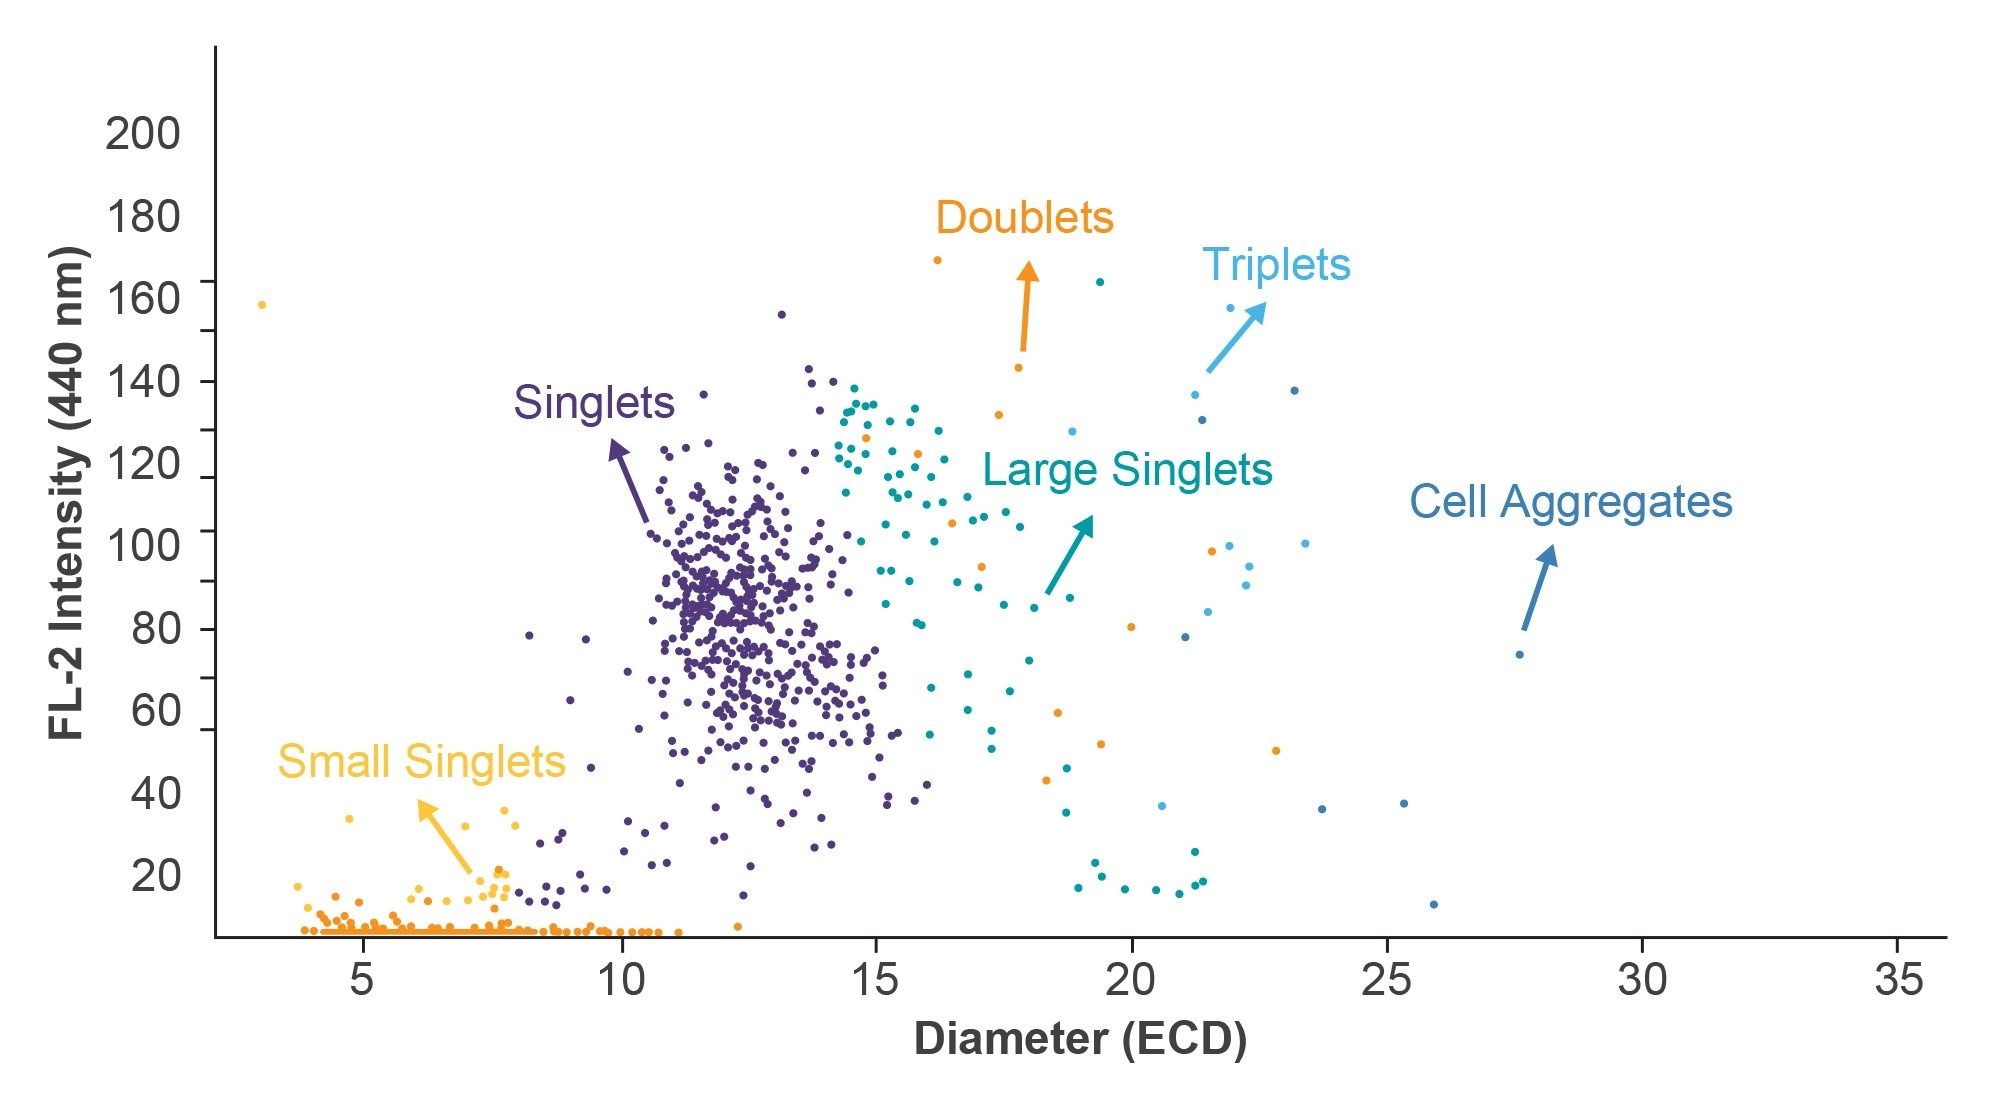
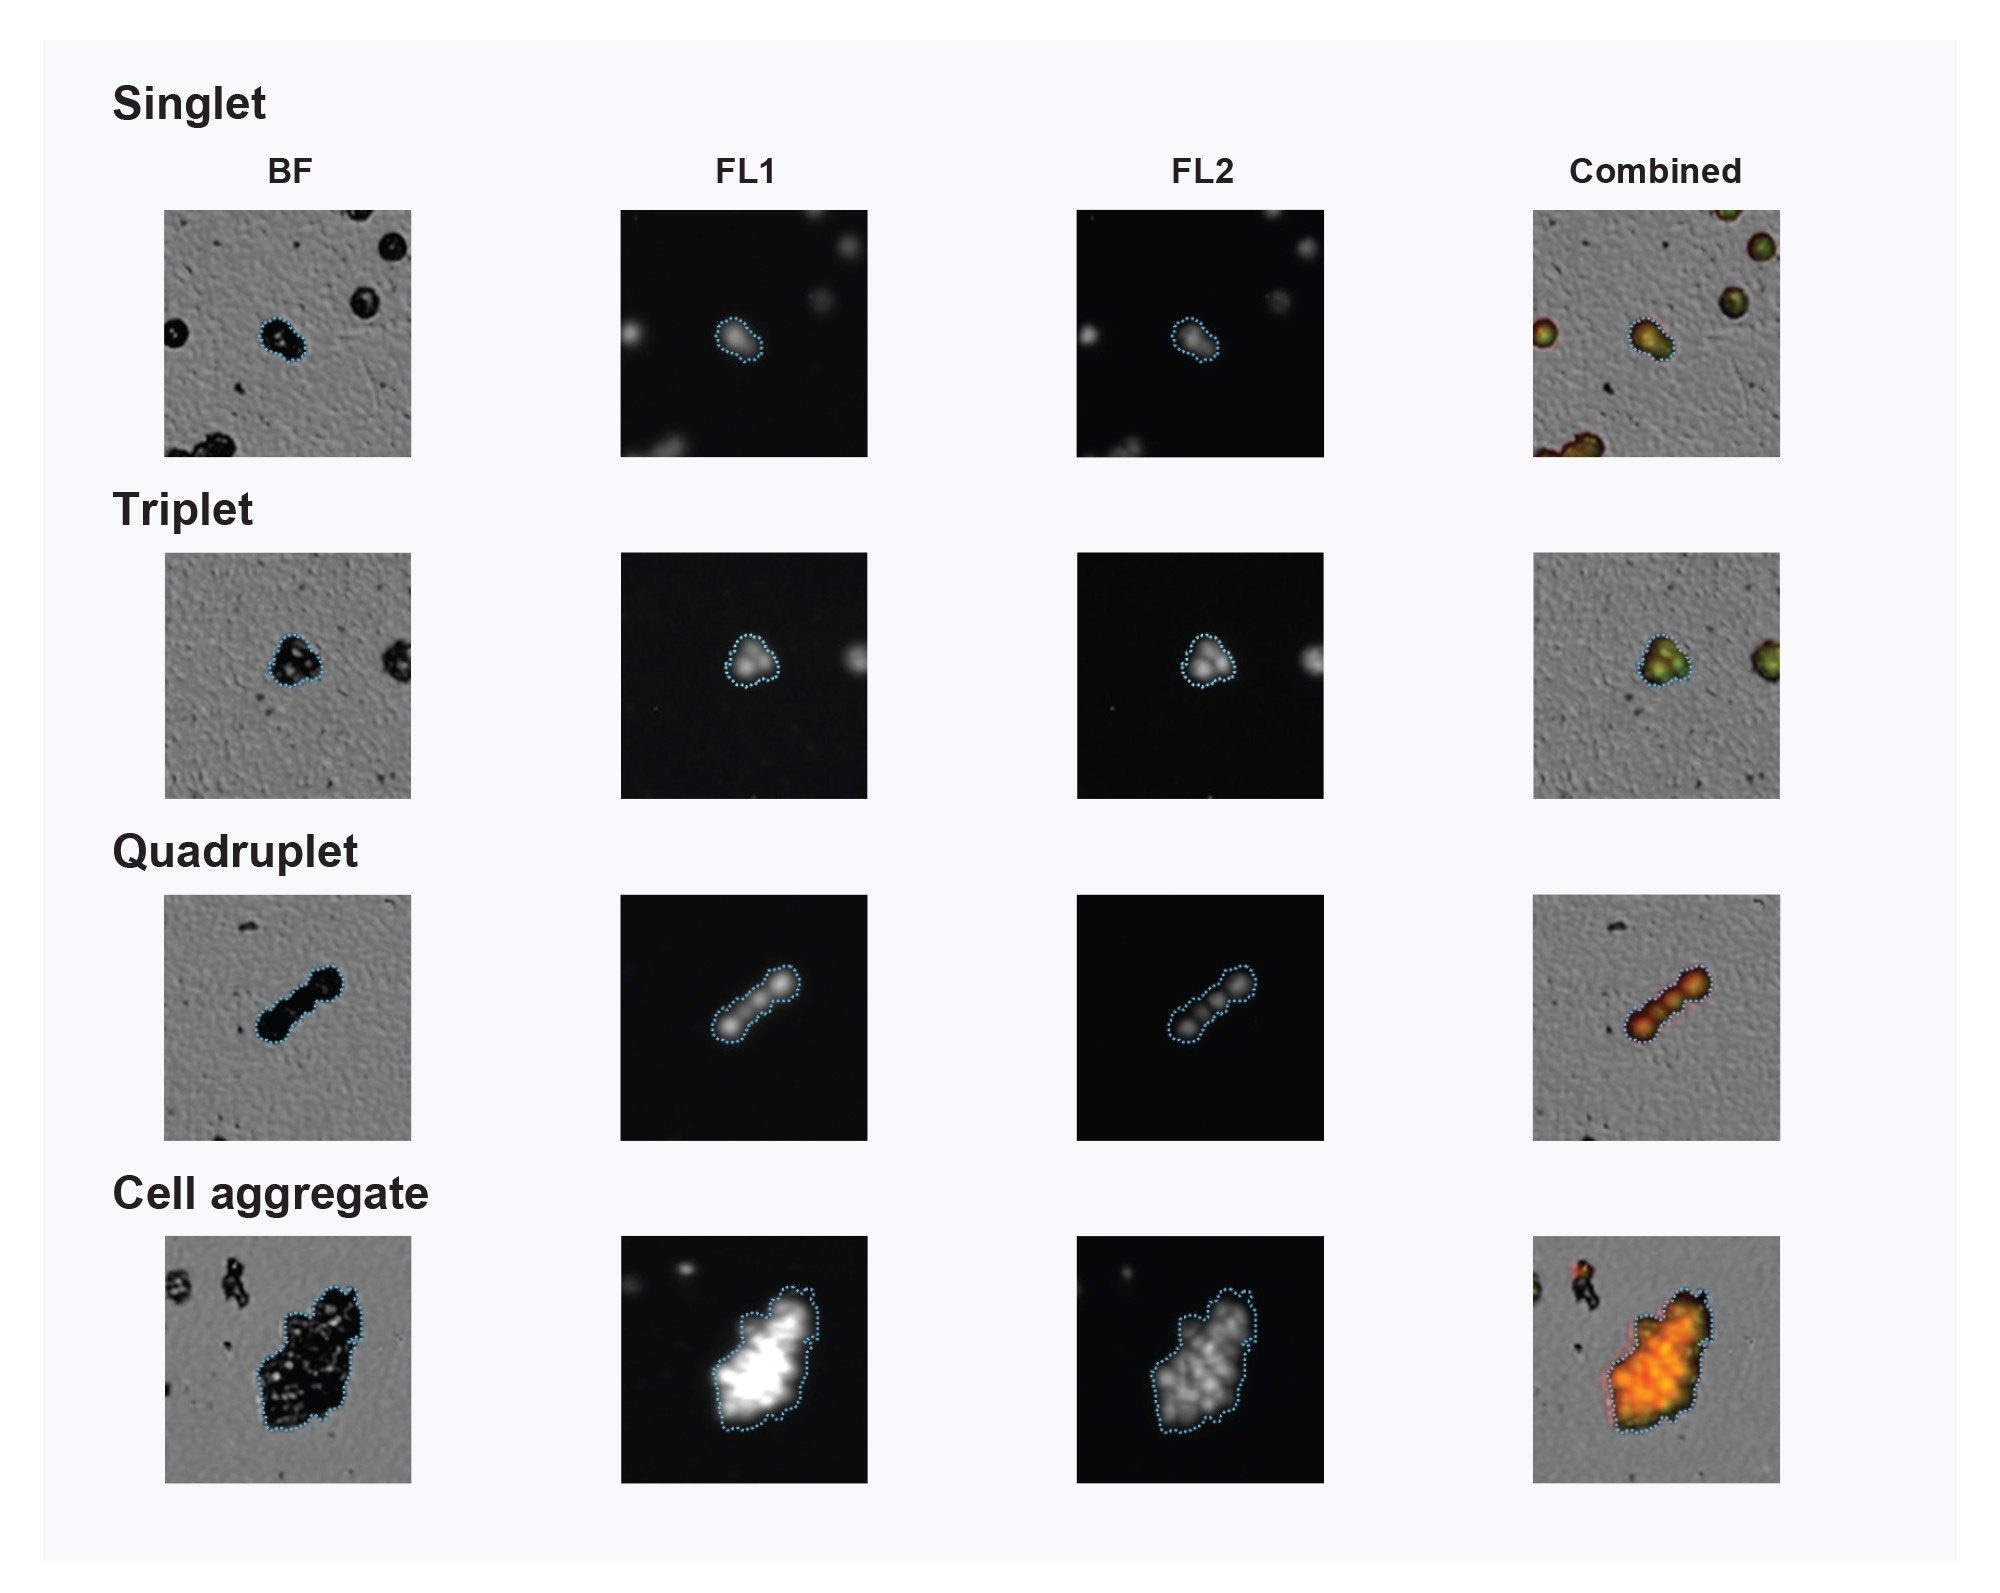
Utilizing the analytical features in Particle Vue™ Software, it demonstrates how to identify individual cells, doublets, triplets, and larger multimers. In Figure 3, a scatter plot of a single well is shown identifying singlets, doublets, triplets, and larger cell aggregates plotted as ECD diameter versus FL2 (DAPI fluorescence) intensity. In this experiment, CAR-T cells are exposed to multiple freeze-thaw cycles, leading to an increase in the formation of cell clusters and large cell aggregates. This data observed a striking difference in the uptake of DNA stain in the large cell aggregates, as shown in Figure 4.
Aura CL System Specifically Identifies Cells in a Mixed Sample
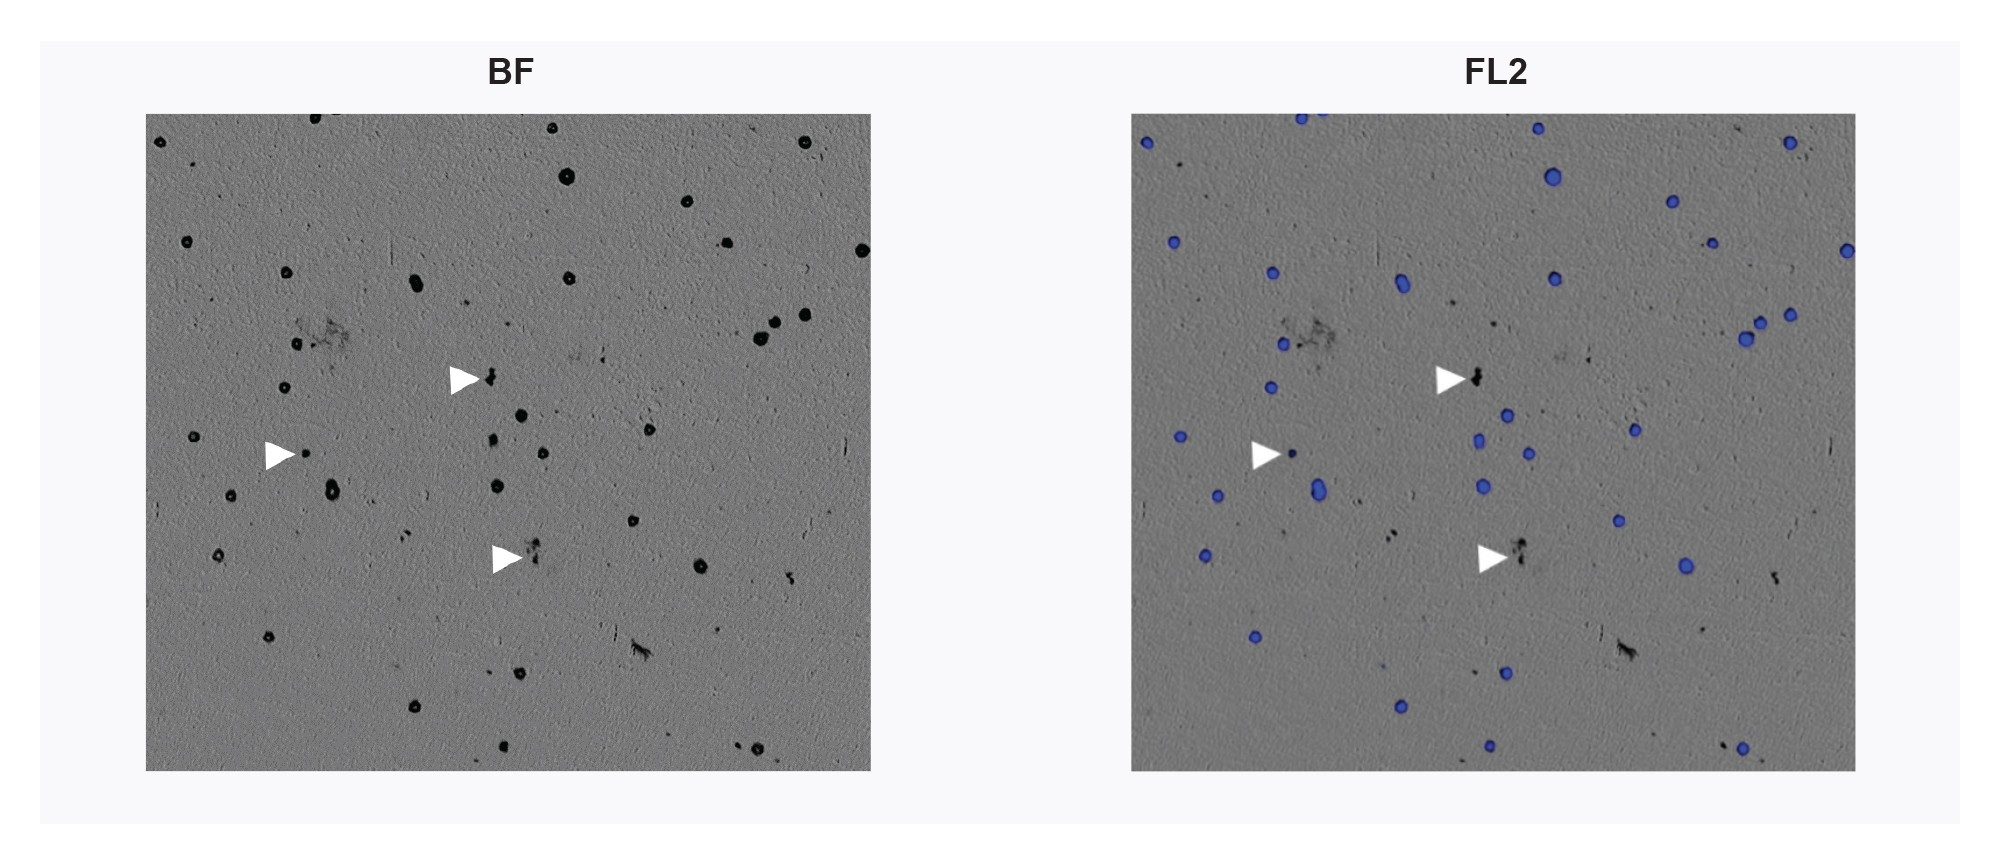
The Aura CL System images the entire sample and provides information on all particles imaged. In Figure 5, it shows a section of a whole well demonstrating the ease by which cells can be distinguished from other subvisible particles (Figure 5, arrows) which are negative for DNA stain.
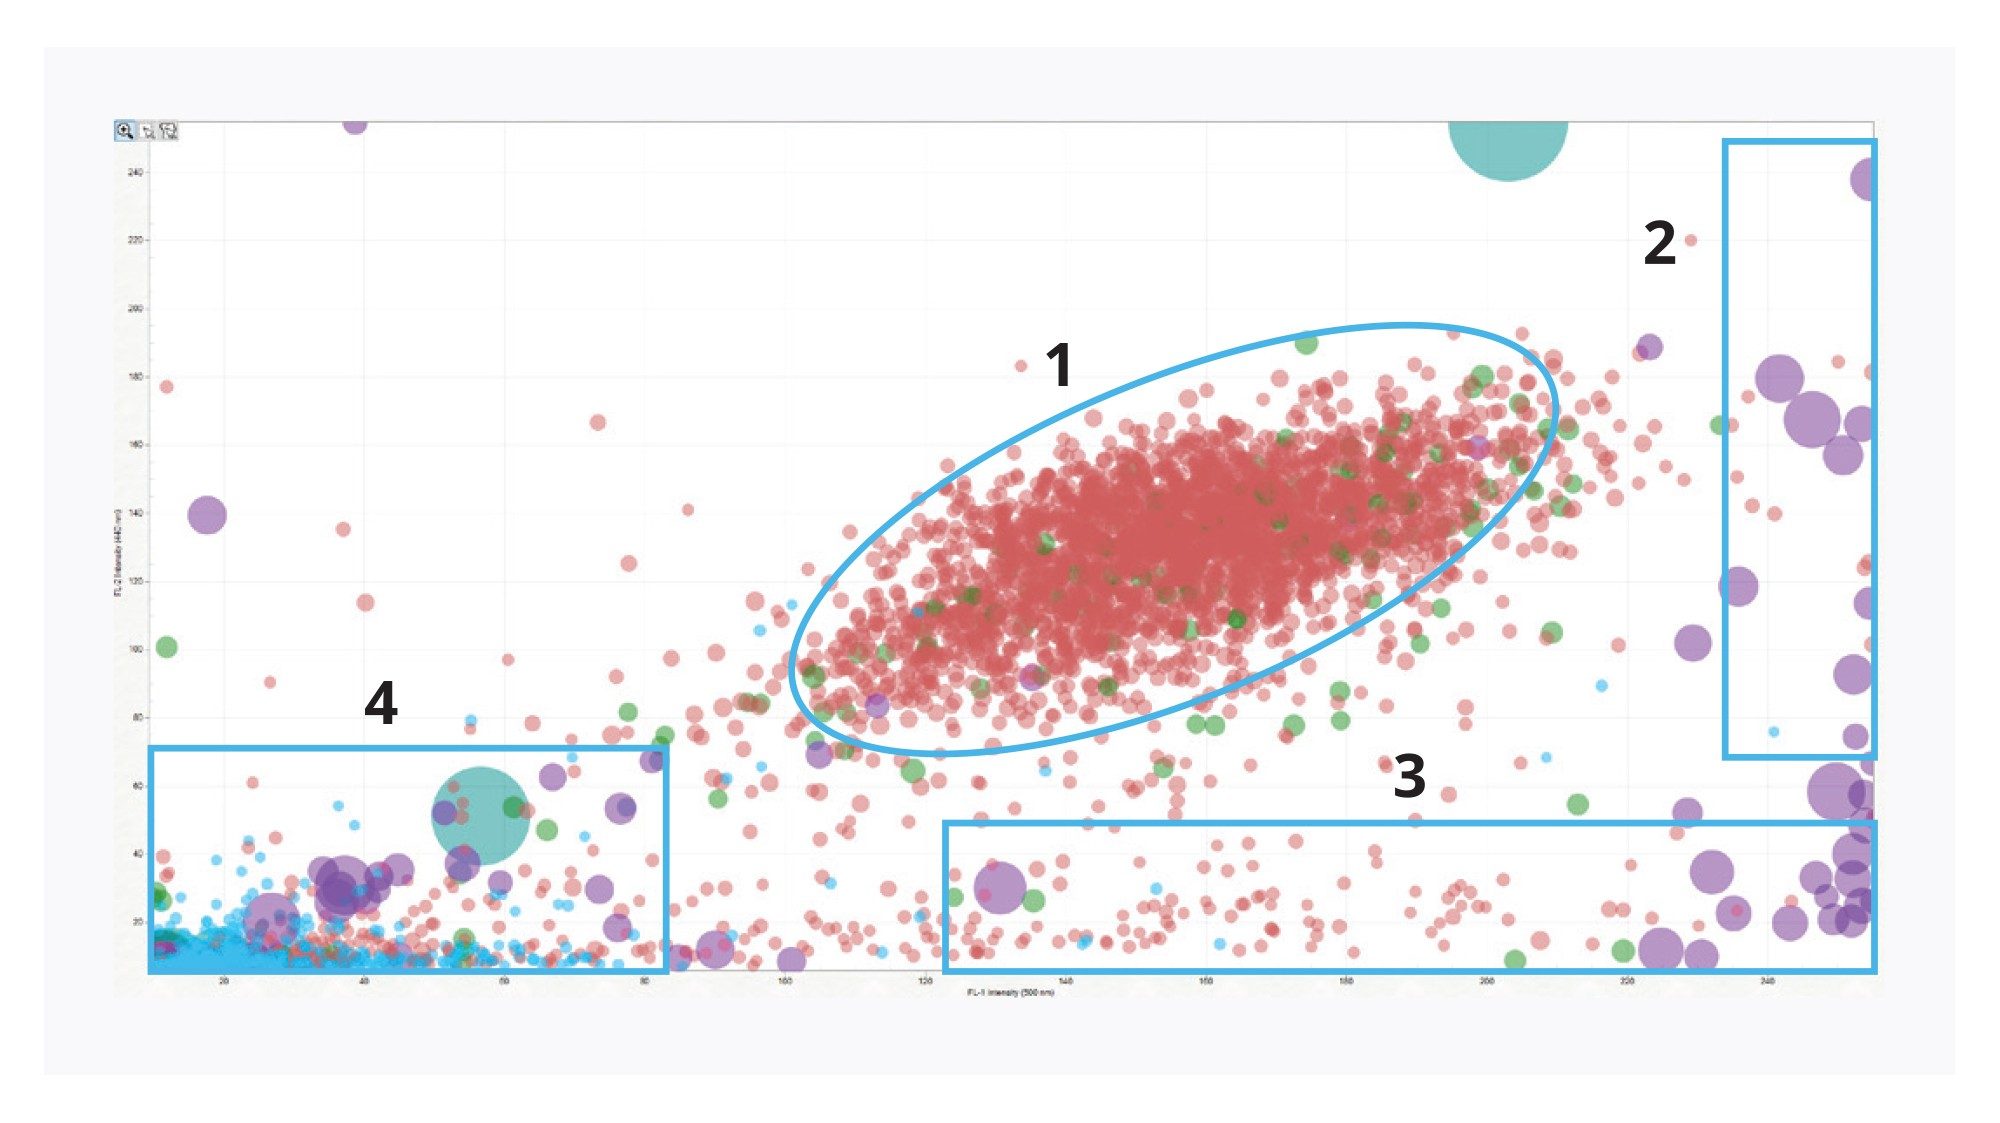
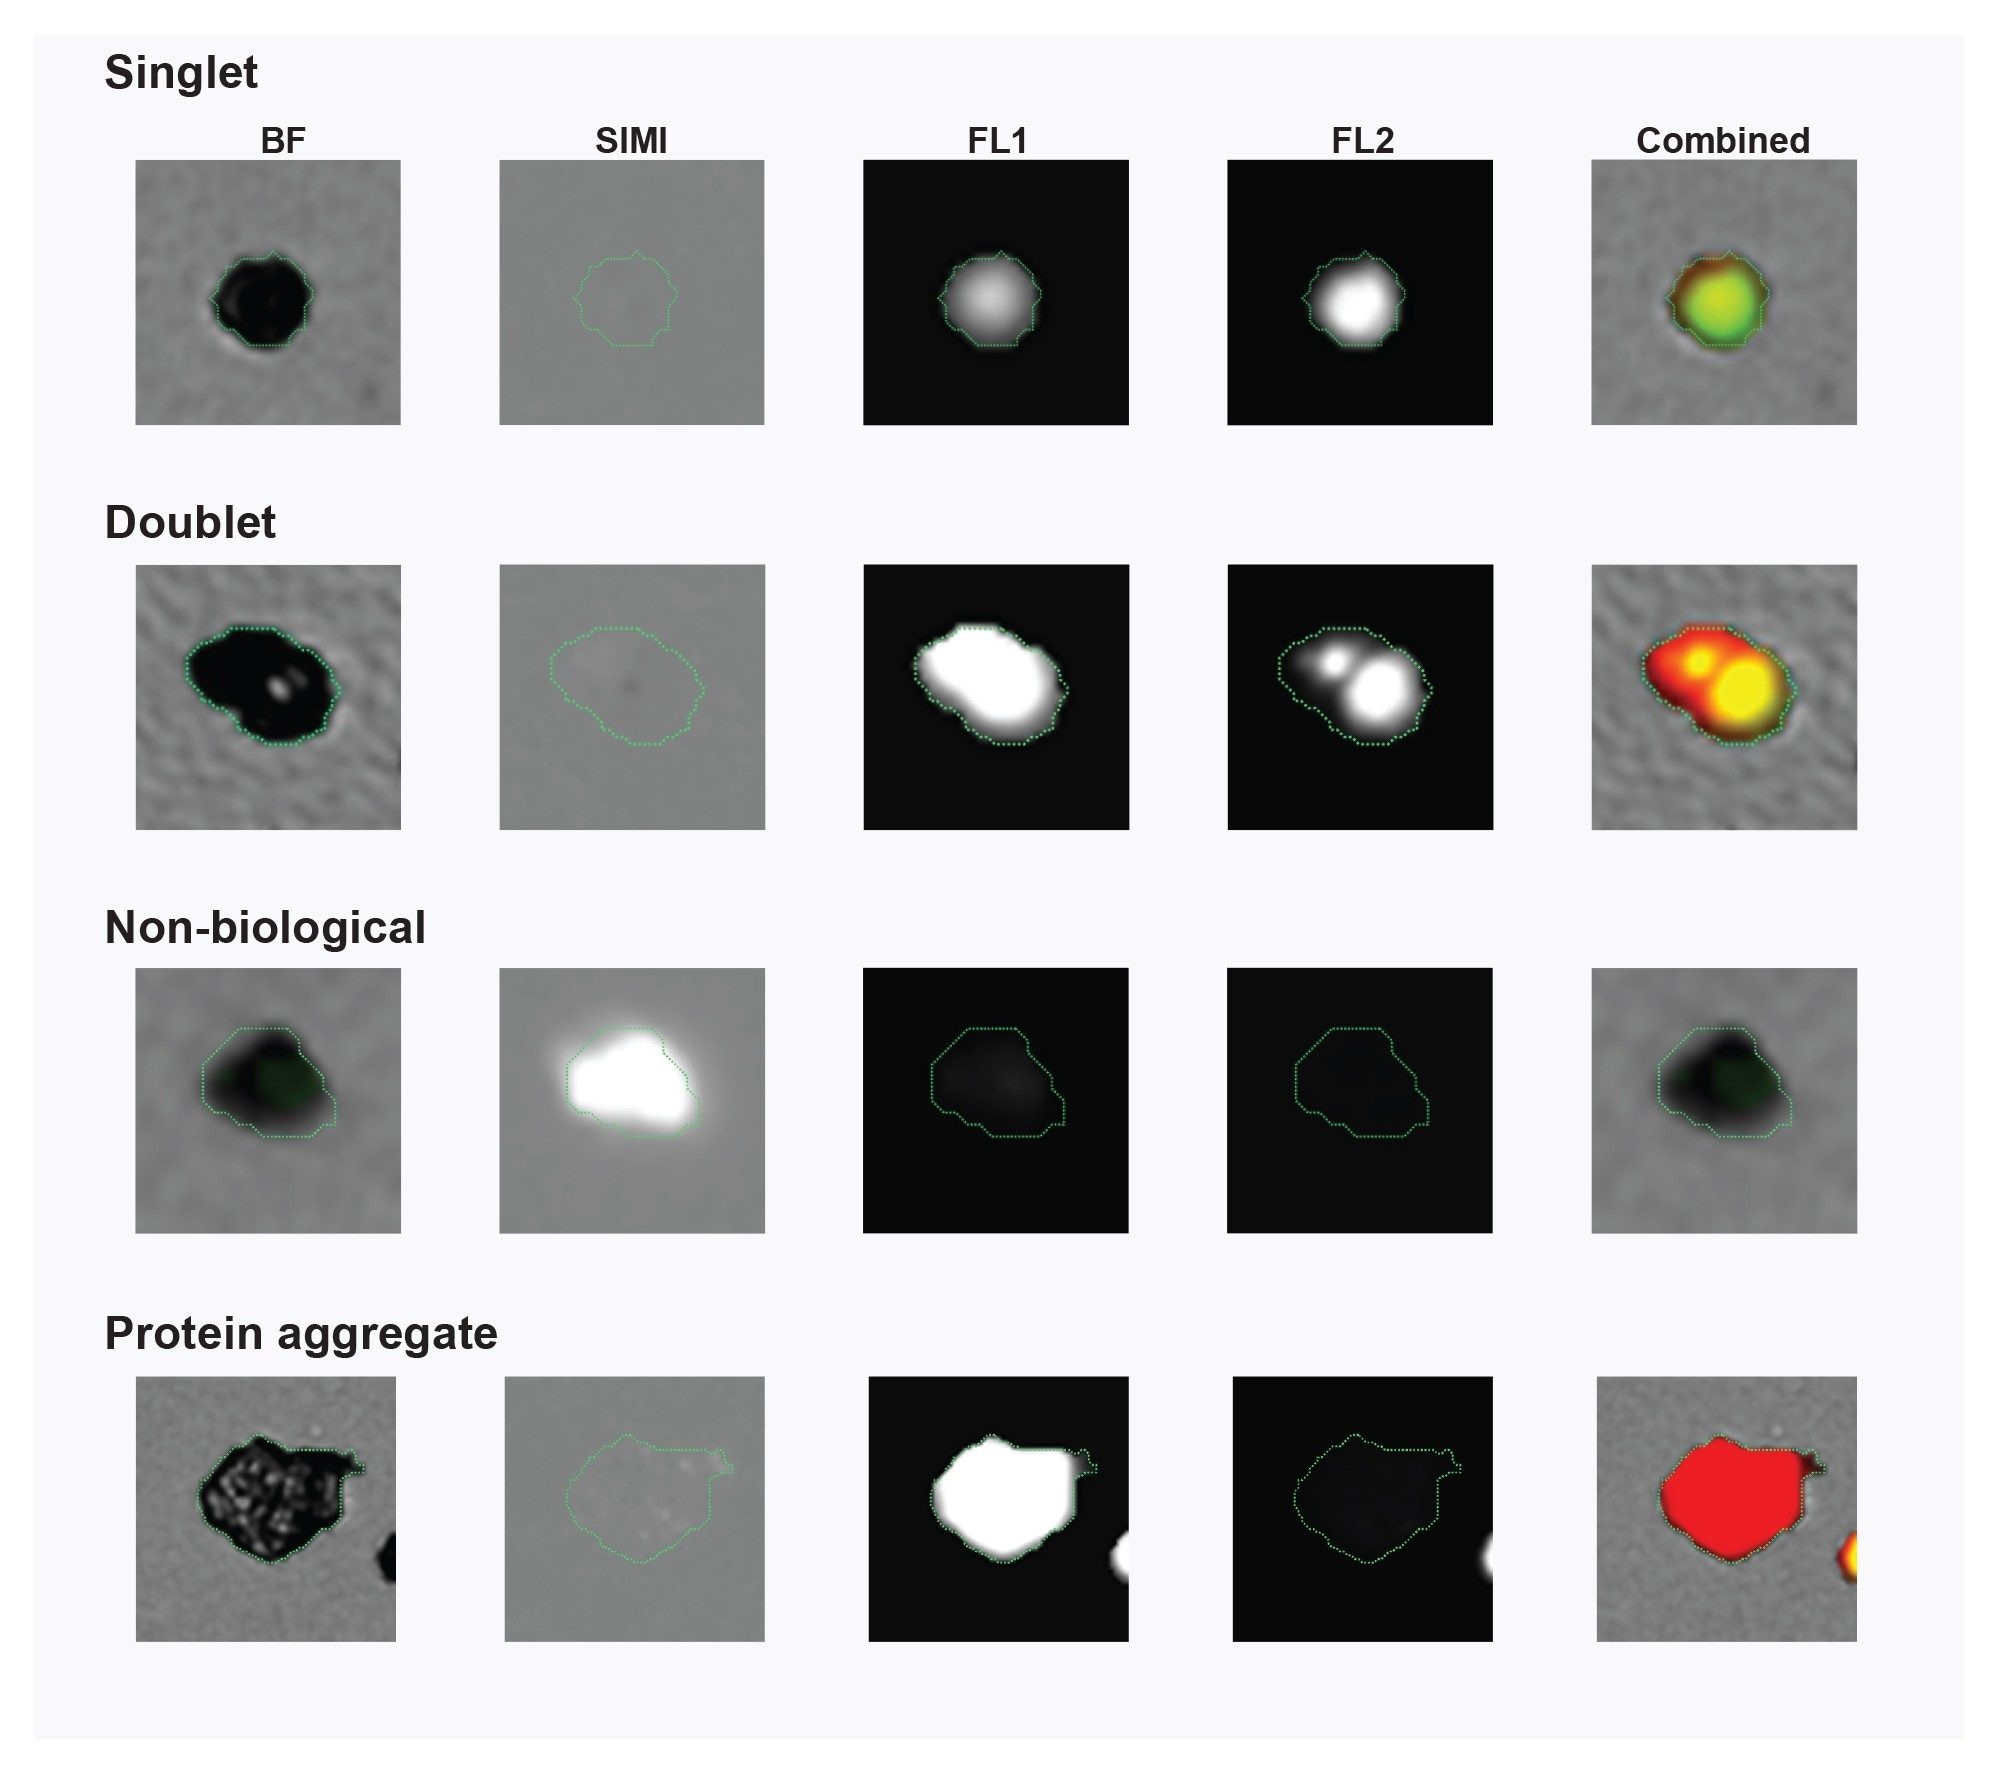
Different particle populations can be easily viewed using the scatter plot function using Particle Vue Software. Cells were labeled with both a DNA nuclei dye and the protein aggregate stain ThT for specific protein identification (Figure 6). Plotting the fluorescent intensity of each particle for each channel easily identifies different particle species. In Figure 6, it shows distinct populations of cells singlets/doublets/triplets which are positive for both protein (FL1) and DNA (FL2) (circle 1), cell aggregates (square 2) which are positive for both protein (FL1) and DNA (FL2) but are larger in area, protein aggregates positive for protein (FL1) only (box 3), and nonbiological particles being negative for both protein and DNA (box 4). The addition of SIMI intensity (side scattering) can aid in the differentiation of particles, as biological material often resides flat on the membrane and thus exhibit low SIMI. Whereas rigid particles, such as plastic or glass, introduced during the manufacturing process, can exhibit high SIMI intensity profiles (Figure 6 box 4 and Figure 7 Non-biological aggregate), indicating a significant protrusion above the membrane. Conversely, particles that exhibit low SIMI, and are negative for protein and DNA may be indicative of cell disruption within the therapeutic product (data not presented).
Conclusion
Aura CL System is uniquely positioned to fully characterize subvisible particles in cell therapy products and characterize small and large cellular aggregates. Here, it showed that using FMM with a combination of DNA and protein aggregate stains allow for the rapid identification of cells, cell aggregates, protein aggregates and non-biological particles in a single, high-throughput assay. The assay is also very flexible, enabling analysis of 5 µL of samples to 10 mL of samples, depending on your application and sample availability. The power of FMM is that for first time it is possible to differentiate non-cellular particles in a cell therapy, developing a better understanding of the quality attributes of the product. Compared to standard flow imaging and cytometry techniques, the throughput of FMM is 100x higher, while using best in class particle sizing and counting analysis that has its roots in the well-established membrane microscopy found in USP 788.
References
- Wen, Y; Jawa V. (2021). The Impact of Product and Process Related Critical Quality Attributes on Immunogenicity and Adverse Immunological Effects of Biotherapeutics. Journal of Pharmaceutical Sciences, 110(3), 1025–1041 DOI: 10.1016/j.xphs.2020.12.003
- Clarke, D; et al. (2016). Managing particulates in cell therapy: Guidance for best practice. Cytotherapy, 18(9):1063–76. DOI: 10.1016/j.jcyt.2016.05.011.
- Marks P; (2019). The FDA’s Regulatory Framework for Chimeric Antigen Receptor-T Cell Therapies. Clinical and translational science, 12(5):428–430. DOI: 10.1111/cts.12666
- Vollrath, I; et al. (2020). Subvisible Particulate Contamination in Cell Therapy Products-Can We Distinguish? Journal of Pharmaceutical Sciences, 109(1):216–219. DOI: 10.1016/j. xphs.2019.09.002.
Featured Products
720009417, June 2021