The deviation and precision of a set of CCS measurements were determined on the Vion IMS QTof platform. CCS was measured for QC and 134 additional small molecule compounds.
The present study suggests that Vion is a robust platform for routine qualitative and quantitative analysis. The high accuracy in CCS and m/z measurement enables its utility for ion mobility and m/z-based compound identification and measurements.
For a typical LC-MS analytical separation and identification, compounds of interest are resolved in the LC dimension (with a defined retention time), then their m/z values are measured on the mass spectrometer. High resolution mass spectrometry (HRMS) provides selectivity and specificity for the specific ion/charge or mass/charge ratio of the analyte of interest and can be reproducibly measured across instrument platforms. However, in the case of complex and variable matrices, or high abundance background signals, identifications based solely on the combination of retention time and m/z may be insufficient due to interference and/or chromatographic variability. A physical property that can help differentiate and identify ions having similar retention time and help resolving multiple species in narrow m/z ranges would be useful both for separation and for confident identification.
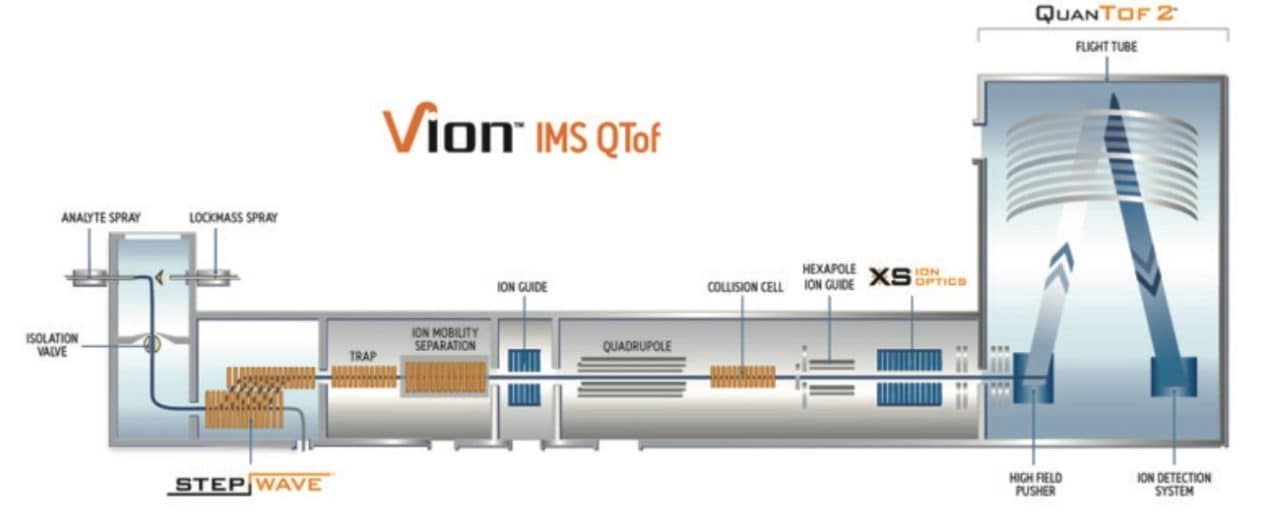
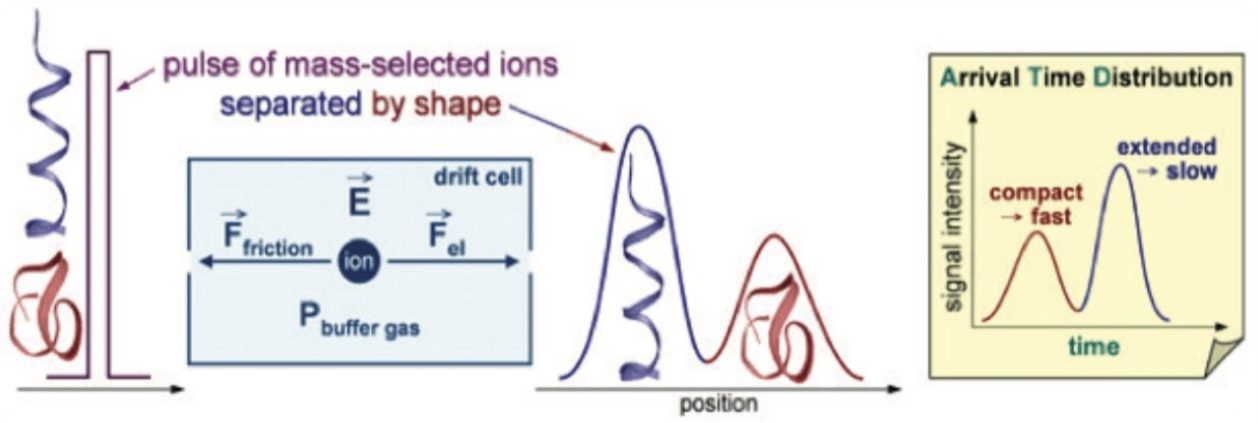
Ion mobility is a measurable property, which can be used to derive the collision cross section (CCS) of a molecule under specific gas and temperature conditions. Waters SYNAPT and Vion MS platforms are capable of sensitive and accurate CCS measurements. On the Vion IMS QTof platform, the ion mobility separation device is located between the StepWave device and the quadrupole (Figure 1). Ion mobility separates ions according to their size and shape and reports the separation as either the drift time or the collision cross section (CCS) value.
For two ions having the same m/z, the ion with a smaller size/shape moves faster through the gas cell and elutes first from the ion mobility cell. This ion has a shorter drift time and a correspondingly smaller CCS value (Figure 2) versus the later eluting ion. The CCS value is a physical property of the compound of interest and is independent of matrix, LC and MS (cone voltage – CV and collision energy – CE) conditions. We can use this property alongside the m/z and the retention time in order to improve the specificity of identifications. In order to be effective, the measurement of CCS must be accurate and precise.
In this application note, the CCS values are measured for 134 small molecule FDA-approved drug standards. The deviation of the experiment was determined based on 30 measurements of eight quality control compounds for which CCS values have been reported.1 The assay precision was determined based on triplicate measurements of the CCS values for each compound at two different concentrations.
The sample preparation and data acquisition followed an internal QC protocol for the CCS measurement as shown in Figure 3. A collection of 134 diverse FDA-approved drugs obtained as 10 mM solutions in DMSO was purchased from an external vendor. The solution was diluted using 30% acetonitrile/70% H2O to two concentrations, a high concentration of 1 µM and a low concentration of 0.2 µM. A total of 6 sample sets were prepared, labeled as P1_high, P1_low, P2_high, P2_low, P3_high, and P3_low (triplicate measurements at high and low concentration). The LC-MS QC Reference Standard solution from Waters [part number 186006963] was used and analyzed before, during, and after each set of analyses.
The analytical LC-MS experiments were performed on a Waters ACQUITY UPLC I-Class System and a Vion IMS QTof Mass Spectrometer. UNIFI Scientific Information System was used for data acquisition and data processing.
LC system: |
ACQUITY UPLC I-Class |
||
Column: |
ACQUITY BEH C18, 1.7 μm, 2.1 x 50 mm |
||
Column temp.: |
45 °C |
||
Sample temp.: |
10 °C |
||
Injection volume: |
1–3 μL |
||
Flow rate: |
0.8 mL/min |
||
Mobile phase A: |
Water with 0.1% formic acid |
||
Mobile phase B: |
Acetonitrile with 0.1% formic acid |
||
Gradient: |
Rapid generic gradient conditions with 3 min run time (Table 1) |
MS system: |
Vion IMS QTof |
||
Ionization mode: |
ESI+, resolution mode (>40,000 FWHM) |
||
Acquisition range: |
50–1000 m/z |
||
Capillary voltage: |
0.5 kV |
||
Cone voltage: |
40 V |
||
Cone gas flow: |
20 L/h |
||
Source temp.: |
120 °C |
||
Desolvation gas temp.: |
550 °C |
||
Desolvation gas flow: |
800 L/h Scan time = 0.1 s |
||
Experiment: |
HDMSE: Collision Energy (CE) settings: low CE, 6.0 eV; high CE, ramp 20-55 eV |
All data were collected using HDMSE (settings shown in Figure 4). HDMSE enables collection of m/z, CCS, and detailed fragment ion spectra in a non-targeted manner. The selectivity afforded by HDMSE improves both the precursor as well as the fragment ion information. A representative dataset including extracted ion chromatogram (XIC), ion mobilogram, spectra with structure annotation, and the result table is shown in Figure 5. The mass error in ppm and observed CCS value is automatically determined for each compound as shown in the component summary table in Figure 5a.
The QC reference solution from Waters contains a mixture of 9 compounds with reported CCS values.1 These compounds are included in MajorMix set up solution (p/n 186008113) used in automated instrument setup. For the QC calibration to pass, the acceptance criteria for both intra and inter instrument measurement require that the observed CCS value is within 2% of the expected value (as shown in Figure 3). In the present study, the CCS value of QC compounds was collected before, during and after each compound set. A total of 30 CCS measurements were recorded for each compound in 6 sets of samples over two weeks. Table 4 summarizes the expected CCS, averaged observed CCS, averaged deviation of the measurement in terms of % difference from reported value (% Delta), and number of measurements. Figure 6 is a plot of % Delta of each compound within each injection of the 6 sets of measurements. Results show excellent deviation, with all individual measurement well within the acceptance criterion of 2%.
Table 2. Summary of averaged measured, expected CCS values, and deviation of QC compounds.
* The expected CCS values are listed in "referencecompound.xml" file (dated 7/18/2016) in UNIFI folder. # Acetaminophen elutes at solvent front and is not included in the summary.
CCS values were measured for 134 diverse compounds with molecular weights ranging from 200 to 900 daltons. The data for representative compounds are summarized in Table 3. For each compound, the reported value is the average of triplicate measurements at two concentrations, for a total of 6 measurements. When data quality is poor at the low sample concentration, the reported value is the average of 3 independent measurements at the higher concentration. Table 3 is a summary of all data obtained, including the number of measurements, averaged CCS value and %RSD of CCS replicates. Figure 7 is a histogram plot showing distribution for the %RSD of CCS reproducibility. The data shows an excellent reproducibility of CCS measurement, for more than 99.3% compounds, the %RSD is ≤0.5%.
The CCS value of a given class of compounds is broadly correlated with m/z.2,3 In this study, when the CCS value is plotted against m/z, there is a linear relationship having slope = 0.2312, intercept = 101, and a coefficient of determination R2 = 0.96 (Figure 8). At a given m/z, the spread of CCS value extends to ~30 Å2. For example, around m/z of 290, CCS value ranges from 160 to 190 Å2. This relationship suggests that CCS prediction based on mass alone is insufficient, additional molecular descriptors such as 3D conformation and partical charge distribution have been shown to be important in CCS prediction.3 The expanded graph in Figure 8 includes the standard deviation of CCS for each compound as the error bar, where the reproducibility is less than 1 Å2. The data suggests that for compounds with the same m/z, high precision of the CCS measurement will help in unambigously identifying the peaks of interest, making CCS highly valuable in discriminating compounds compared to using m/z alone.
For accurate library building or measurements, it is equally important to have high mass accuracy. Vion is the first generation of Waters Tof products to use the new QuanTof 2 Detector (see Figure 1). Compared to the previous detector, QuanTof 2 has increased performance which prevents signal saturation and improves sensitivity and linearity when ion mobility is enabled. These enhancements significantly improve the suitability of the detector for its use in data acquisition across a variety of concentrations and for routine use. The reported mass error for representative compounds is included in Table 3. For the 134 compounds determined in the present study, the RMS is 0.86 ± 0.36 ppm.
The deviation and precision of a set of CCS measurements were determined on the Vion IMS QTof platform. CCS was measured for QC and 134 additional small molecule compounds. Deviation of the measurement was determined based on 30 measurements for each of the eight quality control compounds and found to be well within 2%. Precision was determined based on 6x repeated measurements at two concentrations for each of the 134 commercially available FDA approved drugs. Results showed excellent CCS precision with %RSD less than 0.6% for all compounds. The mass accuracy of the instrument is excellent with RMS less than 1 ppm for the set of compounds measured. In conclusion, the present study suggests that Vion is a robust platform for routine qualitative and quantitative analysis. The high accuracy in CCS and m/z measurement enables its utility for ion mobility and m/z-based compound identification and measurements.
Companion document: UNIFI library of QC and CCS compounds measured in this study.
720005903, January 2017