
Reducing Risk in Cleaning Validation and Cleaning Verification Workflows by Implementation of Mass Detection
George Wilson, Marian Twohig, Stephanie Harden, Cristian Cojocariu
Waters Corporation, United States
Published on September 09, 2026

Abstract
Cleaning validation and cleaning verification are critical activities that prevent cross-contamination of different products which are manufactured using shared equipment. Effective cleaning validation and verification strategies minimize the risk to patient/consumer safety while maximizing the up-time of manufacturing equipment, ultimately maximizing batch output. In this study, the benefits of mass detection in cleaning verification workflows are presented using a range of active pharmaceutical ingredients (APIs) that span highly potent APIs, compounds with poor chromophores and generics.
Benefits
- Mass detection is extremely useful where analytes do not possess a strong chromophore for UV detection
- Mass detection provides increased sensitivity compared to UV, useful when cleaning limits are low (e.g. ppb level) or when high baseline drift is observed using optical detection
- Selectivity of selected ion recording mode reduces the burden on the chromatographic method to separate all sample components
- Empower™ 3 Chromatography Data System (CDS) can be used to automatically flag out of specification cleaning results in customizable reports
Introduction
Cleaning validation is the process of developing and justifying an effective cleaning strategy that prevents cross-contamination. During cleaning method development, different solvents and procedures are evaluated at laboratory scale, with analytical data collected to support selection of the most effective process. During cleaning validation, the cleaning procedure is implemented at manufacturing scale with further analytical data collected across multiple production batches to demonstrate effectiveness and reproducibility. Cleaning verification is then required to ensure continued effectiveness during routine manufacturing.
An important aspect of cleaning validation is establishing an acceptable level of product carryover. European Medicines Agency (EMA) guidance recommends calculating permitted daily exposures (PDEs) using toxicological data.1 The PDE is then used to derive cleaning limits. Two of the most common tests for monitoring residual product/degradant/by-product are the rinse test and the swab test. In rinse testing, the solvents used to clean manufacturing equipment are analyzed for product residues. Swab testing involves directly swabbing different locations within the equipment and subsequently extracting and analyzing the swabs for residues. For biotherapeutics, alternative approaches may be appropriate, as demonstrating API degradation is often considered sufficient to prove cleaning effectiveness. It is expected that analytical data be collected to support this strategy, however.
UV spectroscopy or LC-UV methods often provide sufficient sensitivity to demonstrate compliance with cleaning limits. However, these techniques lack the excellent selectivity and sensitivity offered by mass detection. With standalone UV detection, any sample component that absorbs at the quantification wavelength can interfere with the assay. Similarly, co-eluting compounds in LC-UV analyses may not always be readily apparent. In contrast, selected ion recording (SIR) mass detection enables highly selective monitoring of target analytes, reducing dependence on complete chromatographic separation and increasing confidence in analyte identification and quantification. This can also shorten method development time.
This application note demonstrates how the ACQUITY™ QDa II Mass Detector can support practical cleaning verification workflows for a diverse set of APIs, including challenging compounds with weak UV response and highly potent APIs with low cleaning limits. By providing greater confidence in residue detection, traceable data management, and automated exception reporting, mass detection helps manufacturers maintain audit-ready cleaning verification processes while reducing compliance risk.
Experimental
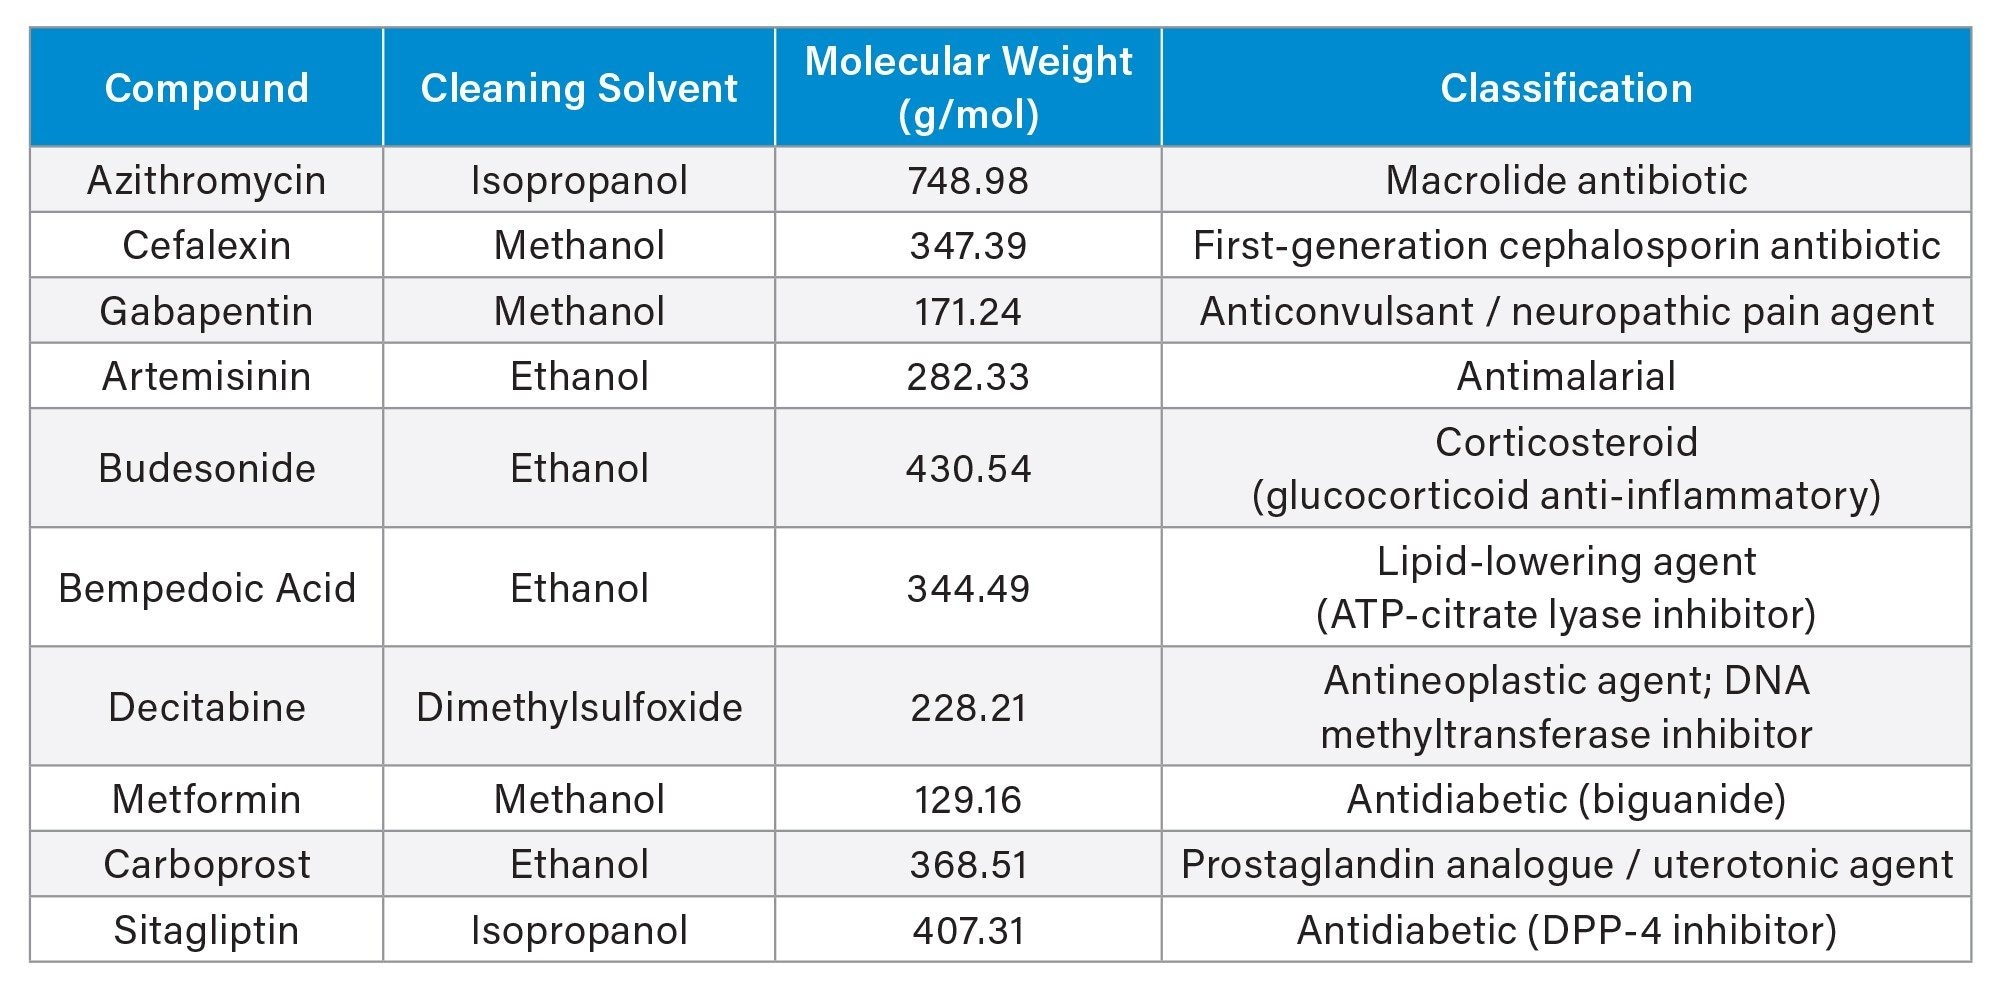
Ten APIs were chosen to demonstrate the utility of mass detection for cleaning verification workflows. This range of compounds was selected to cover analytes with weak/no chromophore (as is the case for azithromycin, gabapentin, and bempedoic acid), and highly potent compounds which typically require lower cleaning limits (for example, budesonide and decitabine). Based on solubility of each API, a suitable class two or three solvent as described in ICH Q3c2 was selected to be used as a cleaning solvent. The full list of compounds and cleaning solvents is given in Table 1.
Chromatographic Method Development
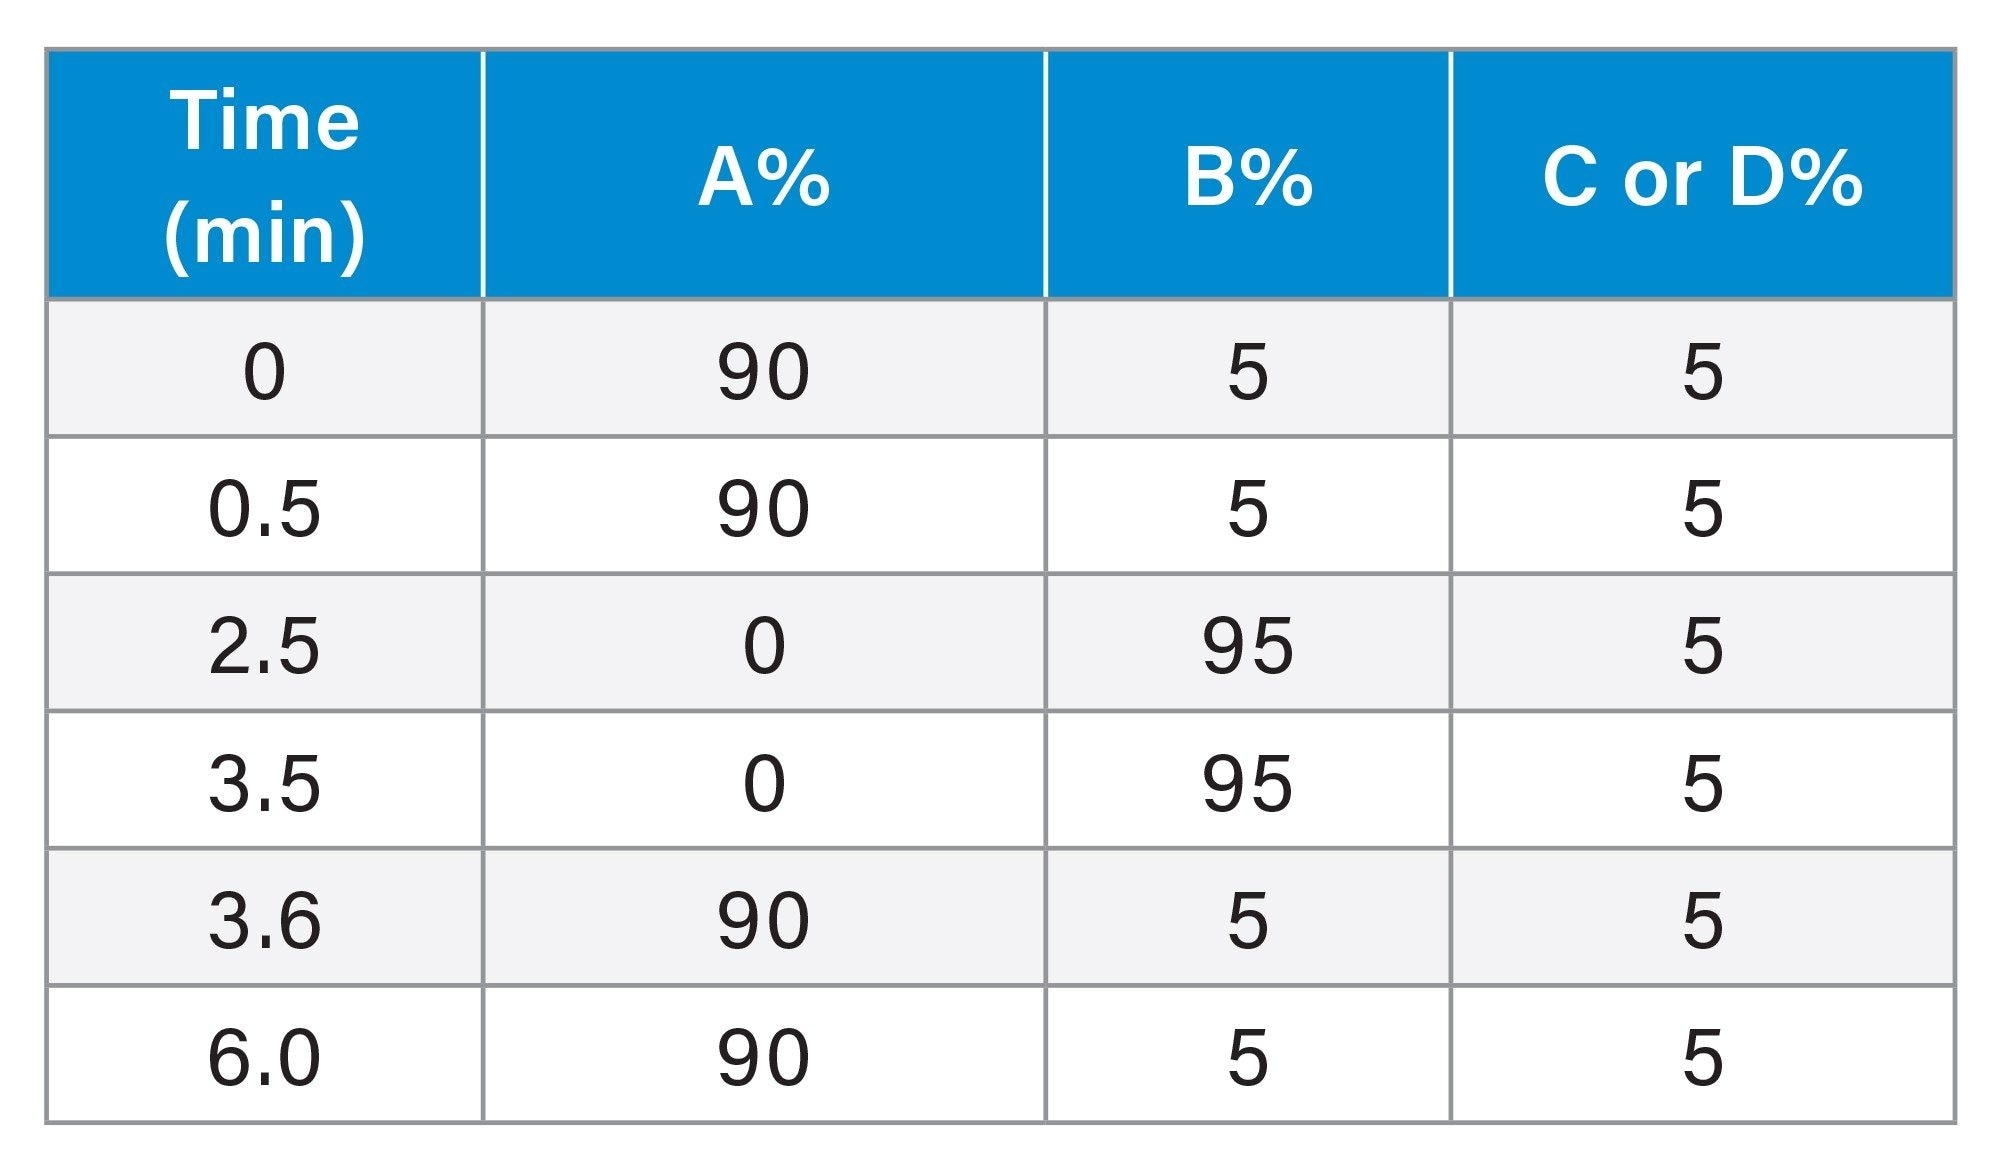
An initial generic chromatographic method screening strategy was applied using a single column and two mobile phase pH (low and high). Chromatographic conditions and gradient are in Table 2. The gradient timetable was designed to deliver 0.05% v/v formic acid or ammonium hydroxide in the mobile phase.
LC Conditions
|
System: |
ACQUITY ARC™ HPLC System with PDA Detector and ACQUITY QDa II Mass Detector |
|
Column: |
XBridge™ C18 Column, 3.5 µm, 4.6 x 50 mm (p/n: 186003031) |
|
Column temperature: |
40 °C |
|
Flow rate: |
1.0 mL/min |
|
Mobile phase A: |
Water |
|
Mobile phase B: |
Acetonitrile |
|
Mobile phase C: |
1% Formic acid in water (Low pH method) |
|
Mobile phase D: |
1% Ammonium hydroxide in water (High pH method) |
|
Injection volume: |
Compound dependent |
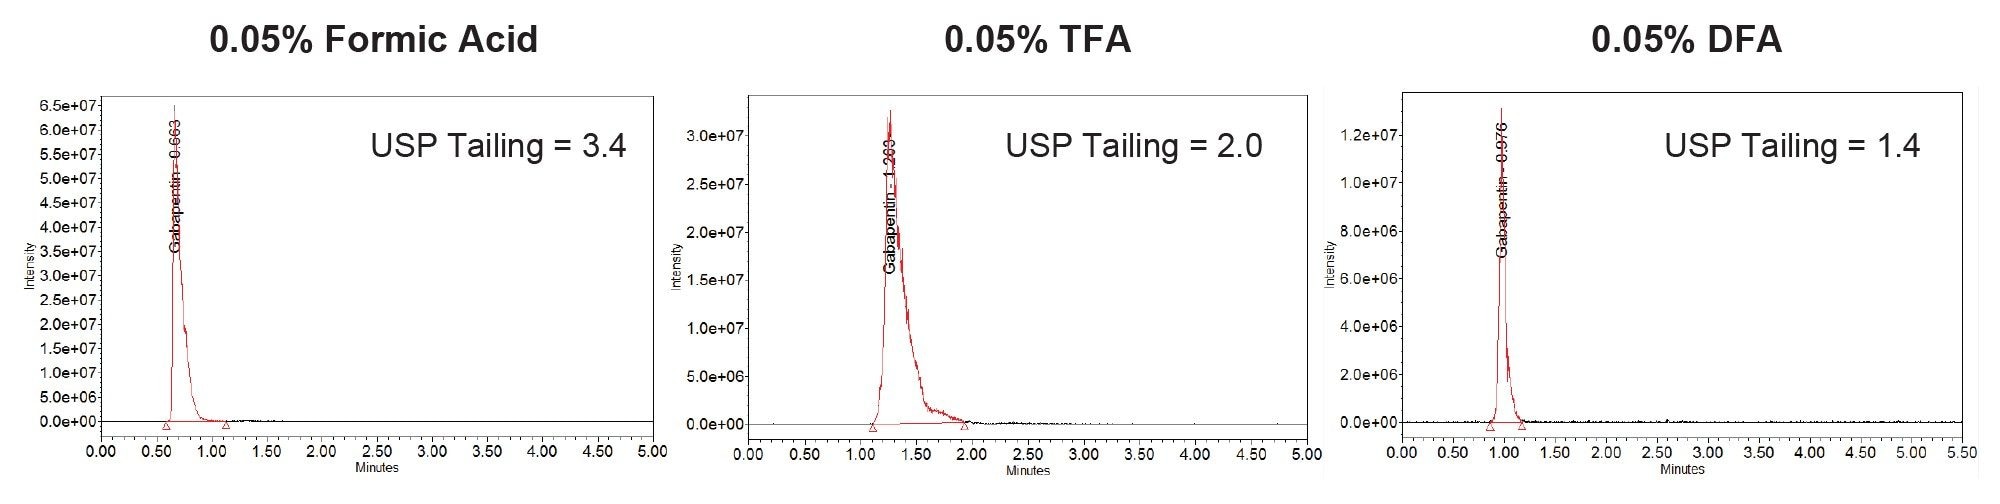
Unacceptable tailing was observed for Gabapentin when analyzed under the low pH condition whilst poor retention was observed at the high pH condition. A common strategy to reduce tailing at low pH with UV detection is to use ion pairing additives such as trifluoroacetic acid (TFA). Whilst TFA meets the volatility requirements for mass detection, its use often results in increased background and suppression of analyte ionization , especially where negative ion mode is used. TFA is also known to be persistent and difficult to remove from surfaces within both the LC and the MS. Difluoroacetic acid (DFA) is an alternative to TFA that is less of an ionization suppressant and less persistent in the MS source. Figure 1 shows the chromatography obtained for Gabapentin when formic acid, TFA, and DFA were used as mobile phase modifiers. 0.1% v/v DFA was selected as the additive for the cleaning verification SIR method. Waters offers an LCMS certified grade DFA known as IonHance™ (p/n:186009201).
Due to their highly polar nature, an alternative retention mechanism was required for metformin and decitabine. Hydrophilic interaction chromatography (HILIC) was selected with the chromatographic conditions in Table 3 found to give suitable chromatography.
Chromatography Conditions
|
System: |
ACQUITY ARC System with PDA Detector and ACQUITY QDa II Mass Detector |
|
Column: |
Atlantis™ Premier BEH™ Z-HILIC Column, 2.5 µm, 2.1 mm x 50 mm (p/n: 186009985) |
|
Column temperature: |
30 °C |
|
Flow rate: |
1.0 mL/min |
|
Mobile phase A: |
90/10 v/v acetonitrile/water + 10 mM ammonium formate + 0.1% v/v Formic acid |
|
Gradient: |
Isocratic |
|
Run time: |
3 minutes |
Table 3: HILIC Chromatographic conditions for Metformin and Decitabine.
Developing an SIR method for cleaning verification is a straightforward process. If the MS base peak for the analyte is unknown, it is recommended to prepare a standard of reasonable concentration (e.g. 0.01-0.1 mg/mL) and acquire both positive and negative MS scans whilst applying a generic chromatographic gradient. Additional detectors (e.g. UV, ELSD, CAD) may be used to aid identification of the retention time. The best chromatographic conditions (e.g. column and mobile phases) are then chosen to suit the analyte based on retention, peak shape etc. When acquiring MS scan data for method development, it is recommended to limit the scan range to that of the expected m/z (e.g. for a typical small molecule analyte with exact mass of 350, a suitable scan range would be 100-450 m/z to ensure collection of any multiply charged species and/or common adducts).
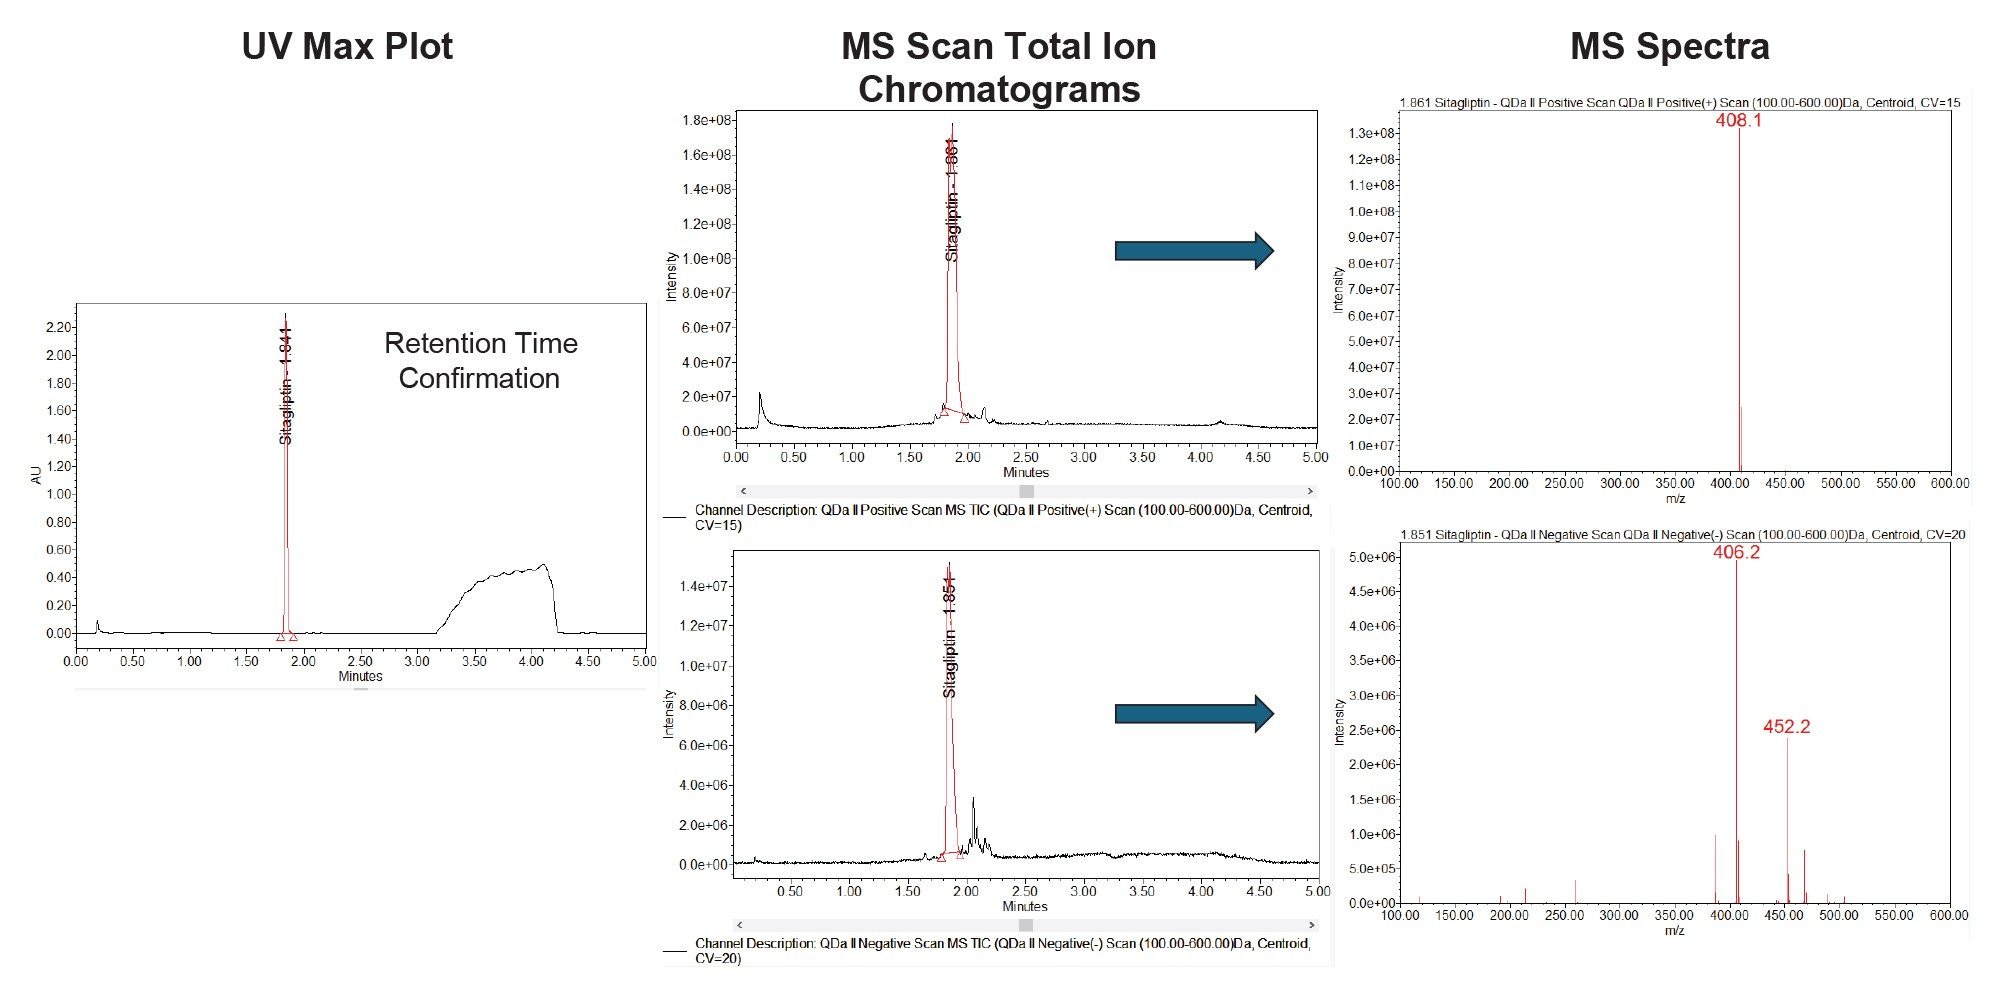
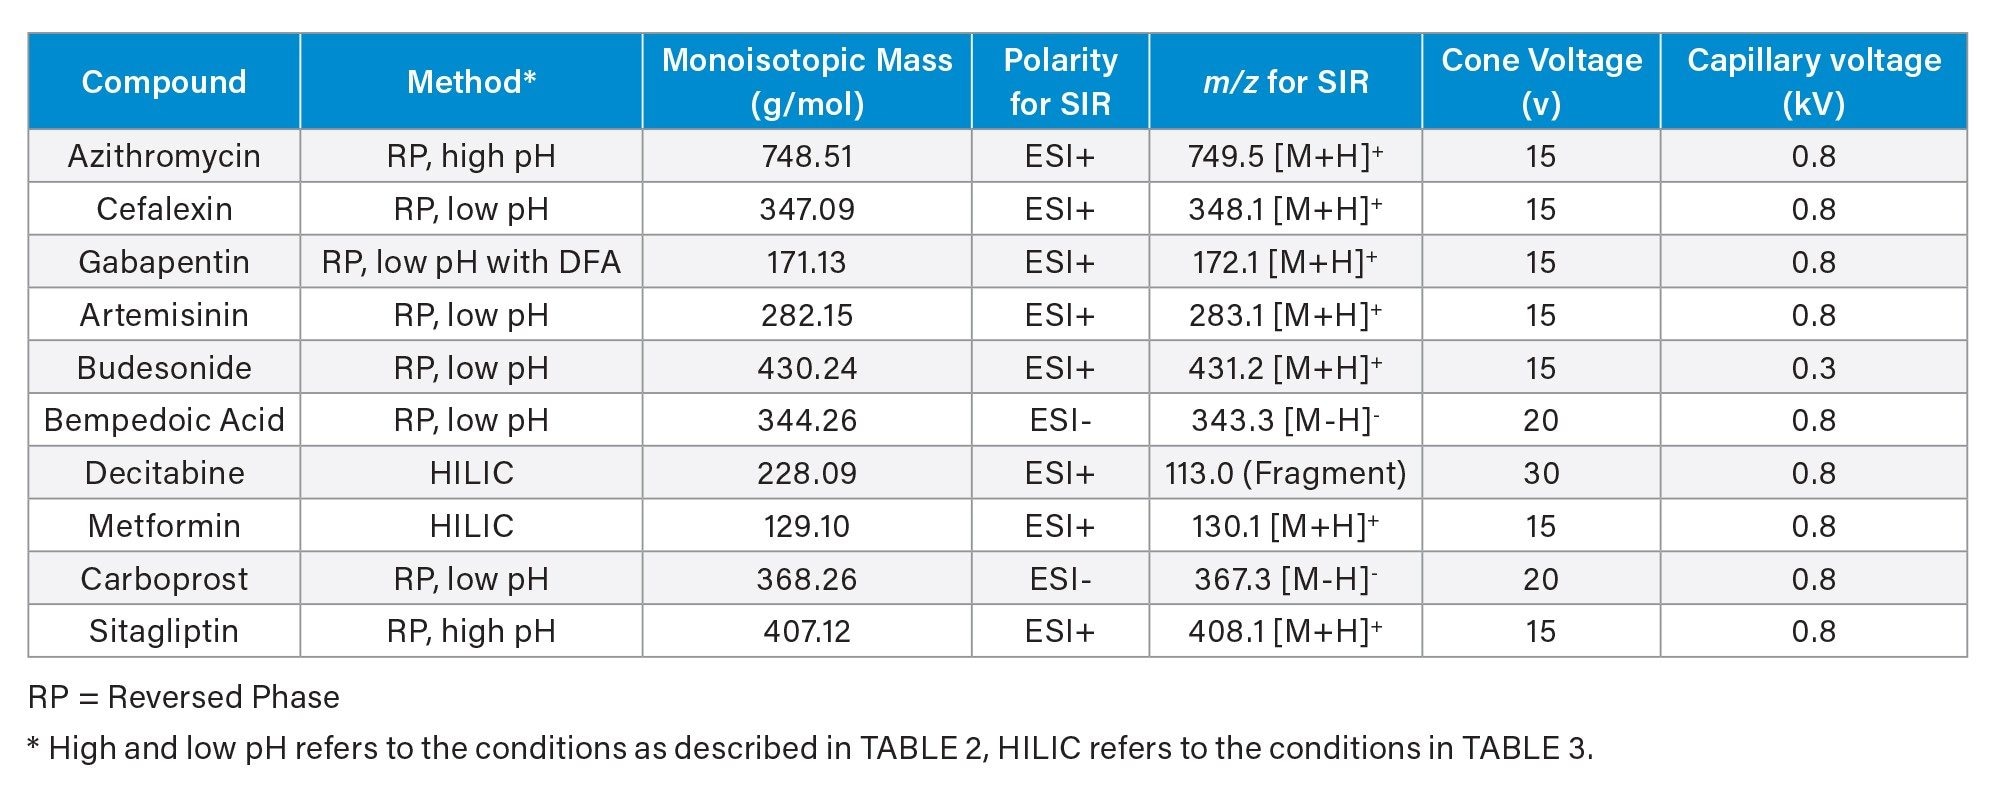
Once the base peak is identified, an SIR method can be written for quantification of residual analyte in cleaning samples. Figure 2 shows how the MS scan data channels were used to define the SIR method for sitagliptin. A similar process was followed to define SIR methods for all the APIs in this study. In most cases, the recommended capillary voltages and cone voltages were selected as described in the ACQUITY QDa II Mass Detector – starting point settings and optimization guidelines.4 Further optimization of MS parameters was not required except for decitabine where a higher cone voltage was selected to deliberately generate the in-source fragment ion, m/z = 113.0. The fragment ion was used for quantitation because multiple adduct species were observed, with apparent differences in their distribution across the calibration range. These differences were hypothesized to result in non-linear behavior at higher decitabine concentrations. Using the in-source fragment ion gave a linear calibration curve. All other MS parameters (e.g. desolvation temperature) were left as default for all compounds. A summary of MS parameters and chromatographic methods can be found in Table 4.
Evaluation of Mass Detection in Cleaning Verification
Cleaning limits are often calculated on a case-by-case basis considering inherent toxicity and risk of exposure of cross-contaminated API to the patient. However, for many APIs, cleaning limits often lie in the approximate range of 1-10 parts per million (ppm). Calibration curves for each API were prepared in cleaning solvent (Table 1) over the range 0.1-1.5 µg/mL (0.1-1.5 ppm) and injected. This range was selected to avoid saturation of the mass spectrometer ion source or detector. For APIs with a typical cleaning limit of 10 ppm, a 1:10 dilution would place samples within the calibration range, giving an effective reporting range of 1-15 ppm. For APIs with lower reporting limits (~1 ppm) such as highly potent APIs, rinse cleaning samples may be analyzed without dilution.
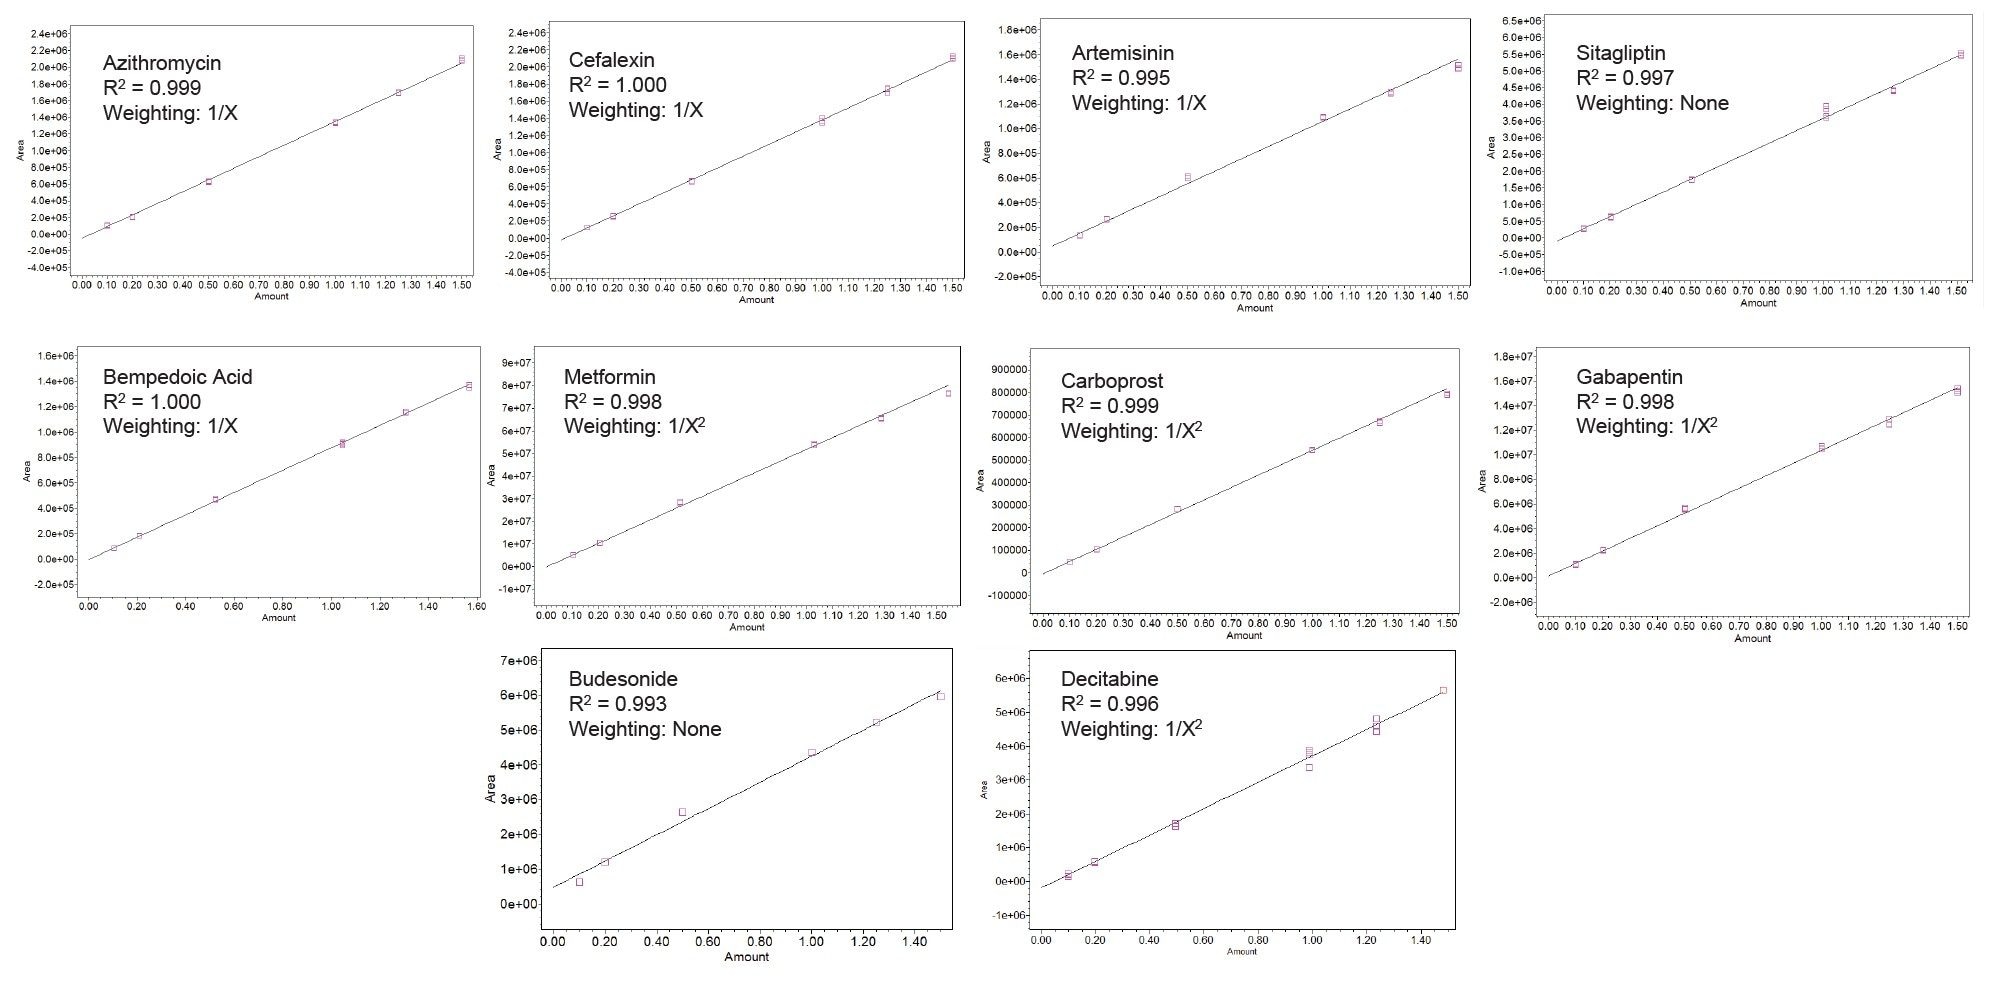
Linear fits were applied and the residuals in the calibration curves were assessed with appropriate weighting models selected using Empower 3 Software. Weighting ensures that the calibration is sufficiently accurate across the entire range as linear models can often suffer bias in either the high or low concentration ranges of the curve. The simplest weighting models were applied as a preference. Concentration deviations of ±20% at the limit of quantitation (LOQ) (set as the lowest point on the calibration curve) and ±15% at all other concentrations were targeted. The resulting calibration plots, weighting methods, and coefficients of determination are displayed in Figure 3.
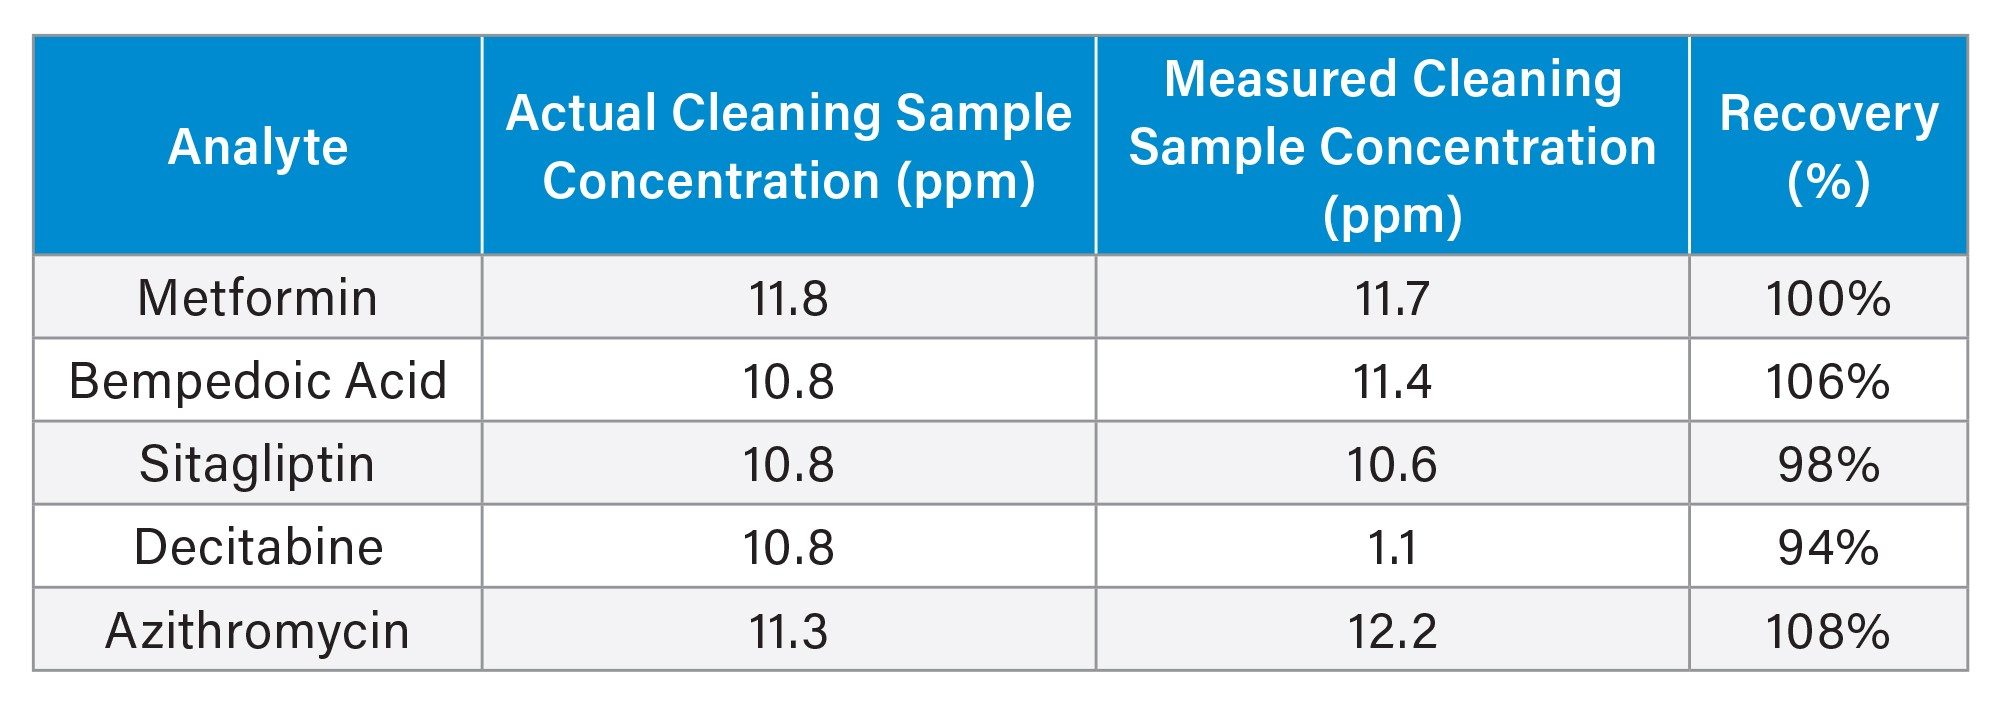
After demonstrating linearity, five compounds (Metformin, Bempedoic acid, Sitagliptin, Decitabine, and Azithromycin) were selected to assess the accuracy when analyzing simulated cleaning samples. A highly accurate analytical cleaning method reduces the risk to patient safety and prevents unnecessary equipment downtime. To prepare representative cleaning samples, a 1 mg/mL stock solution of each API was prepared and serial-diluted in cleaning solvent (Table 1) to achieve a solution concentration of 11 ppm (11 ug/mL). These solutions are intended to mimic the solutions that would be supplied to the QC lab as part of rinse cleaning verification. A cleaning limit of 10 ppm was arbitrarily assigned to azithromycin, metformin, bempedoic acid, and sitagliptin; therefore, the solution concentration of 11 ppm represents a borderline “fail” scenario. For decitabine, a cleaning limit of 1 ppm was assigned to reflect its classification as a highly potent API, for which a lower cleaning limit typically applies. Sample solutions were diluted 1 in 10 with cleaning solvent prior to analysis and quantified against the calibration curves. Although a swab accuracy test was not conducted, the procedures employed after sample collection and swab extraction are expected to be equivalent to those described in this study. The recovery data obtained can be found in Table 5. Excellent recoveries were obtained in the region of 94-108% across all compounds, giving the user confidence that the correct result would be obtained in routine cleaning verification assays.
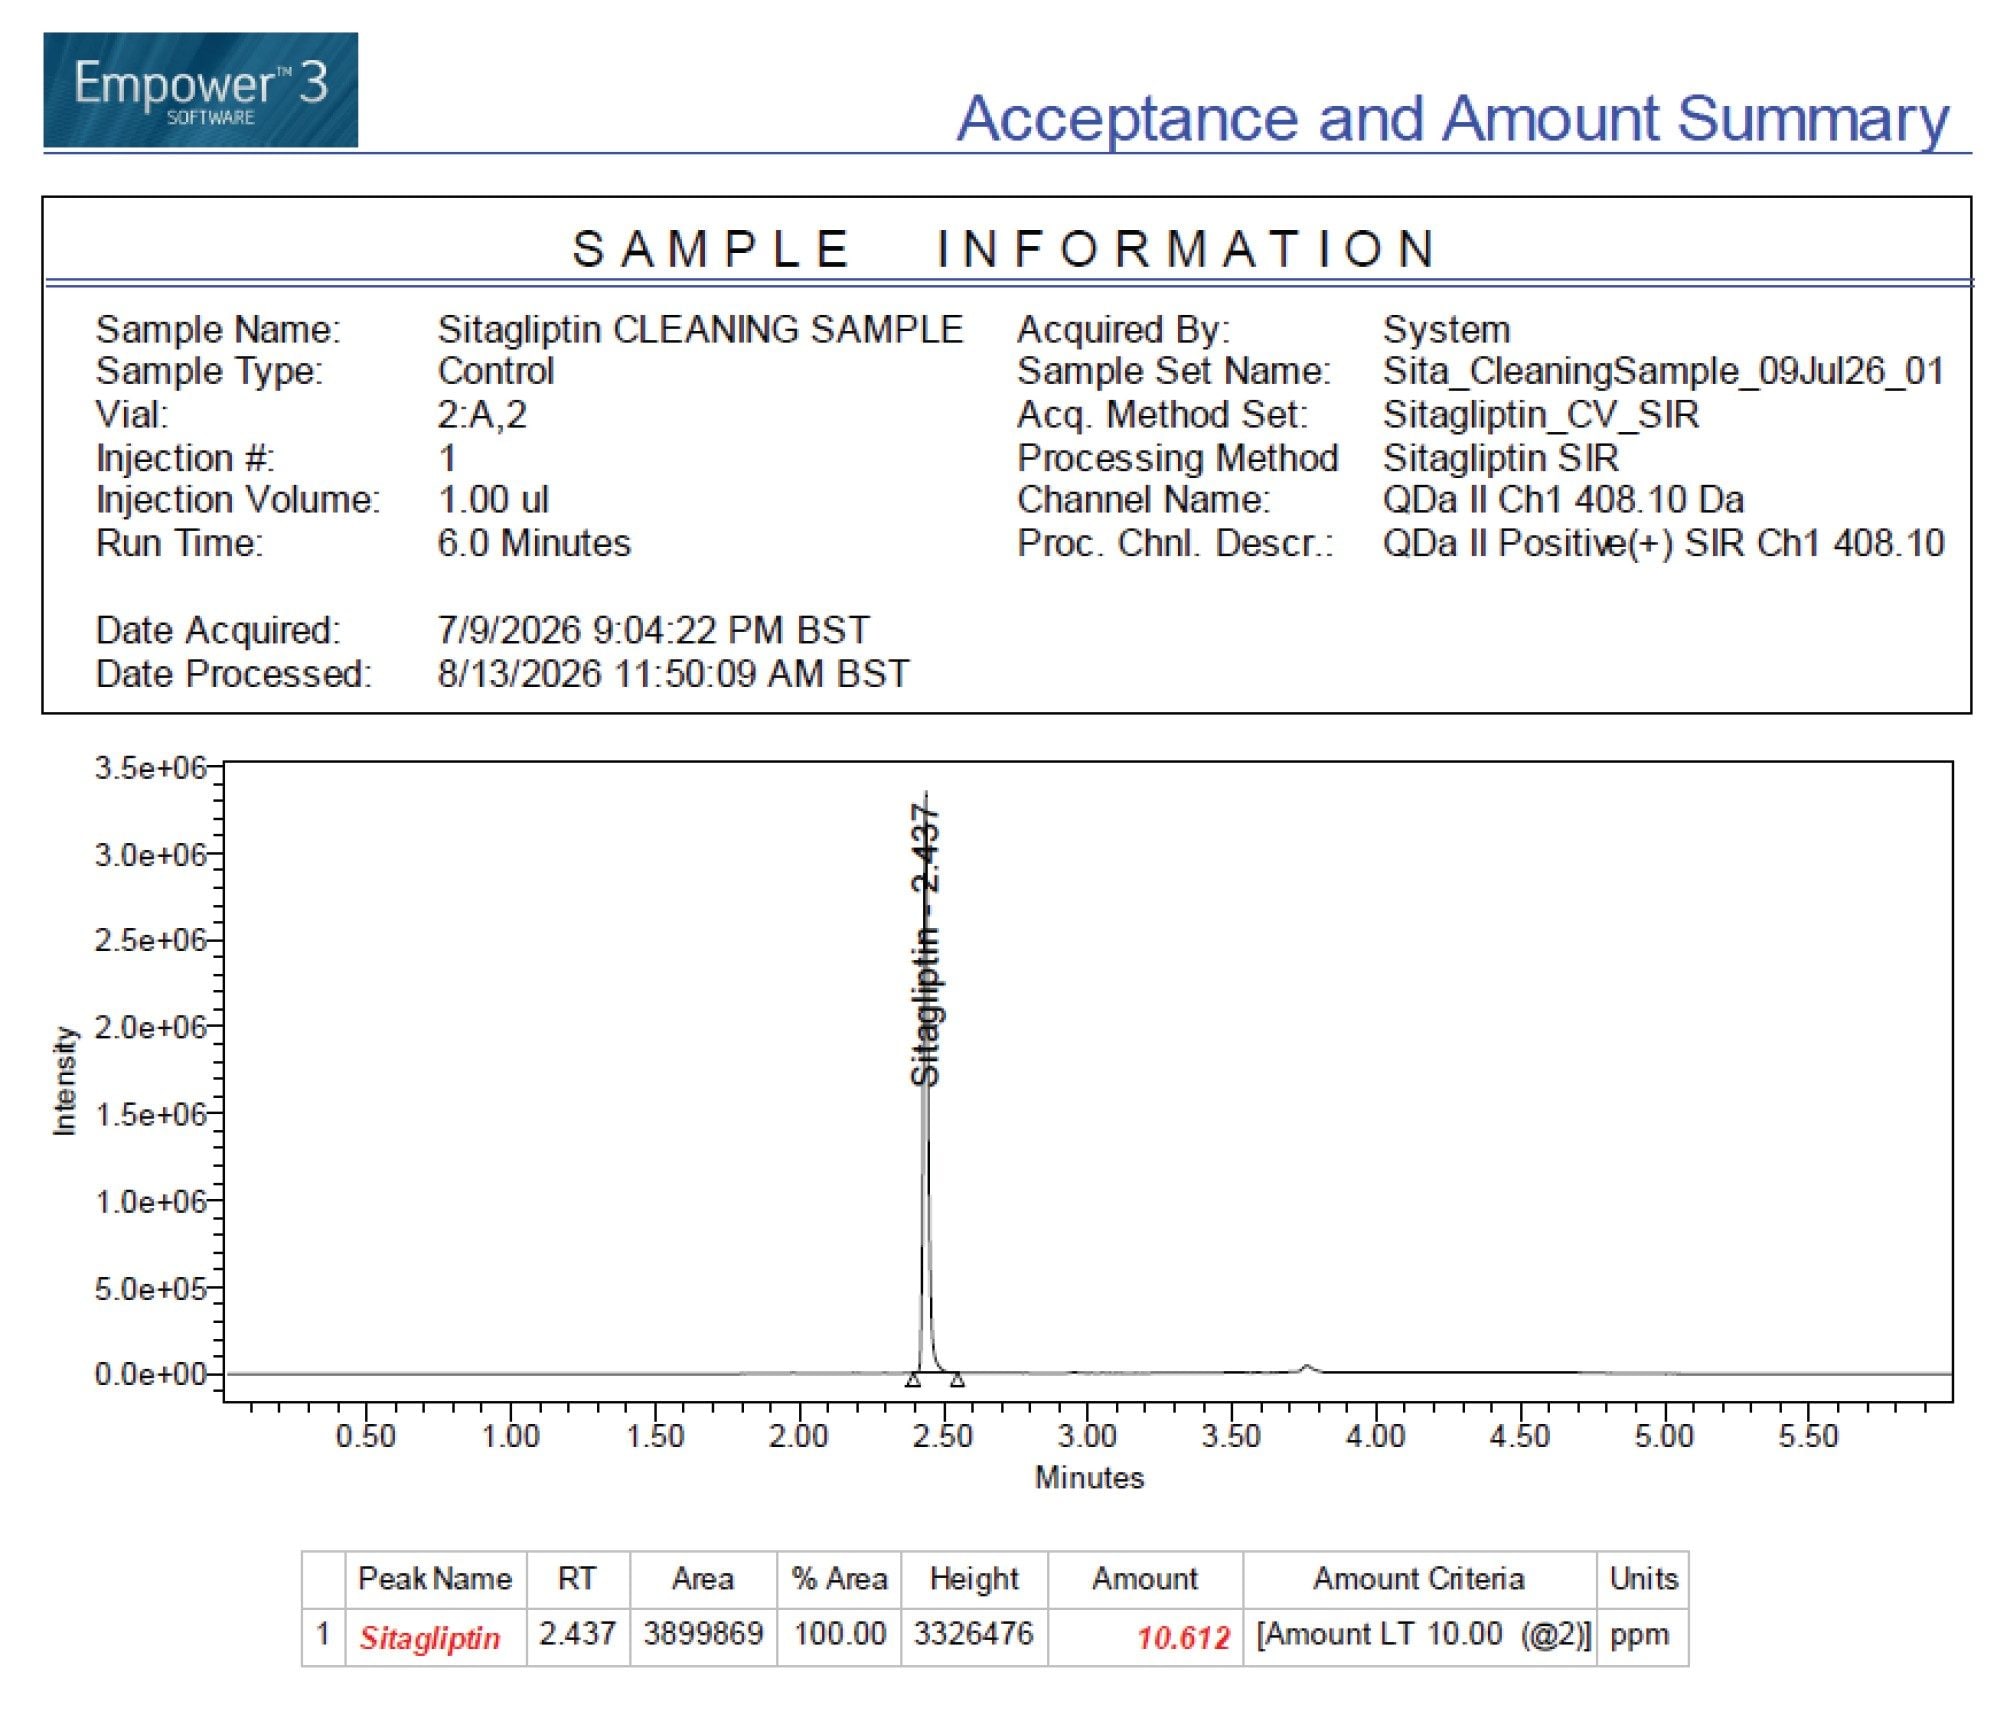
It is important that any samples failing to meet specification are promptly identified and appropriate action is taken. Empower Software supports this process by automatically flagging results that fall outside predefined acceptance criteria, displaying them in bold, red, italicized text within the review window. Additionally, custom report templates can be configured to clearly highlight results which exceed cleaning limits, as illustrated in Figure 4. This functionality improves result visibility and helps reduce the risk of errors, such as incorrect rounding when comparing results against specification limits.
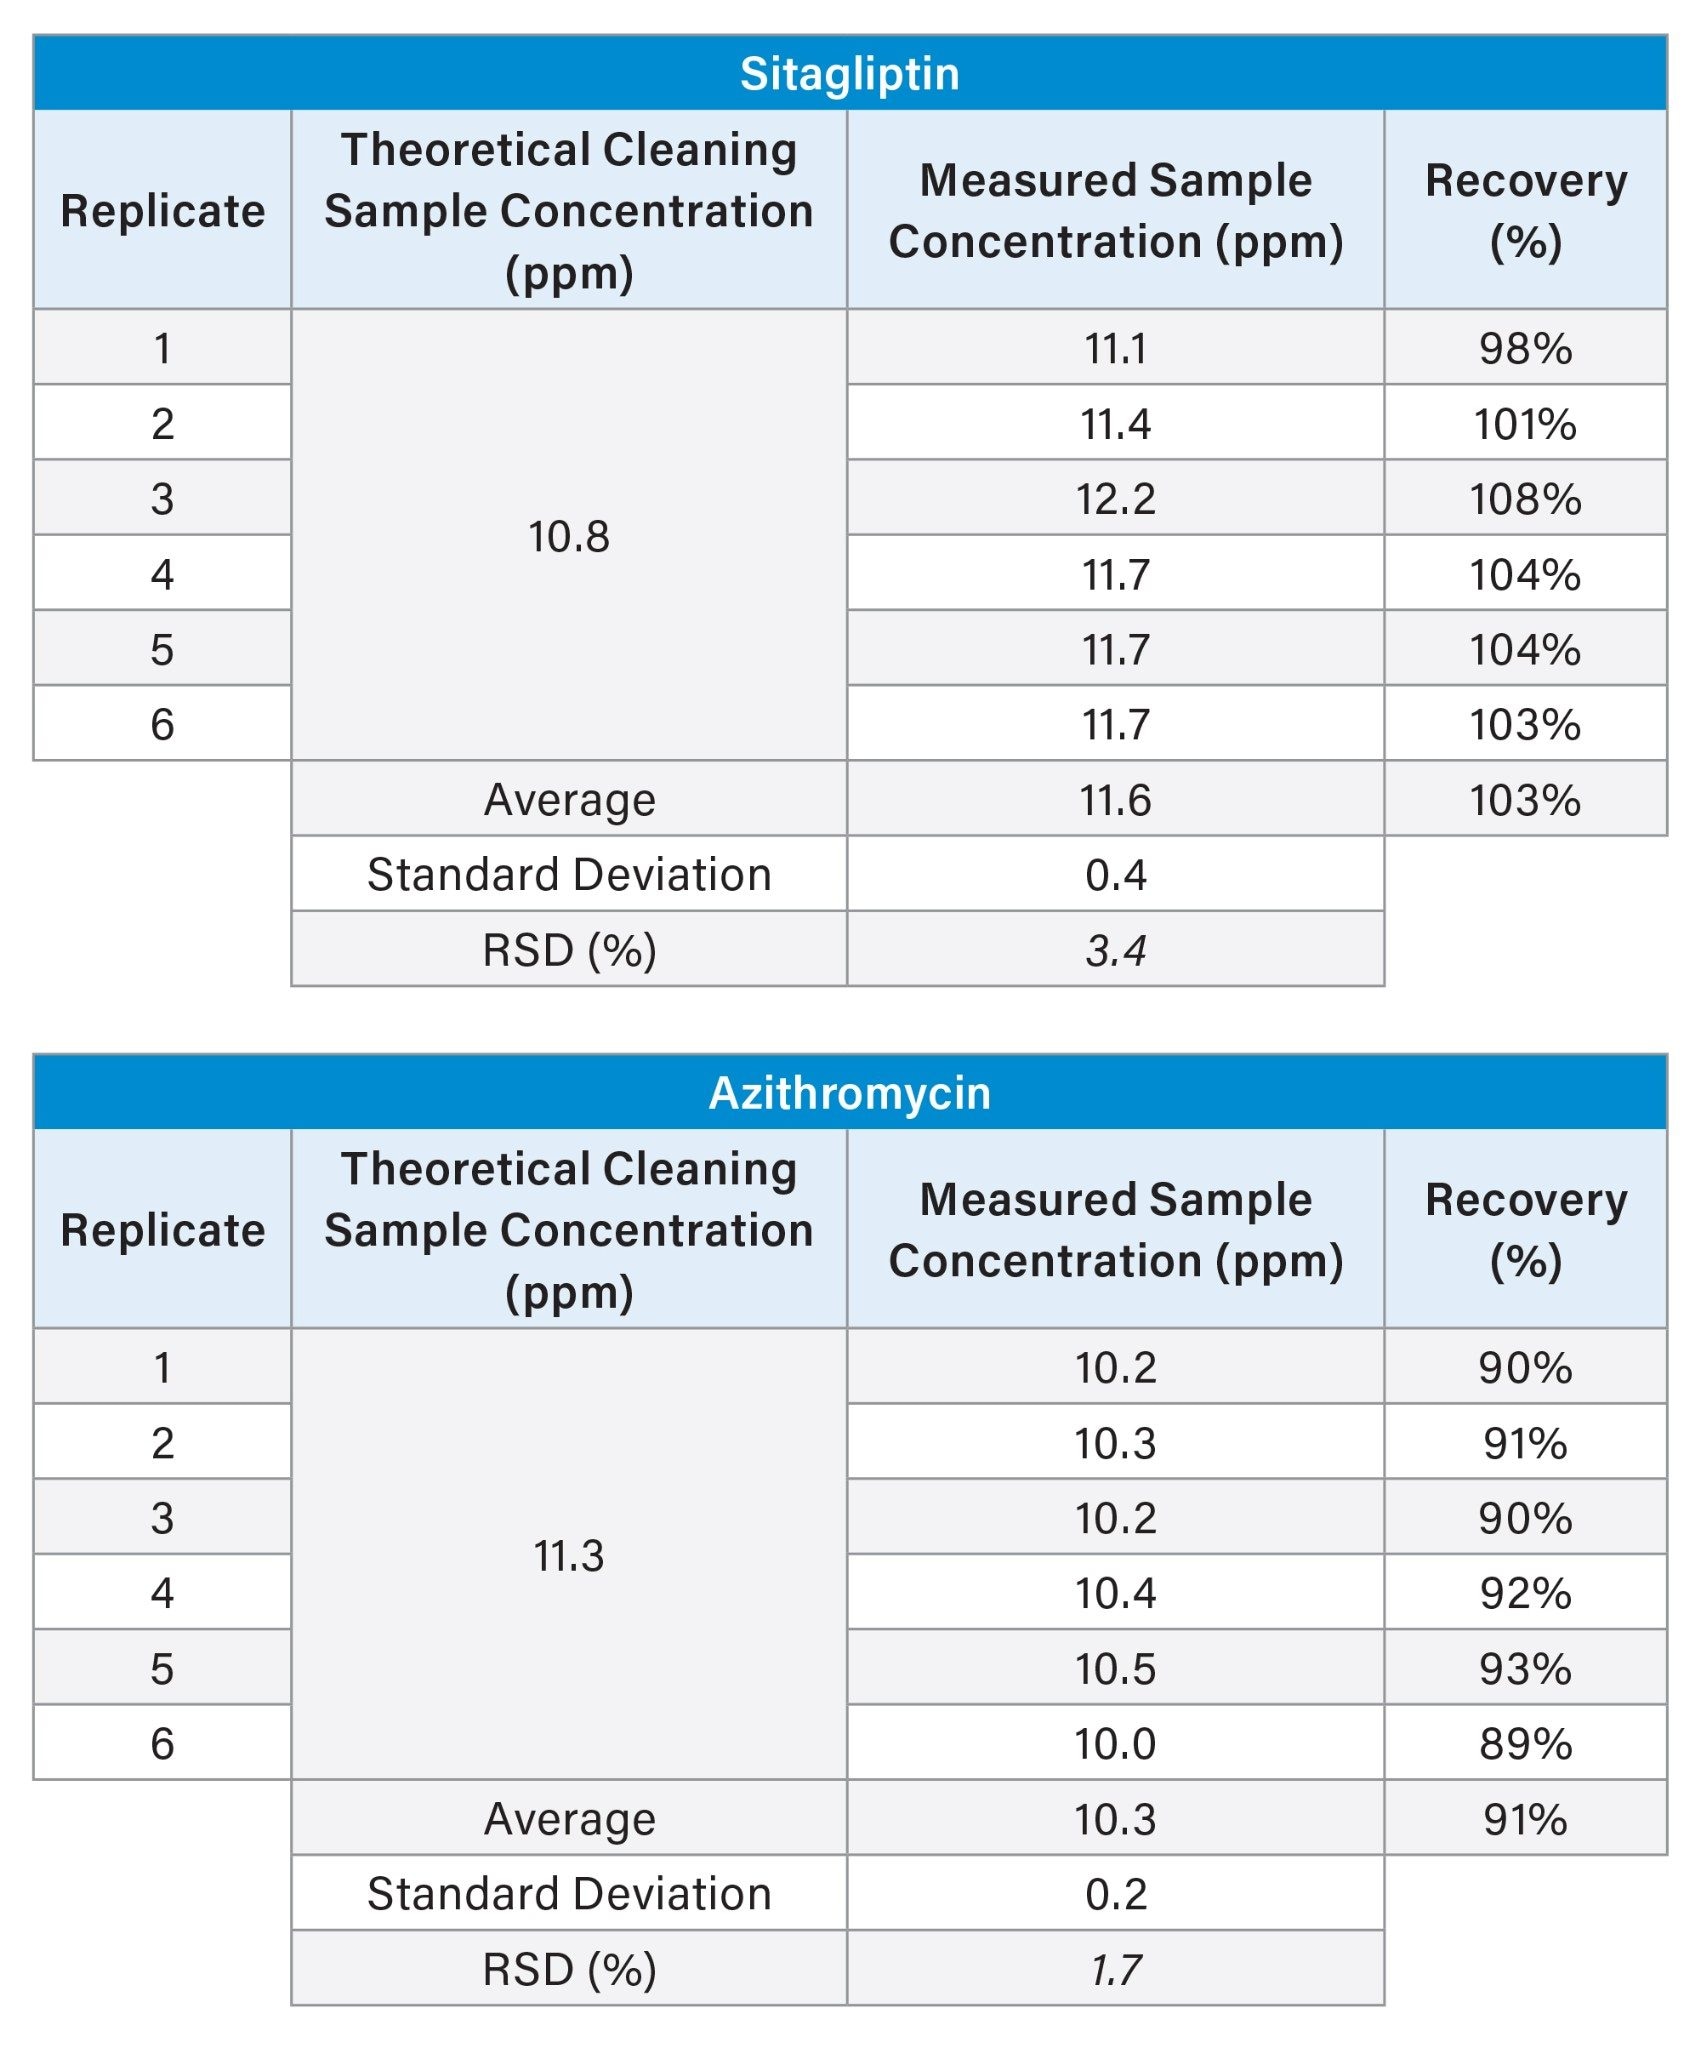
Sitagliptin and azithromycin were selected to evaluate measurement repeatability with the ACQUITY QDa II Mass Detector. For both analytes, six-replicate cleaning sample preparations were made by dilution of a single simulated cleaning sample (~11 ug/mL) and injected. The results are displayed in Table 6. In both cases, good measurement precision was observed indicating a stable response from the ACQUITY QDa II Mass Detector.
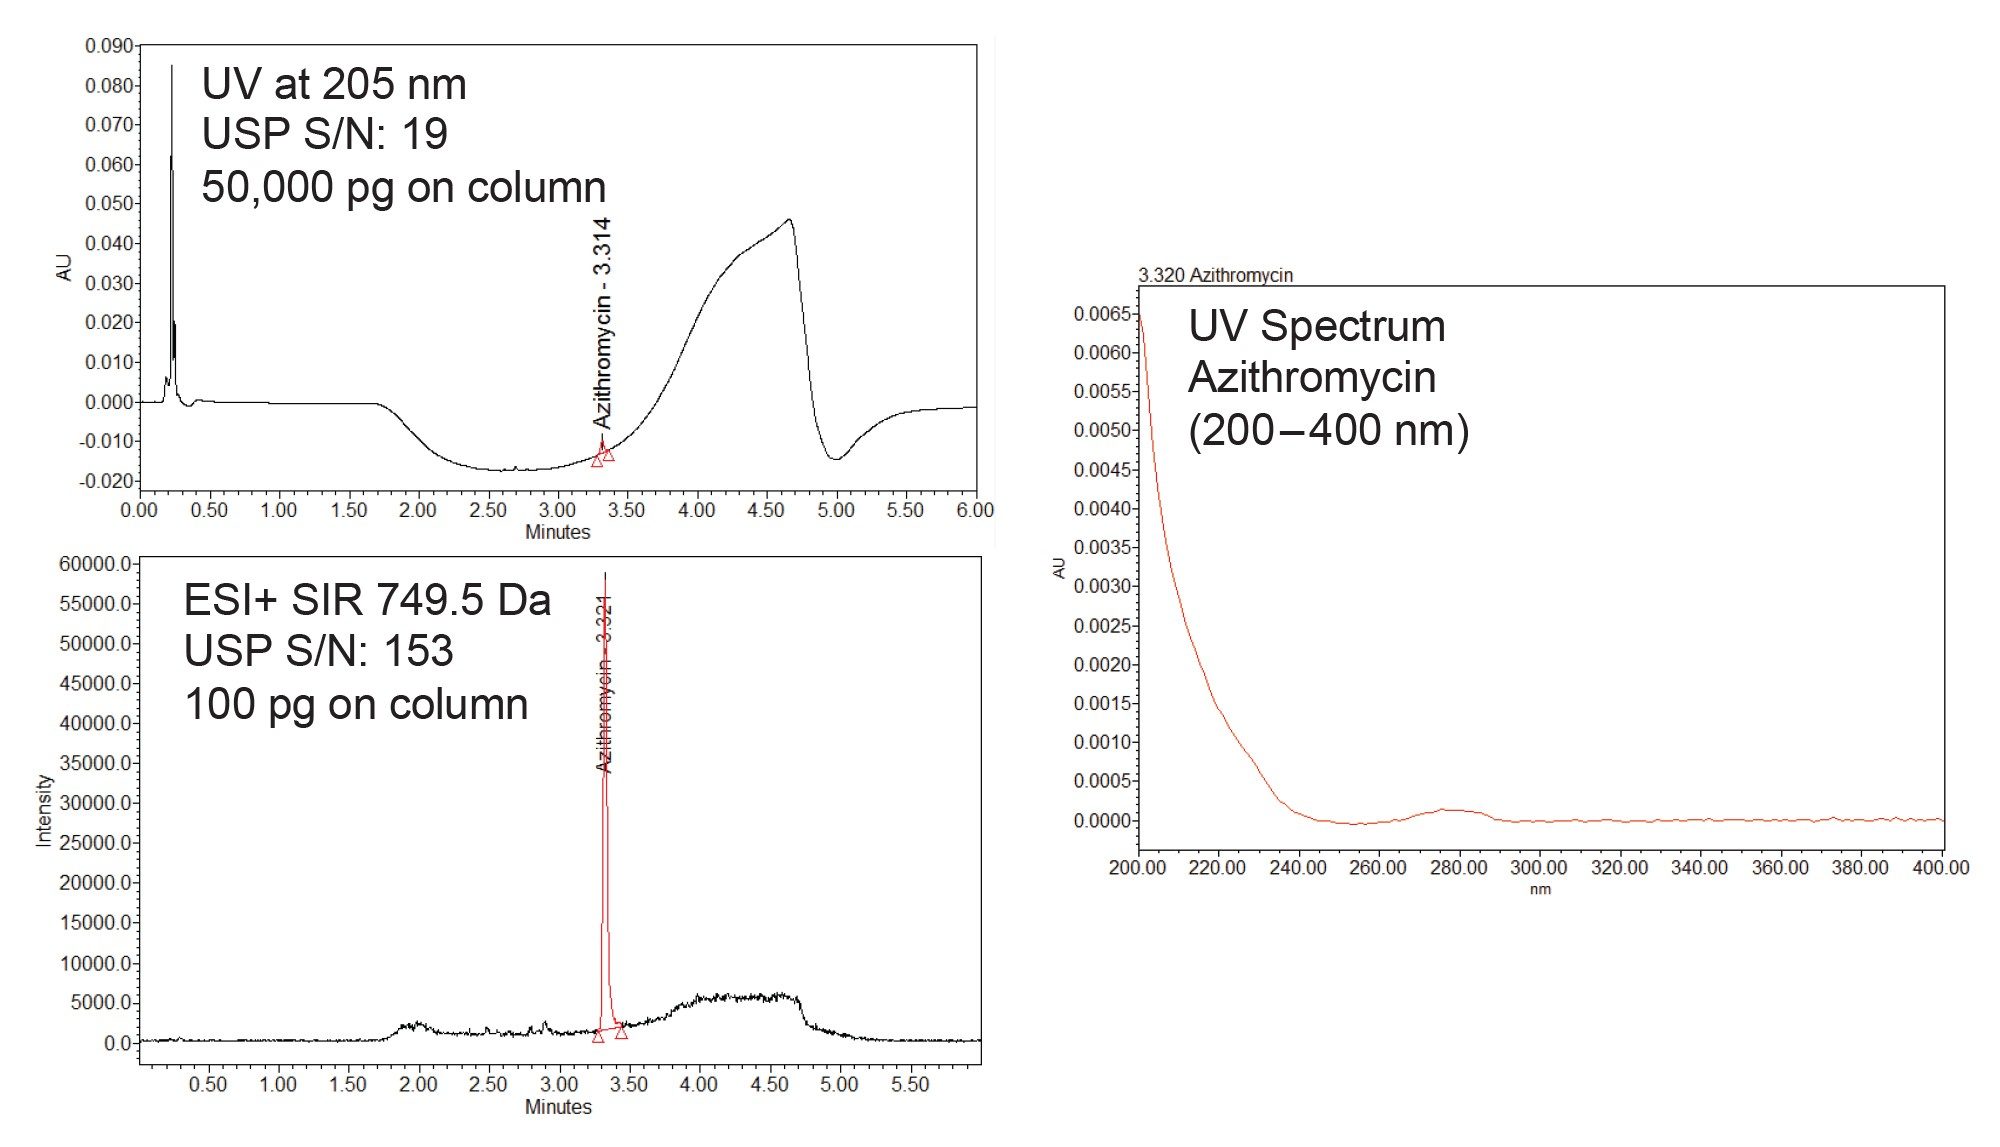
It should be noted that for many of the compounds in this experiment, assays based on UV detection would be much more challenging to develop and, in some cases, would likely incur higher risk of routine system suitability test (SST) failures. For example, Figure 5 shows the considerable increase in USP S/N when switching from UV detection to SIR mass detection for azithromycin. While the development of a UV assay may be possible for azithromycin, the UV spectrum does not support robust quantitative analysis across the 200-400 nm range due to the absence of a distinct and reliable λmax. Furthermore, Figure 5 demonstrates that the baseline drift commonly observed in gradient methods for UV based assays, which can challenge sensitivity, is typically far less significant in SIR mass detection. This is because UV detection measures the overall optical properties of the mobile phase, which vary throughout the gradient, whereas SIR mass detection is highly selective for the target m/z and is therefore much less influenced by changes in eluent composition during the gradient.
Conclusion
In this application note, analytical cleaning methods were developed and applied for a diverse range of small molecule APIs using the ACQUITY QDa II Mass Detector operating in single ion recording mode.
Compared with UV-based approaches, mass detection offers enhanced selectivity and sensitivity, reducing reliance on complete chromatographic separation and helping to overcome challenges associated with baseline drift and limited UV response observed for poor chromophores. This was clearly demonstrated in the comparison of the UV and SIR chromatograms generated for azithromycin, where mass detection provided reduced baseline drift and superior USP S/N with much lower sample loading.
Excellent linearity, accuracy, and precision were achieved for all compounds investigated, supporting reliable quantification of cleaning residues at levels relevant to routine cleaning verification (~1-10 ppm). Such robust analytical performance enables confident assessment of cleaning effectiveness, helping manufacturers maintain patient safety by minimizing the risk of residue carryover while also reducing the risk of unnecessary investigations, re-cleaning activities, and production downtime.
By combining selective mass detection with Empower 3 CDS reporting, this workflow strengthens confidence in routine cleaning verification results and supports faster, more reliable decision-making in GMP manufacturing environments.
References
- European Medicines Agency, Guideline on Setting Health-based Exposure Limits for Use in Risk Identification in the Manufacture of Different Medicinal Products in Shared Facilities, EMA/CHMP/ CVMP/ SWP/169430/2012, 20 November 2014
- International Council for Harmonisation (ICH), Guideline on Impurities: Guideline for Residual Solvents, Q3c (R9), Step 5 version, 5 April 2024, https://www.ich.org/page/quality-guidelines
- Garcı́a, M.C.; Hogenboom, A.C.; Zappey, H.; Irth, H. Effect of the Mobile Phase Composition on the Separation and Detection of Intact Proteins by Reversed-phase Liquid Chromatography–Electrospray Mass Spectrometry. Journal of Chromatography A. 2002;957(2):187-99.
https://www.sciencedirect.com/science/article/pii/S002196730200345X#cited-by - ACQUITY QDa II Mass Detector – Starting Point Settings and Optimization Guidelines 715009274 Ver. 00, Waters Corporation, 2024
720009596, September 2026


