
Quantitation of N-Nitroso-Desmethyl-Diltiazem, an NDSRI Impurity of Diltiazem Hydrochloride in Drug Product Using LC-MS/MS
Pavan Kukkadapua, Marian Twohigb, Padmakar Wagha
a Waters Corporation, Bangalore, India
b Waters Corporation, Milford, United States
Published on August 19, 2026

Abstract
Since 2018, N-nitrosamines have been a critical pharmaceutical safety concern. Due to their potential mutagenic and carcinogenic properties, regulatory authorities have introduced evolving guidance starting in 2020 mandating risk assessment, control strategies, and analytical monitoring for these impurities.
N-nitroso-desmethyl-diltiazem (NDD), a nitrosamine drug substance-related impurity (NDSRI) that may form in diltiazem hydrochloride drug products, requires sensitive analytical control to meet regulatory expectations for nitrosamine risk management.
A highly sensitive UPLC-ESI-MS/MS method using a Xevo™ TQ S micro Mass Spectrometer was developed for the quantitation of NDD in diltiazem tablet formulations, achieving sensitivity that exceeds current regulatory requirements. Method performance was evaluated against both historical and current regulatory thresholds, including the previously stringent specification of 0.05 ppm (with a 10% limit of quantitation (LOQ) target of 0.005 ppm) and the more recent limit of 0.185 ppm (10% threshold of 0.0185 ppm) based on updated AI values.
The method was linear (R² > 0.999) over the range tested, 0.01-10 ng/mL with spike recoveries of 90.7-106.6%, providing a reliable approach for monitoring NDD and supporting the safety and quality of diltiazem drug products.
Benefits
- Trace level detection of N-nitroso-desmethyl-diltiazem using the Xevo TQ-S micro Tandem Quadrupole Mass Spectrometer exceeds the industry guidelines of 10% of the regulatory AI threshold.
- Chromatographic resolution between diltiazem API and N-nitroso-desmethyl-diltiazem isomers for accurate quantification of the impurities.
- A complete workflow demonstrating the quantitative analysis of N-nitroso-desmethyl-diltiazem isomeric impurities in final drug dosage form at the regulatory set limits.
- waters_connect™ for Quantitation Software offers compliant-ready workflows for the acquisition, processing, review, and reporting of quantitative data for N-nitrosamines.
Introduction
N-nitrosamines (nitrosamines) have been a major pharmaceutical safety concern since 2018, beginning with small molecule dialkyl nitrosamines such as N-Nitrosodimethylamine (NDMA) and N-Nitrosodiethylamine (NDEA) and later expanding to include Nitrosamine drug substance related impurities (NDSRIs).1-3 NDSRIs, a term used to indicate the structural relationships between active pharmaceutical ingredients (API) and nitrosated impurities, have been detected in multiple drug products.4,5 Nitrosamines can be potentially mutagenic and carcinogenic.6 Therefore, nitrosamine impurities that have been identified by regulatory authorities as requiring risk‑based assessment and control within pharmaceutical products.
Regulatory guidance for assessing pharmaceutical products for nitrosamine impurities was first issued in 2020 and has been revised multiple times as scientific understanding has advanced. This guidance includes risk assessment, establishing acceptable limits for N-nitrosamine impurities, testing and monitoring of pharmaceutical products and mitigation strategies by pharmaceutical manufacturers.7-11
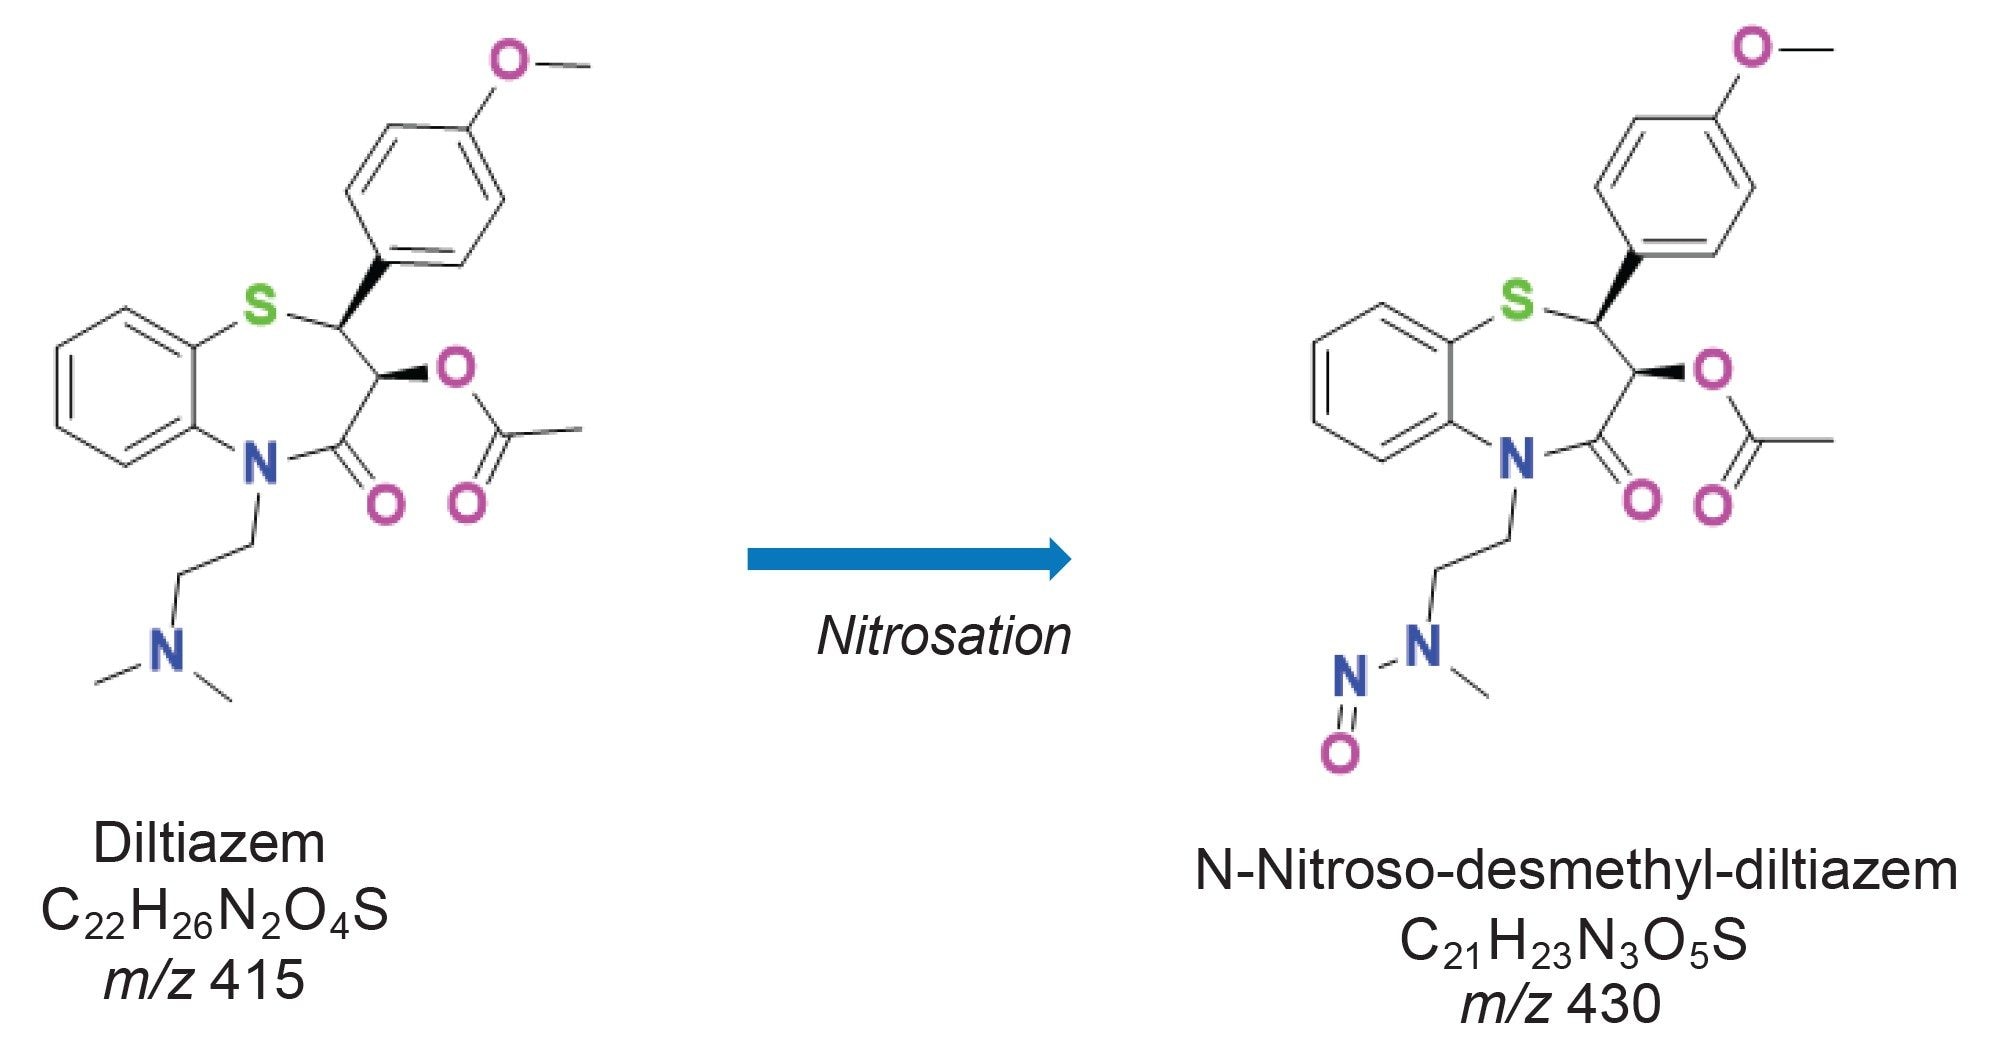
Diltiazem hydrochloride is a widely used benzothiazepine Ca2+ blocking drug (calcium channel blockers). Clinically, it is used to treat cardiovascular diseases such as angina pectoris, hypertension, and cardiacarrhythmias.12 N-nitroso-desmethyl-diltiazem (Figure 1) is an NDSRI impurity derived from diltiazem hydrochloride (Figure 1). Consequently, monitoring of NDD is required during drug formulation. To avoid the need for onwards batch release testing in QC, analytical methods used for the detection of nitrosamines, including NDSRIs, are required to demonstrate the absence of impurities at a lower LOQ of 10% of the limit derived from the acceptable intake (AI) and the API maximum daily dose (MDD). Assuming a MDD of diltiazem of 540 mg, the developed assay exceeded the regulatory requirements for the quantitation of NDD. The AI for NDD was amended to 100 ng/day (using read across from a surrogate [4-(methylnitrosoamino)-1-(3-pyridinyl)-1-butanone (NNK)]).13 For this study, the method was developed when the regulations for this impurity were more stringent, using a threshold limit of 0.05 ppm (ppm = AI (ng)/MDD (mg); 26.5 ng /540 mg), with a 10% threshold of 0.005 ppm. The current regulatory threshold for NDD, based on an AI of 100 ng/day is calculated to be 0.185 ppm (10% threshold of 0.0185 ppm).
This study describes the analysis of NDD in final dosage form (FDF) tablet using ultra-performance liquid chromatography (UPLC™) with electrospray ionisation (ESI) and a Xevo TQ-S micro Tandem Quadrupole Mass Spectrometer.
Experimental
LC Method and Conditions
|
LC system: |
ACQUITY™ UPLC H-Class Plus System |
|
Detection: |
ACQUITY Photodiode Array (PDA) Detector |
|
Solvent manager: |
Quaternary Solvent Manager |
|
Sample manager: |
Sample Manager with Flow-Through Needle (FTN) |
|
Mobile phase A: |
0.1% Acetic Acid in LC/MS Grade Water |
|
Mobile phase B: |
LC/MS Grade Acetonitrile |
|
Column: |
Waters ACQUITY UPLC HSS T3 Column, 1.8 µm, 3.0 x 100 mm |
|
Purge solution: |
Methanol:IPA:acetonitrile:water (25:25:25:25) |
|
Wash solution: |
Methanol:IPA:acetonitrile:water (25:25:25:25) |
|
Seal wash: |
Methanol: water (5:95) |
|
Inj. volume: |
2.0 µL |
|
Sample temperature: |
10 °C |
|
Column temperature: |
45 °C |
Table 1. LC Conditions
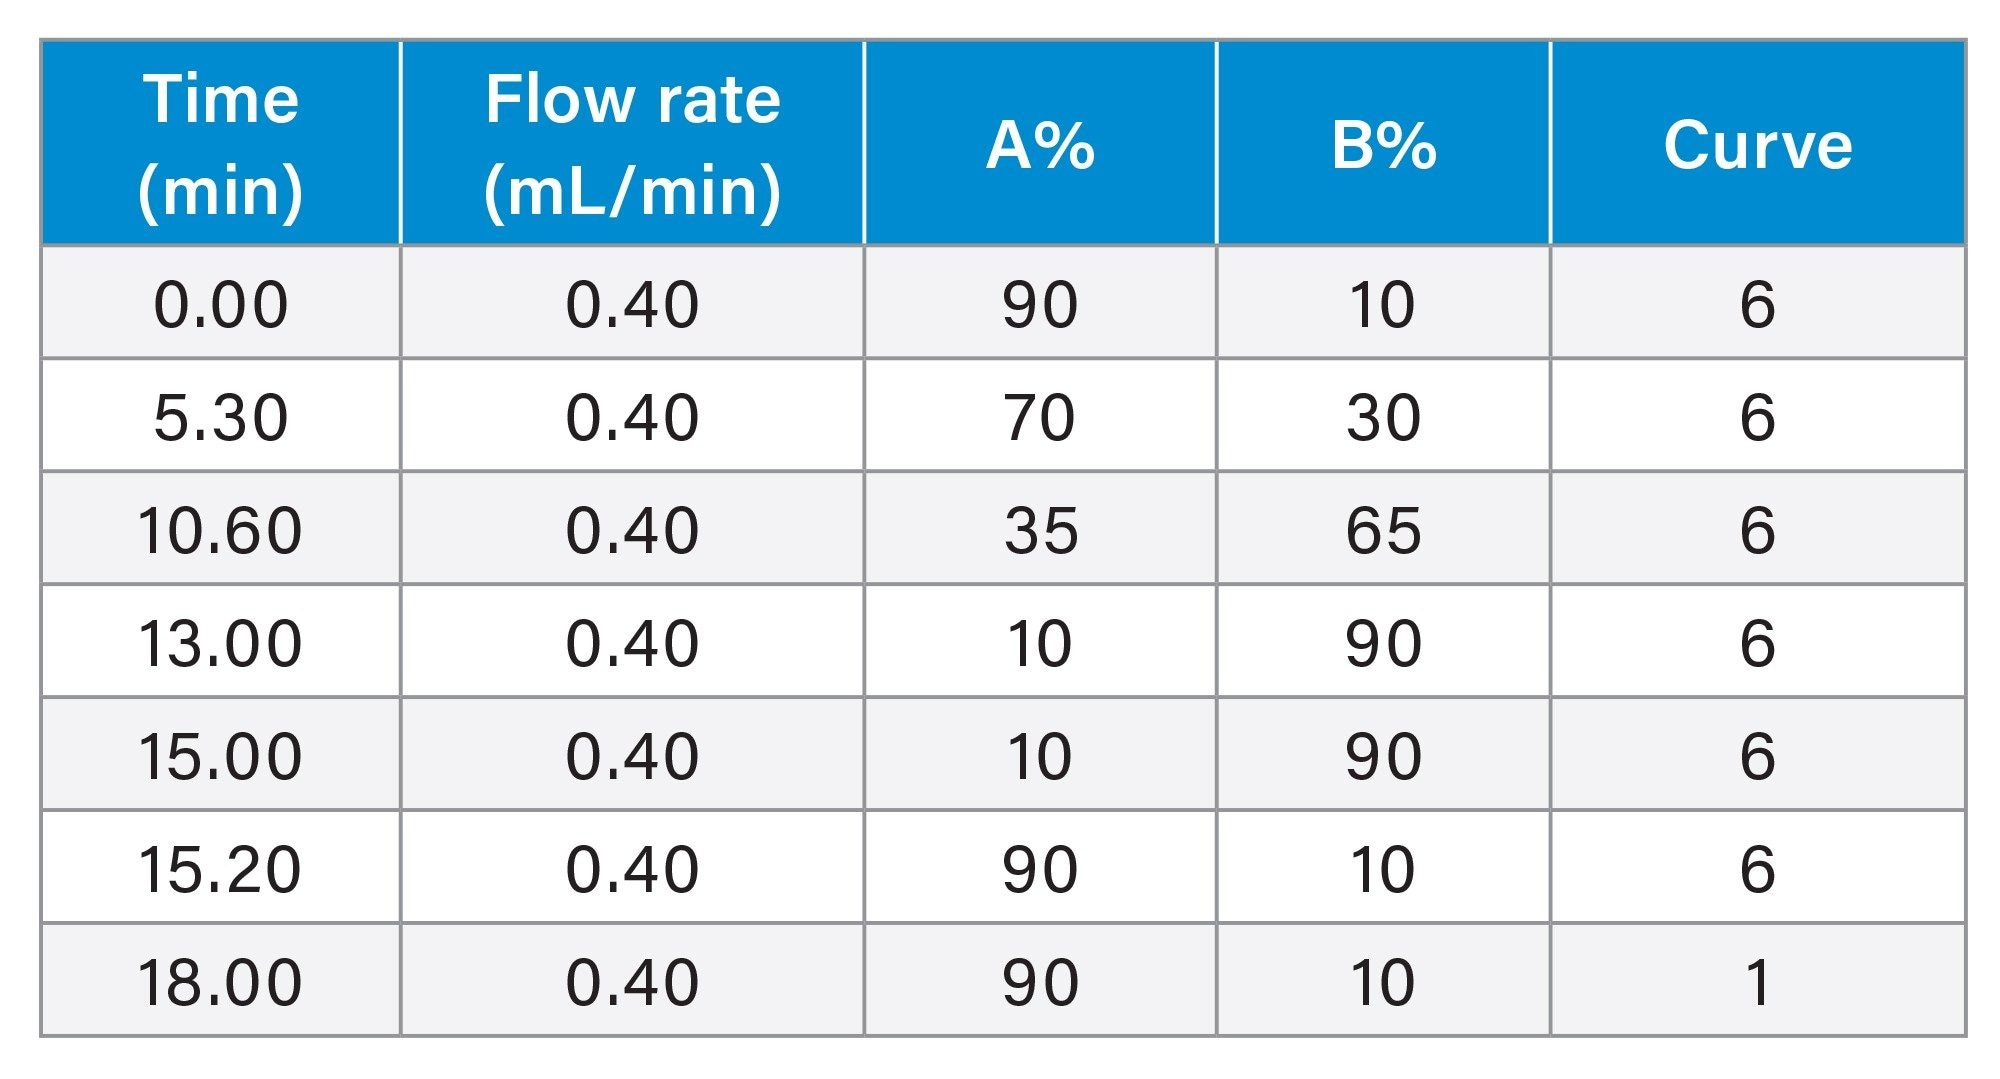
LC/MS grade solvents and acetic acid were used to prepare the mobile phases (Table 1). The gradient program is shown in Table 2.
MS Method and Parameters
|
Ionisation mode: |
Electrospray Positive |
|
Capillary voltage : |
2.50 kV |
|
Cone voltage (V): |
Table 4 |
|
Collision energy (eV): |
Table 4 |
|
Source temp.: |
150 °C |
|
Desolvation temp. : |
500 °C |
|
Cone gas flow : |
50 L/hr |
|
Desolvation gas flow : |
1000 L/hr |
Table 3. MS Conditions

A Xevo TQ-S micro Tandem Quadrupole Mass Spectrometer was used to acquire data (Table 3). Compound optimization, MRM method generation, data acquisition, quantification method generation, and data processing were managed using waters_connect for Quantitation Software (Table 4).
Sample Preparation
A primary stock solution of an authentic standard of NDD (Figure 1) was prepared. The NDD stock solution was sequentially diluted to create a calibration curve ranging from 0.01 ng/mL to 10 ng/mL.
The drug product sample was prepared using 120 mg finished drug product tablet samples. The tablet sample was finely crushed using a mortar and pestle and made up to a concentration of 40 mg/mL. The resulting solution was vortexed for 3 minutes and centrifuged at 3000 rcf. The supernatant was then filtered through a 0.20 µm PVDF syringe filter and transferred to an autosampler vial in preparation for analysis by LC-MS.
Threshold Level Spike Recovery Study
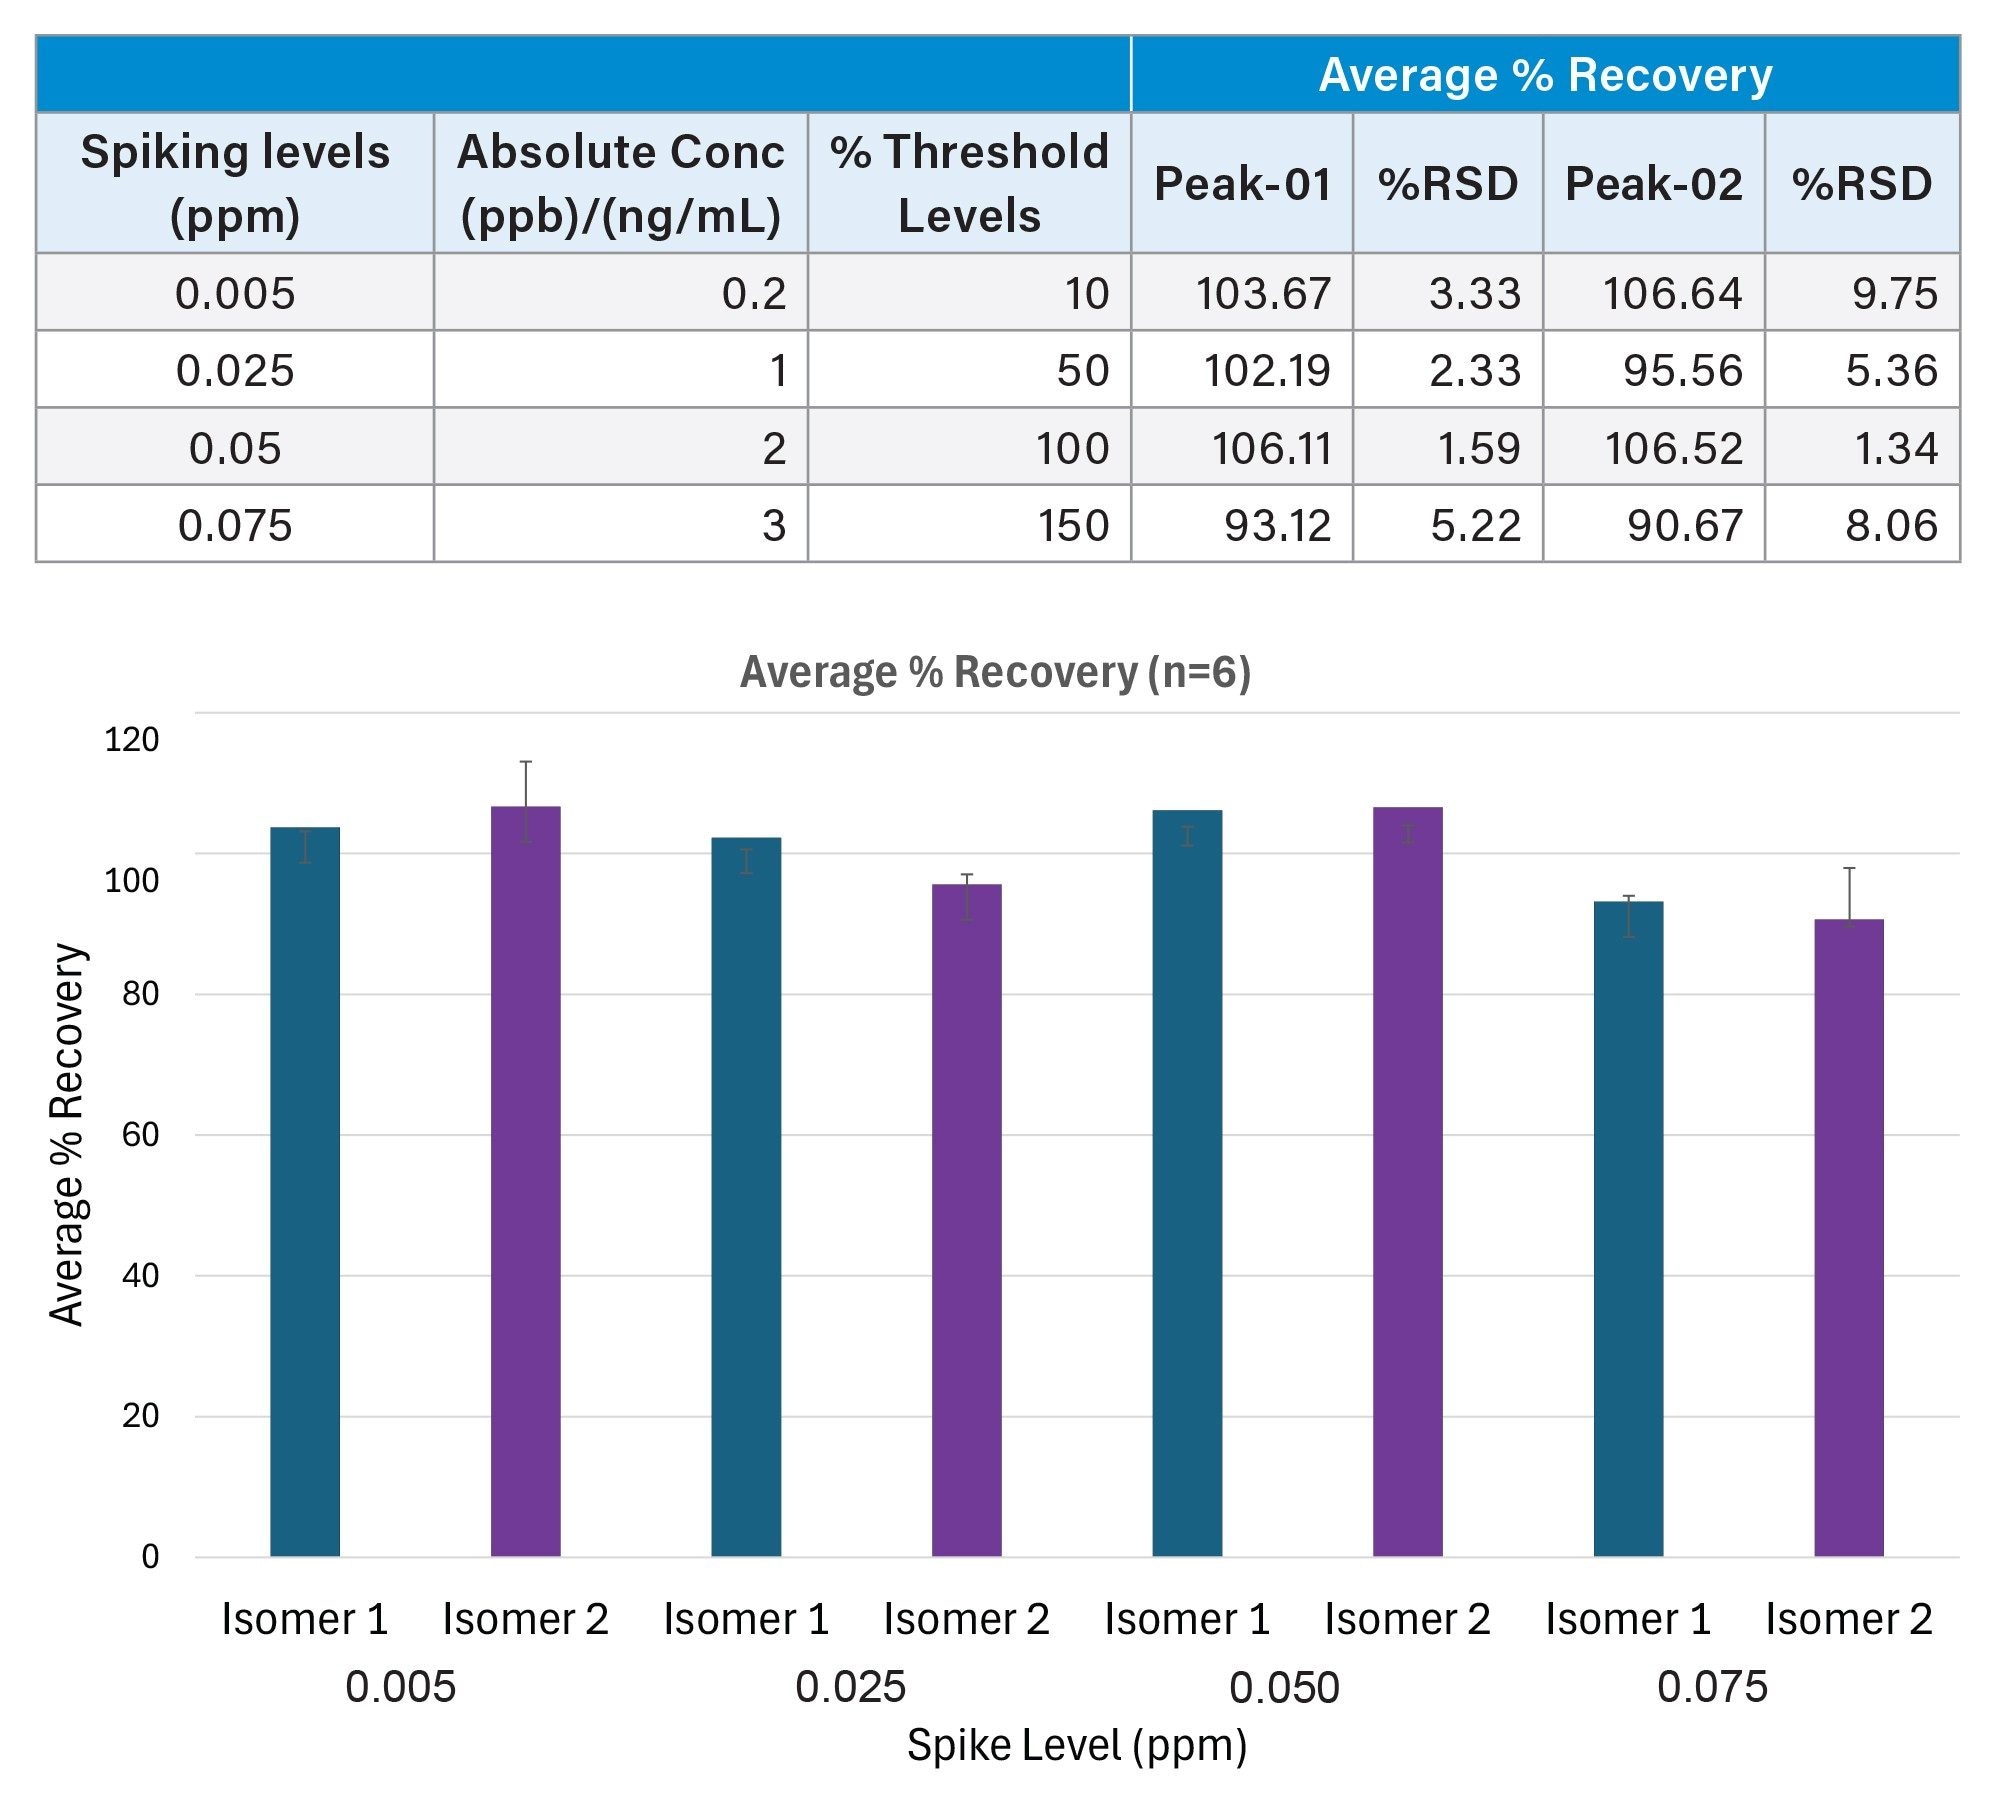
The spike recovery was studied at four concentration levels (Table 5) in the drug product tablet matrix prepared at 40 mg/mL.
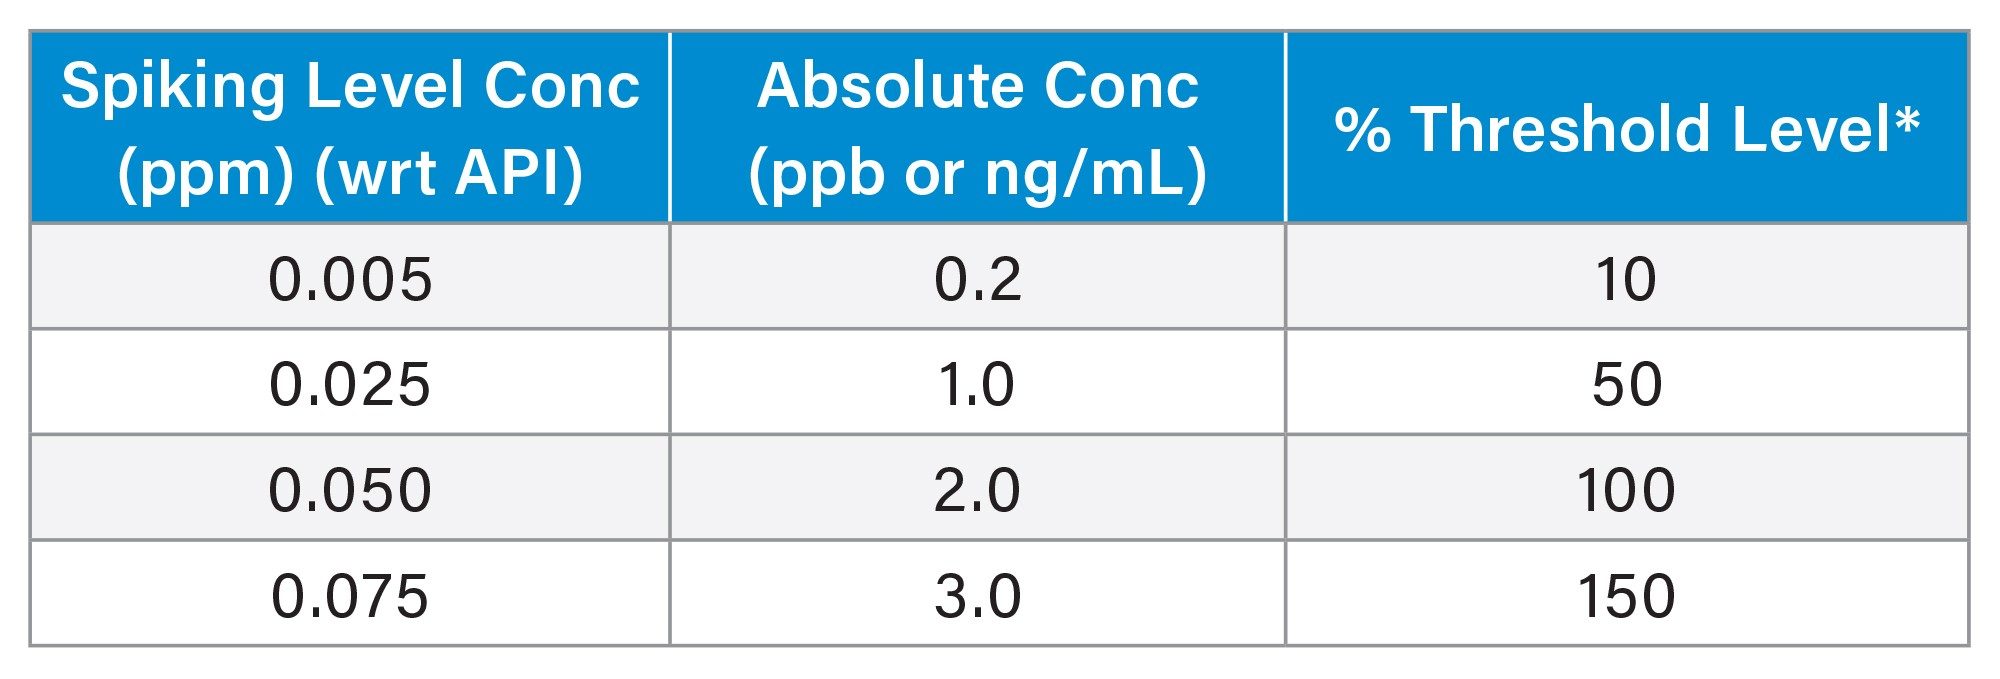
* Applies to previous more stringent regulations for NDD (AI of 26.5 ng/day, MDD 540 mg).
Table 5. N-nitroso-desmethyl-diltiazem spike level concentrations (ppm) with respect to the diltiazem API (40 mg/mL), absolute in vial concentrations (ng/mL or ppb) and the corresponding % threshold level (with respect to 0.05 ppm).
waters_connect Software
The waters_connect for Quantitation Software streamlined and simplified the individual steps required to develop an LC-MS method, including optimization of the MRM transitions with automatic generation of the MS acquisition method. The MS processing method is then created by transfer of the acquisition information (MRM transitions, tR) using a single function within the MS acquisition method. Data review is assisted by setting batch pass/fail criteria resulting in clear user alerts. The software supports 21 CFR Part 11 compliance by ensuring data integrity through secure access restrictions, electronic signatures and automated audit trails.
Results and Discussion
Chromatographic Separation and MS Optimization
Compound optimization was performed by infusing an authentic standard of the NDD into the MS source using the integrated MS fluidics, and MRM optimization tool. The optimization was then performed using the automatic tuning process within the waters_connect Software.
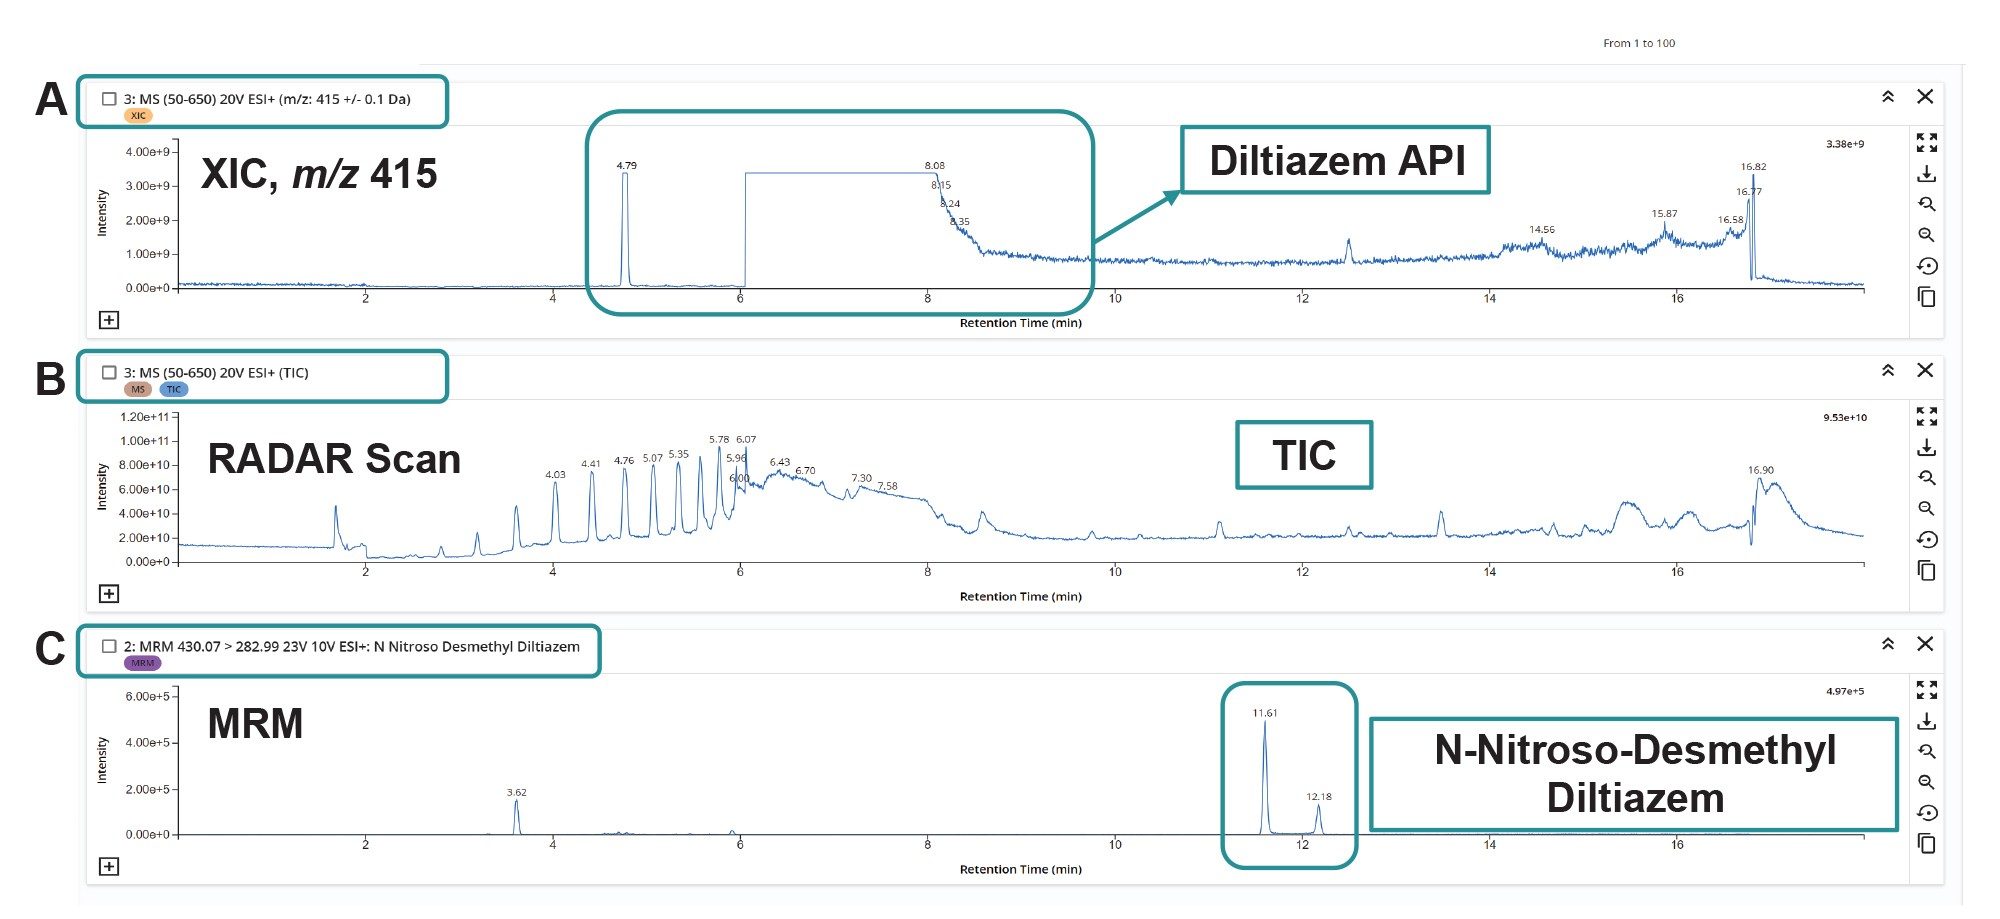
The degree of chromatographic resolution between the diltiazem (API) and NDD is important to avoid any potential matrix effects that could occur due to the proximity of the high levels of API present in the samples and ensure accurate quantification of the impurity. To determine the region of chromatographic elution of the diltiazem API, a PDA Detector at the relevant wavelength could be used, alternatively, using a dilute solution of the drug substance, a RADAR scan can be configured in the MS method. A RADAR scan is acquired simultaneously with the MRM channels providing additional qualitative information (Figure 2). In Figure 2, the [M+H]+ of diltiazem, m/z 415 has been extracted (XIC) from the RADAR scan that was collected simultaneously with the MRM data for the NDD impurity.
If higher concentrations of the drug product are used, it is important to divert the LC flow to the waste, to avoid saturation of the MS detector. The region of the API chromatographic elution, or any prominent excipients that could cause matrix effects can be diverted to waste using the integrated solvent divert valve. The divert valve is a component within the fluidics system of the mass spectrometer, operating to control the flow paths of fluids, allowing for precise switching between different operational modes such as infusion, waste, combined or LC flow which can be set within the acquisition method.
The diltiazem structure possesses two chiral centers, which gives rise to four possible stereoisomers; two enantiomeric pairs of diastereomers.14, 15 The chromatogram in Figure 2 shows the NDD isomers with retention times (tR) of 11.6 and 12.1 minutes. The reversed phase separation was performed on an ACQUITY UPLC HSS T3 Chromatography Column and provides baseline resolved separation between the diltiazem, API (tR 8.5 min) and the NDD isomers (Figure 2A and C).
Quantitative Method Development
The MS Quan Rule Set
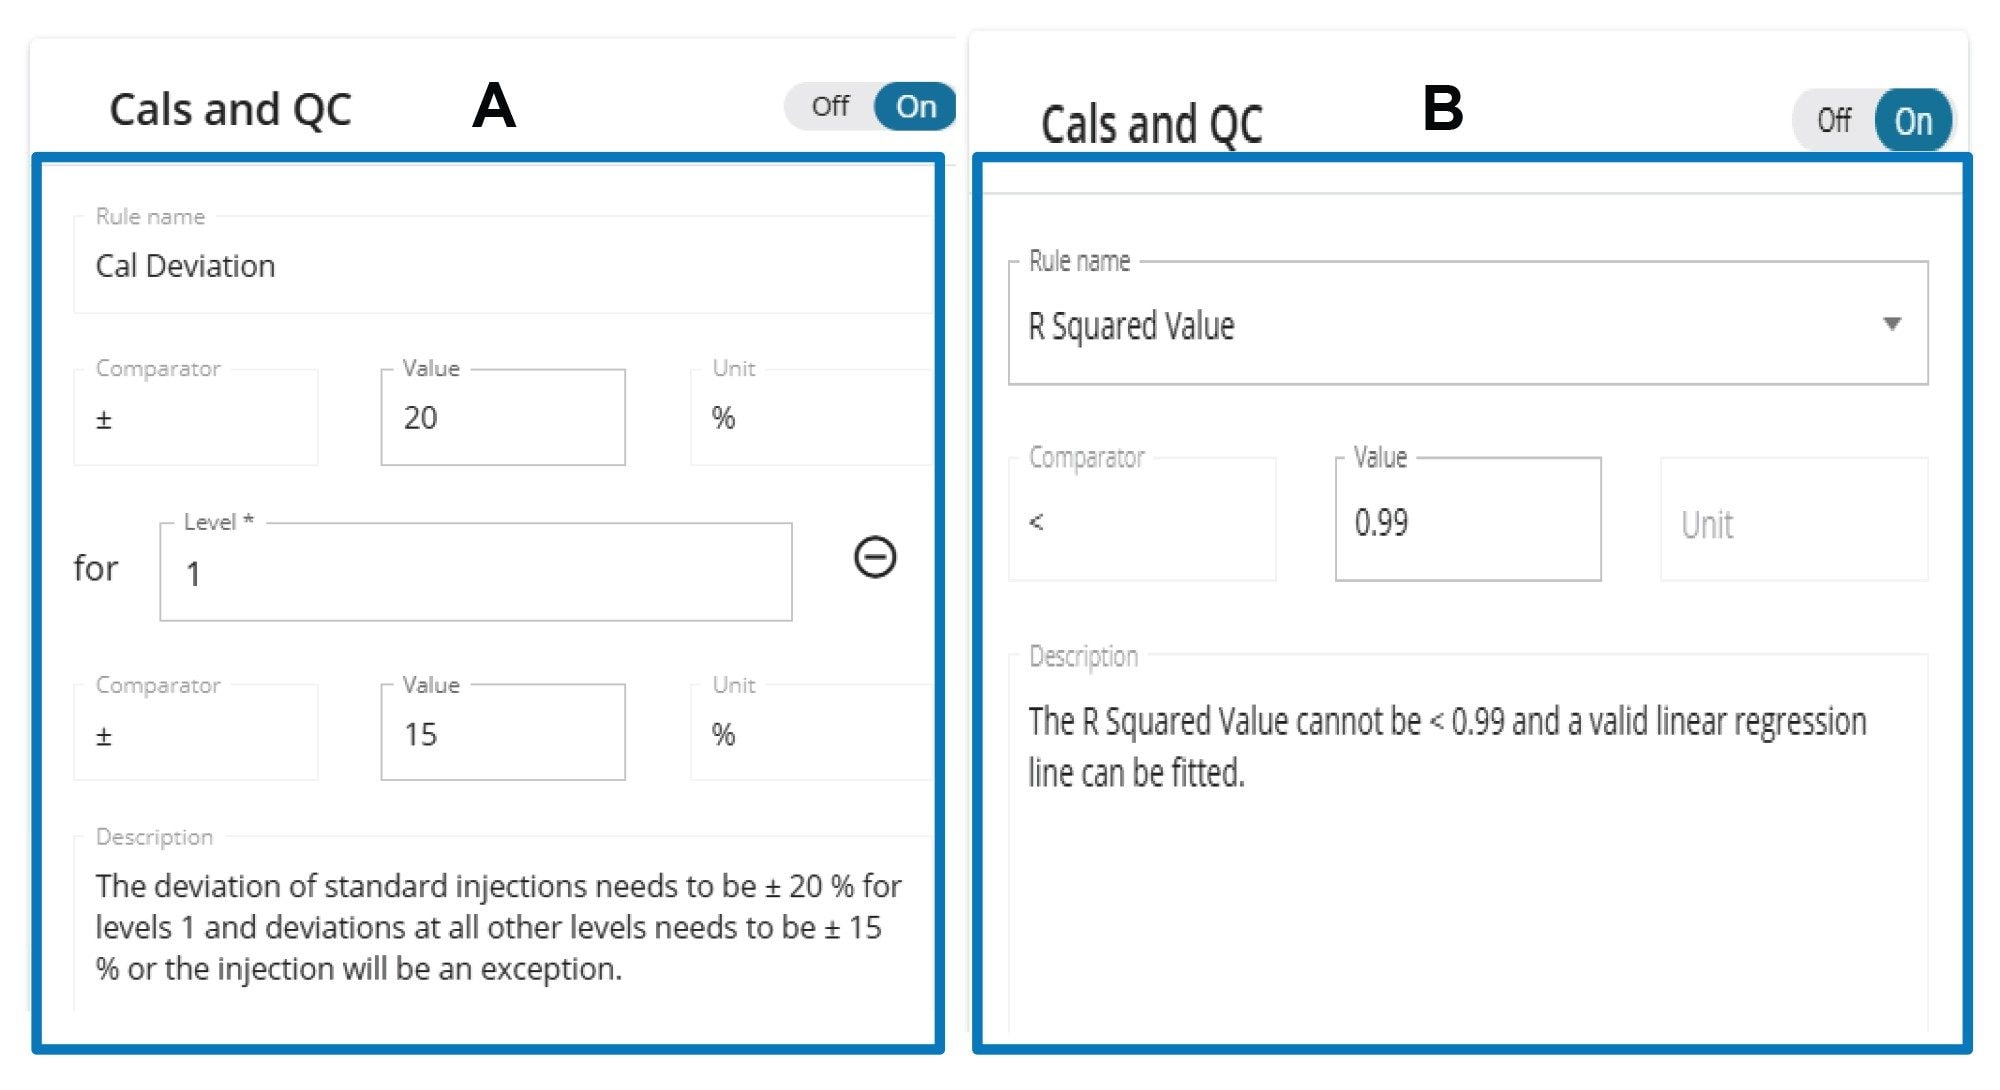
All quantitative data was processed and evaluated using MS Quan, an application within the waters_connect Software ecosystem. The data are presented in such a way to display exceptions to rules which are set in a “Rules Set” (Figure 3) in the processing method (i.e. concentration deviations must be <+/- 15%, R2 must be <0.99, etc.). This feature allows for faster interpretation and reporting of results as well as defining batch pass/fail criteria.
Linearity, Sensitivity, and Repeatability
The quantitative limits of the assay were initially established using standard solutions of the NDD impurity. A weighted least squares regression model with 1/x weighting was used to establish the analyte concentration and peak area relationships. No internal standards were used.
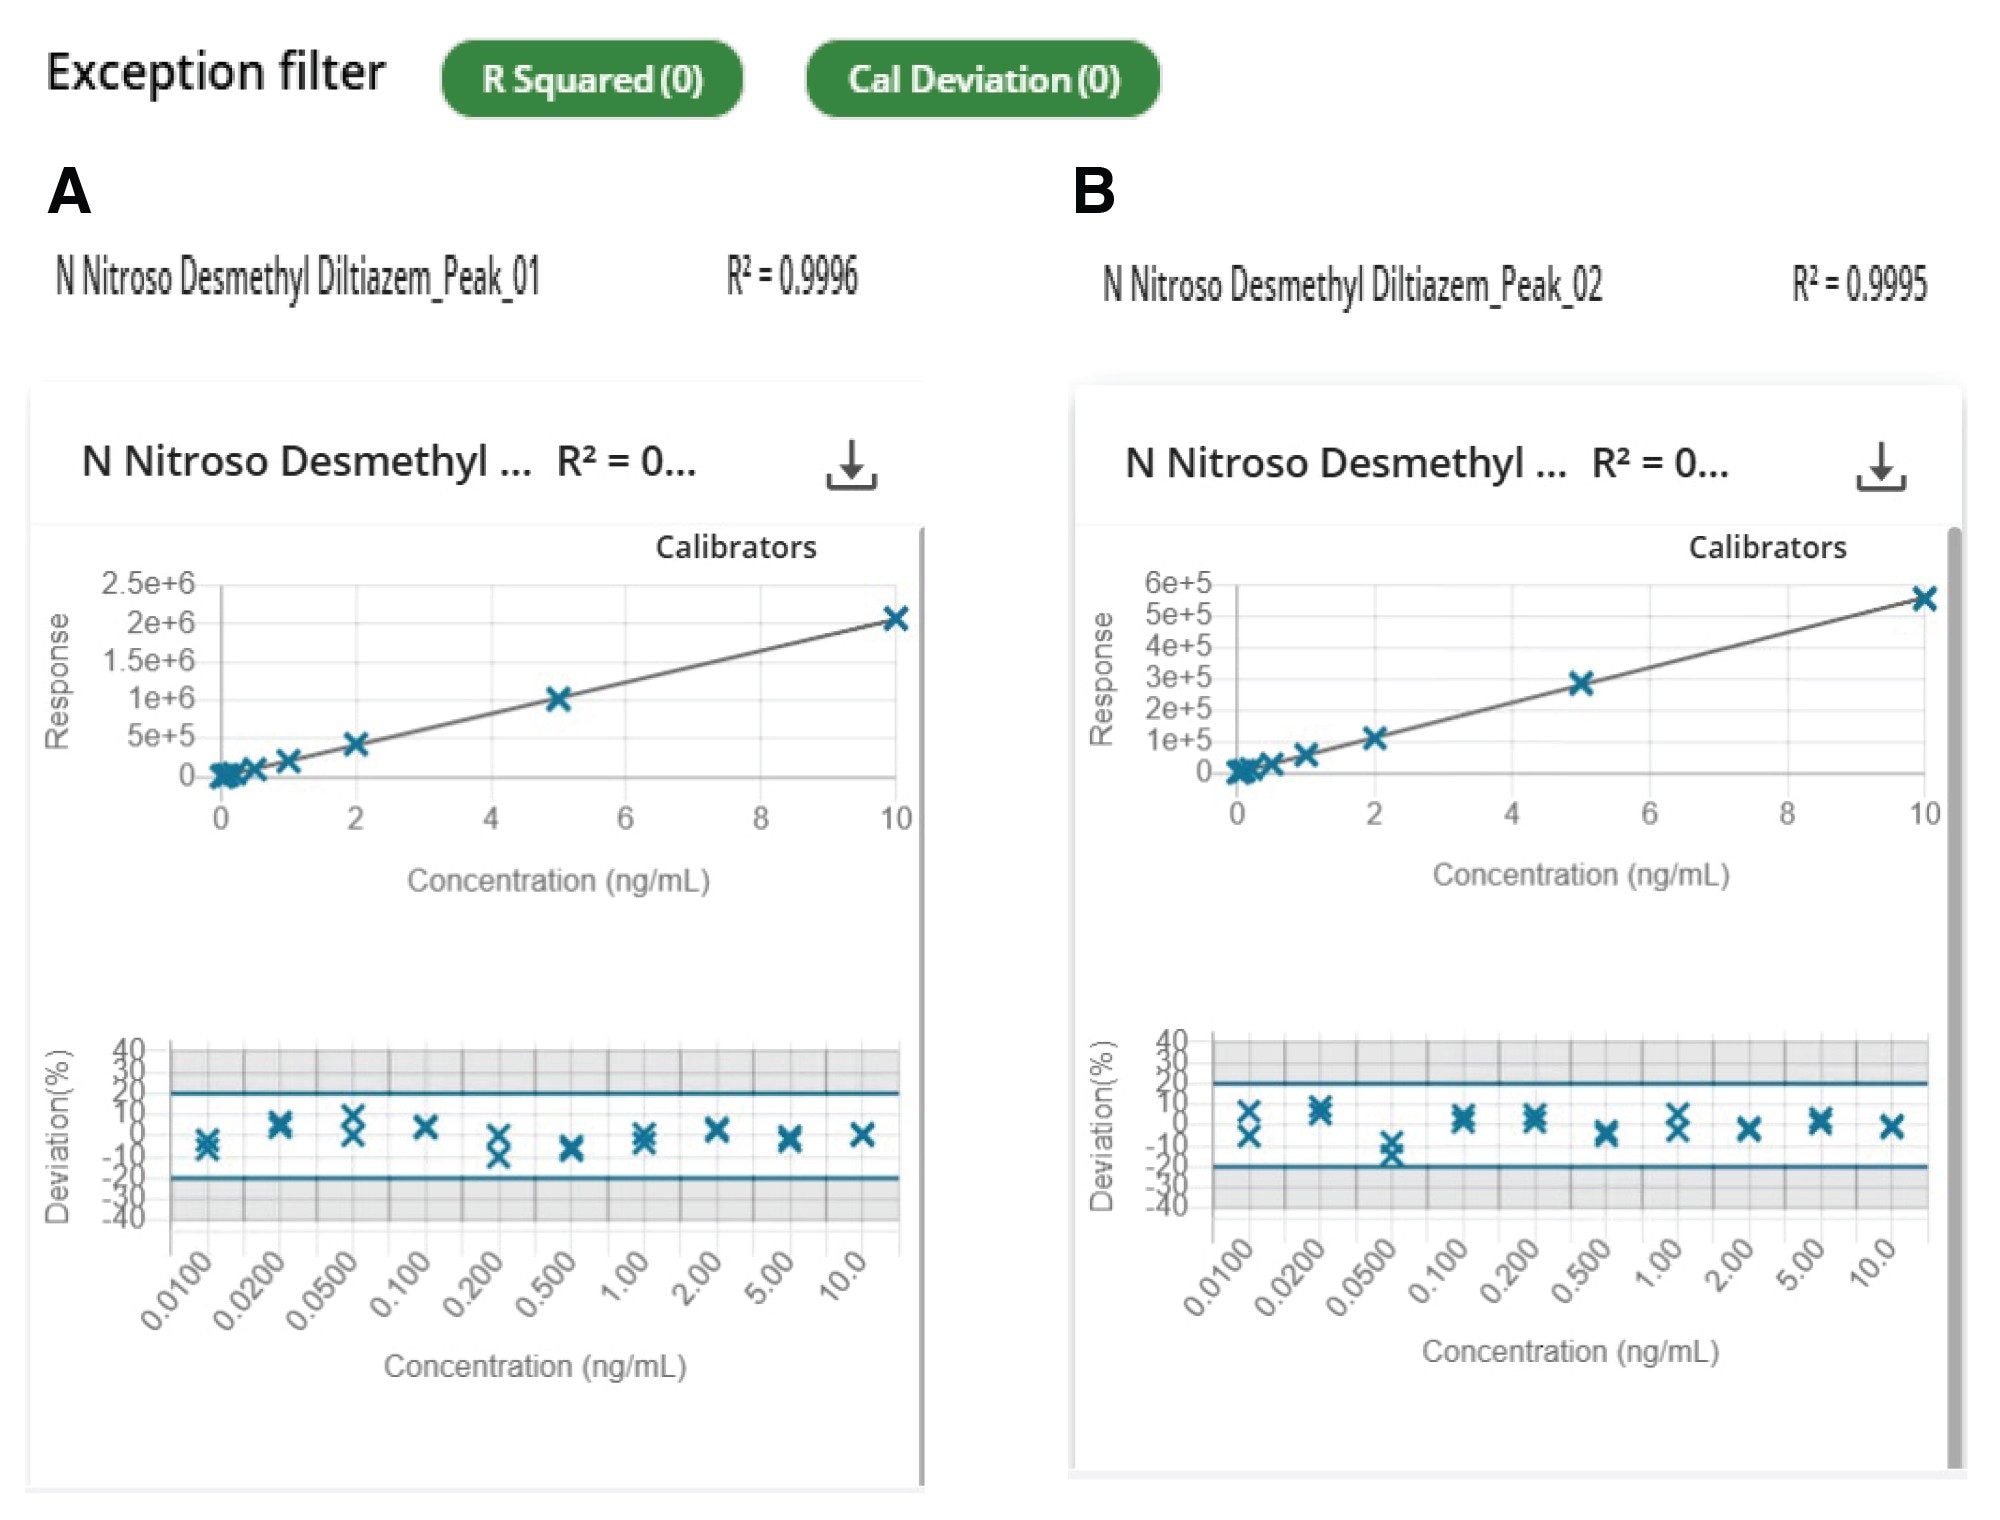
Figure 4A and B shows examples of the calibration curves (n = 2) for each impurity isomer plotted with 10 calibration points over the range 0.01-10 ng/ml in (R2 > 0.999, 1/x weighting) demonstrating at least three orders of linear dynamic range. The Exception filters indicated by the green labels on the top of the curve describe the parameters of the batch that have passed (R2, Concentration Deviation, QC Deviation and Signal-to-noise).
Sensitivity
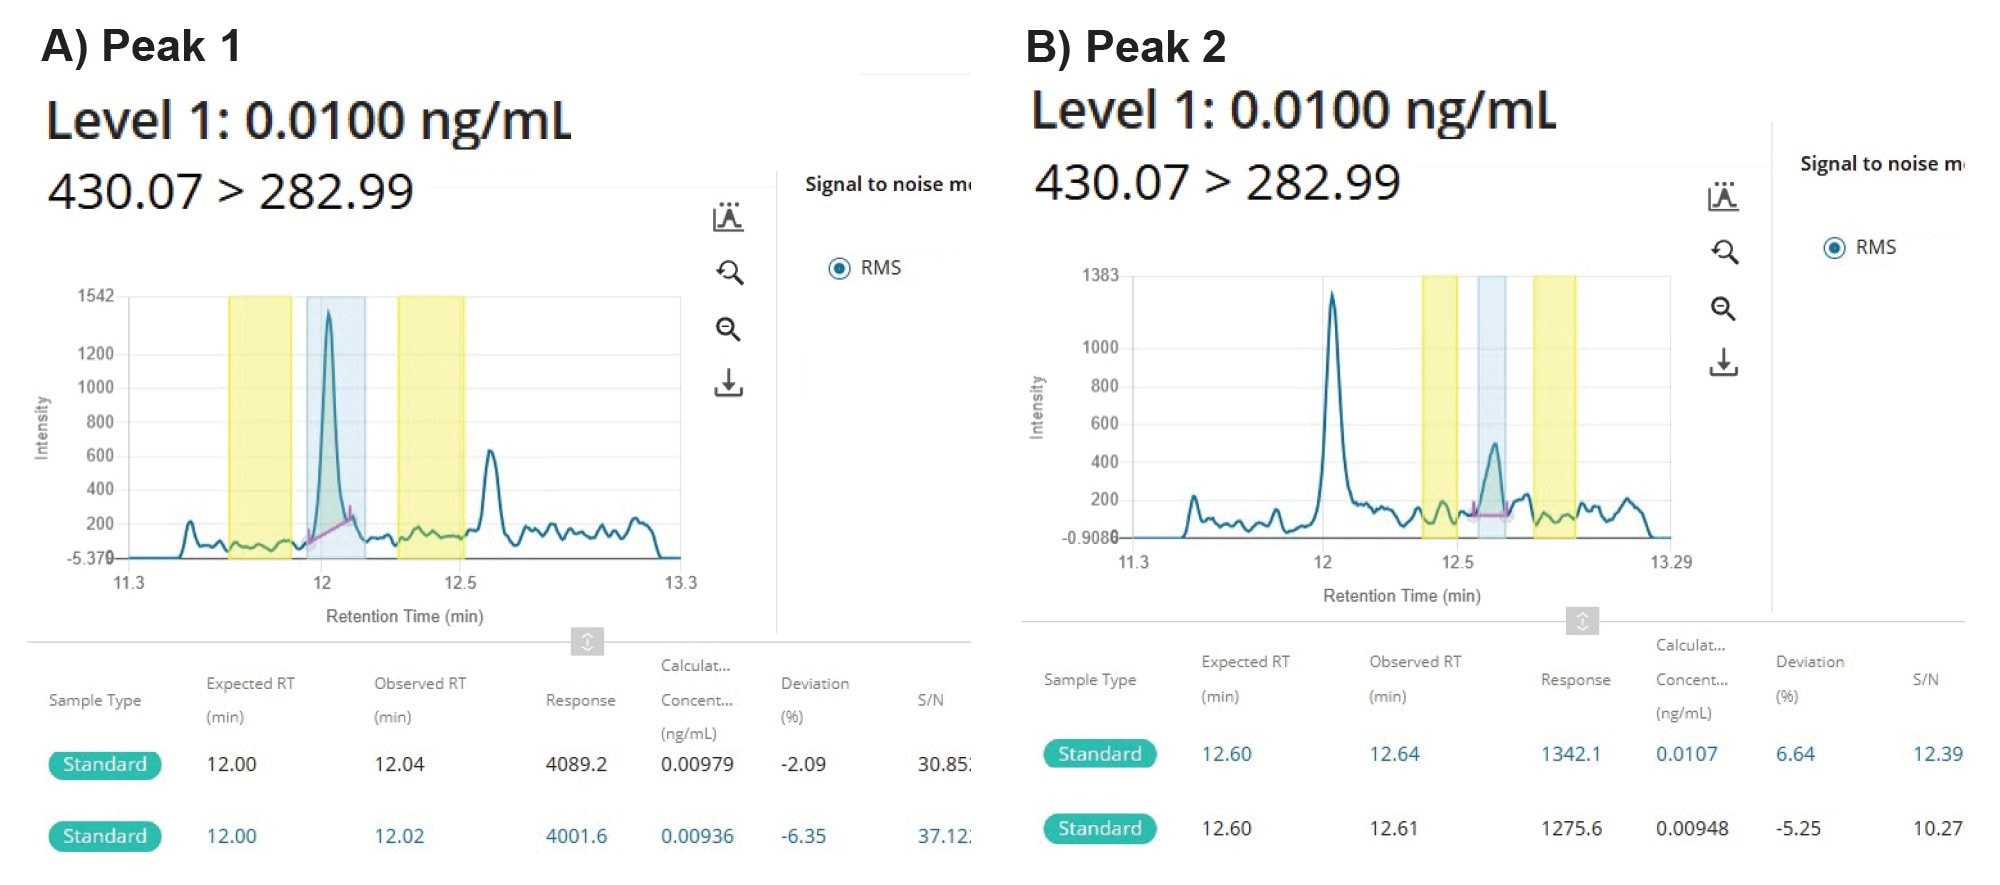
The signal-to-noise (S/N) for each impurity isomer was automatically calculated using the root means square (RMS) algorithm, for the lowest calibration standard (0.01 ng/mL, 0.00025 ppm method equivalent). The data was tabulated by the MS Quan Software as shown in Figure 5.
Repeatability
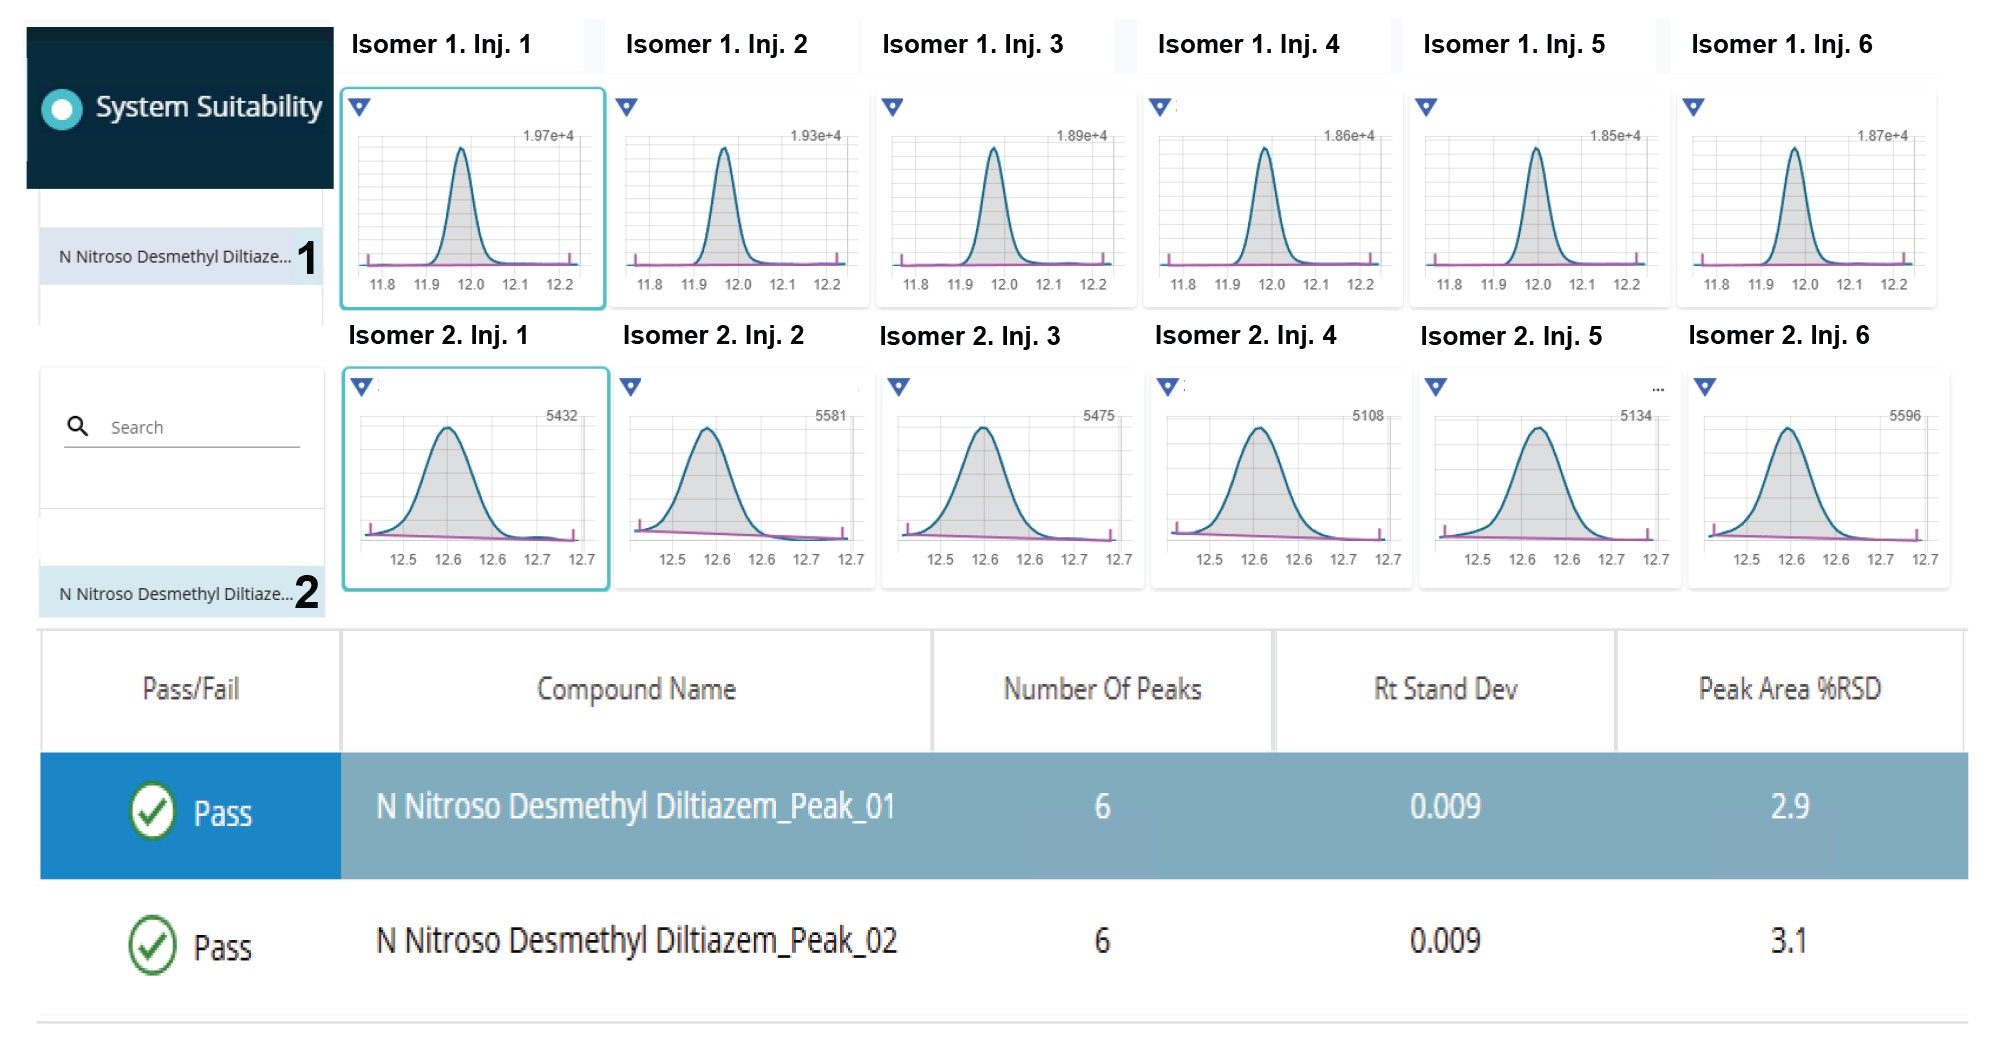
Repeatability (n = 6) was assessed at the 10% threshold level in an authentic standard (0.2 ng/mL, 0.005 ppm method equivalent). The Rule Set, described previously (Figure 3) can be configured to flag if the repeatability of the measured analyte passes or fails the required criteria specified in the system suitability settings. As shown in Figure 6, the software tabulates repeatability for each isomer, assessed in this case, in terms of the peak area %RSD, as well as the tR standard deviation. The %RSD for the peak areas of Peak 1 and Peak 2 were 2.9 and 3.1% respectively. The individual chromatograms are also shown.
Spike Recovery Experiments in Final Drug Product Tablet (120 mg)
The spike recovery experiments were performed at four concentration levels to represent 10%-150% of the threshold levels (Table 5). The spike recovery samples, (n = 6) were prepared at concentrations equating to 0.005 to 0.075 ppm (with respect to 40 mg/mL of API). Due to the presence of the endogenous level of NDD in the API, the recovery calculations were based on the corrected responses for the pre-spiked API samples. The following calculation was used:
% Recovery = (Corrected Pre-spike Response/Average Standard Response) *100%
Where corrected pre-spike was calculated by subtracting the average peak area responses for the endogenous levels of the NDD isomer peaks in the extracted sample from isomer peak areas in each of the spiked samples.
The average calculated recoveries for both isomers were between 90.7-106.6% for six separate preparations at each level (Figure 7). The %RSD of the recovery measurements at each concentration level for both isomers was less than 10%.
S/N of a Standard at the Threshold Levels
Establishing the LOQ of NDD in the diltiazem hydrochloride drug product sample was complicated by the presence of endogenous levels of impurity in the tablet samples tested. The S/N of the study threshold level and 10% of the threshold level in standards are shown in Figure 8.
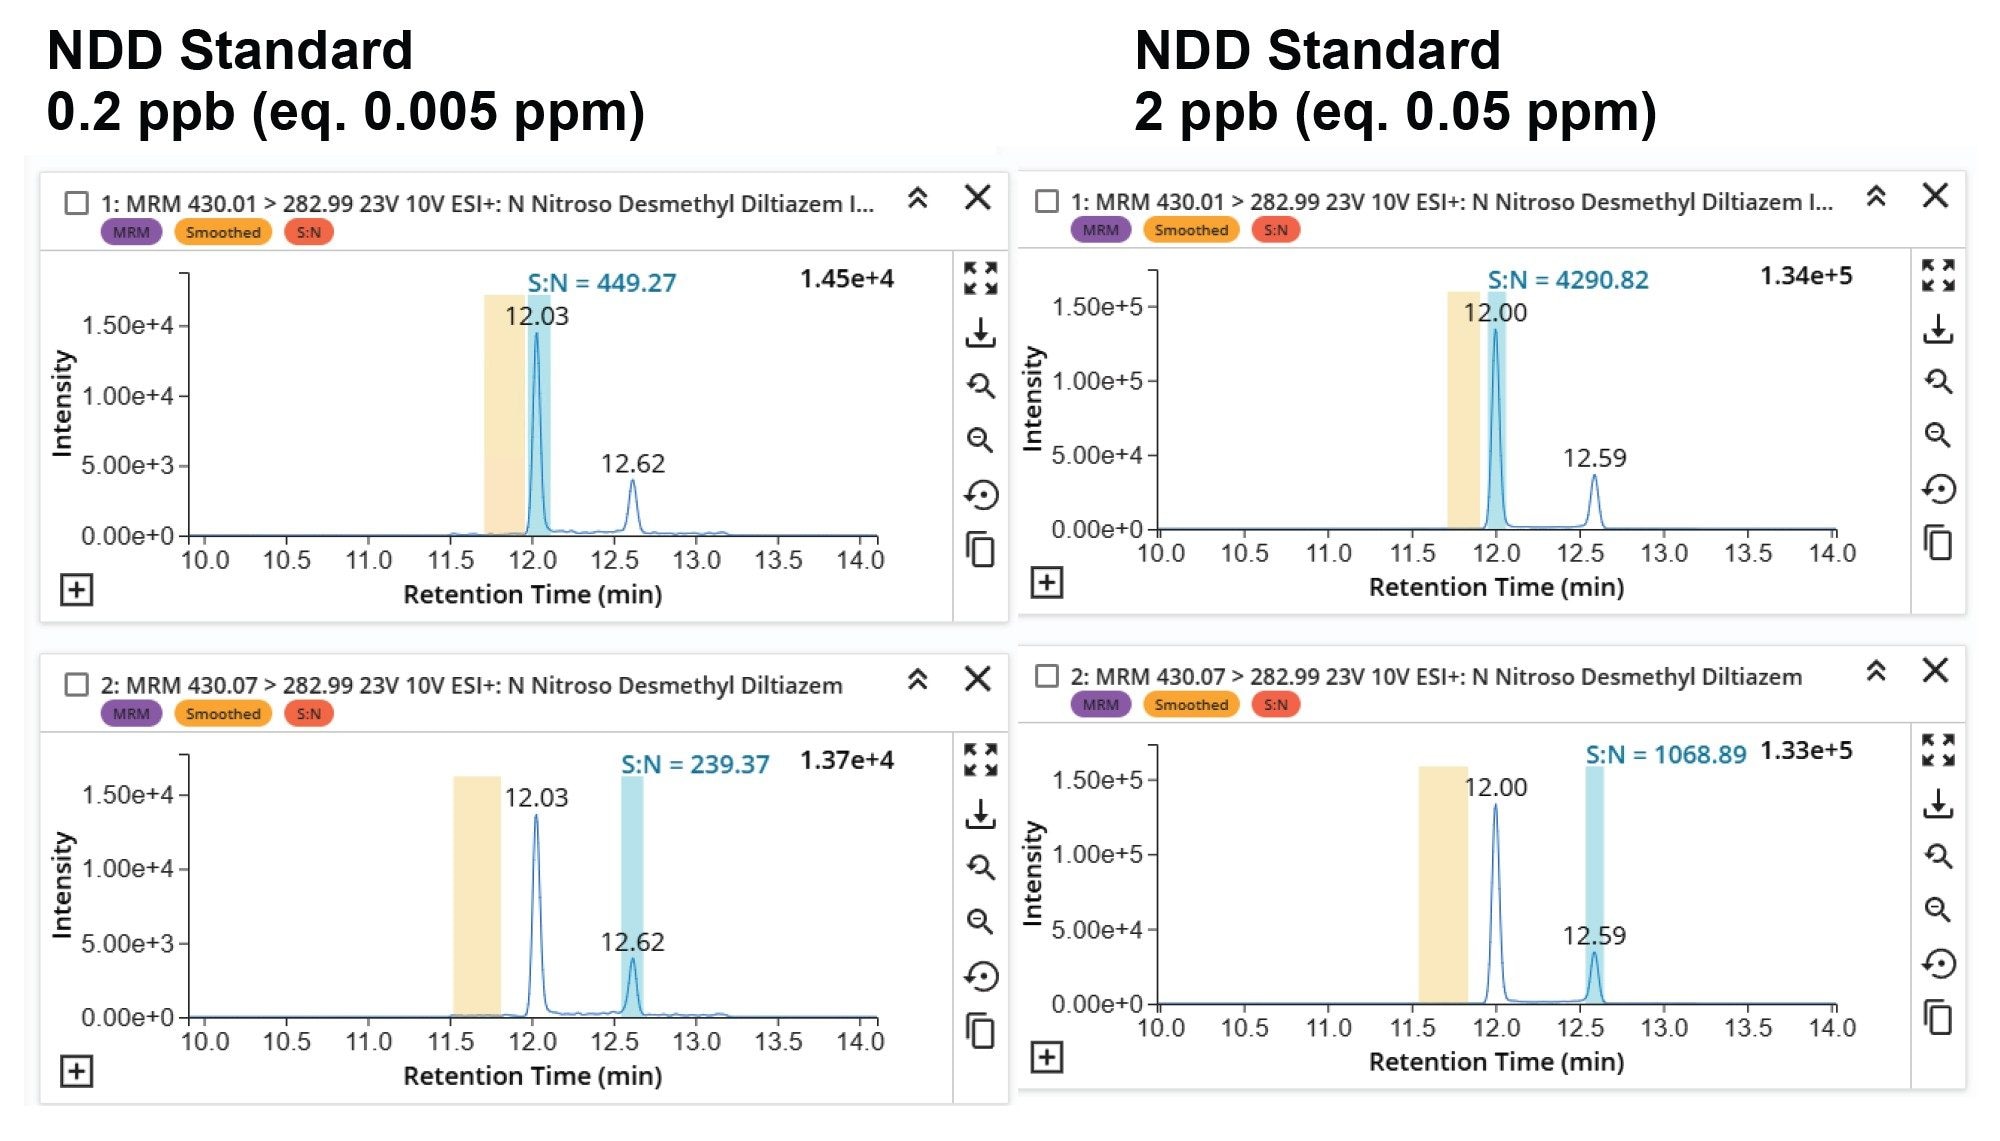
The current regulatory requirements for the AI of NDD is 100 ng/day, giving a threshold of 0.185 ppm (assuming an MDD of 540 mg/day). To avoid ongoing batch release testing, it is desirable for a quantitative method to achieve 10% of the threshold, (0.0185 ppm). In this work, the method demonstrates the ability to reach 10% of the more stringent previously set threshold limit of 0.005 ppm (AI was 26.5 ng/day).
Impurity Limits Calculations: Integrated Calculation and Flagging of Detected Impurities
Impurity limits calculations are integrated into the MS Quan Software. The diltiazem API is specified (Figure 9A) as well as the associated impurity limit (Figure 9B). The concentration of the API in mg/mL is defined in the method. The software will calculate the ppm concentration of the impurities in the sample and flag when the determined value exceeds the set threshold limit (Figure 9C).
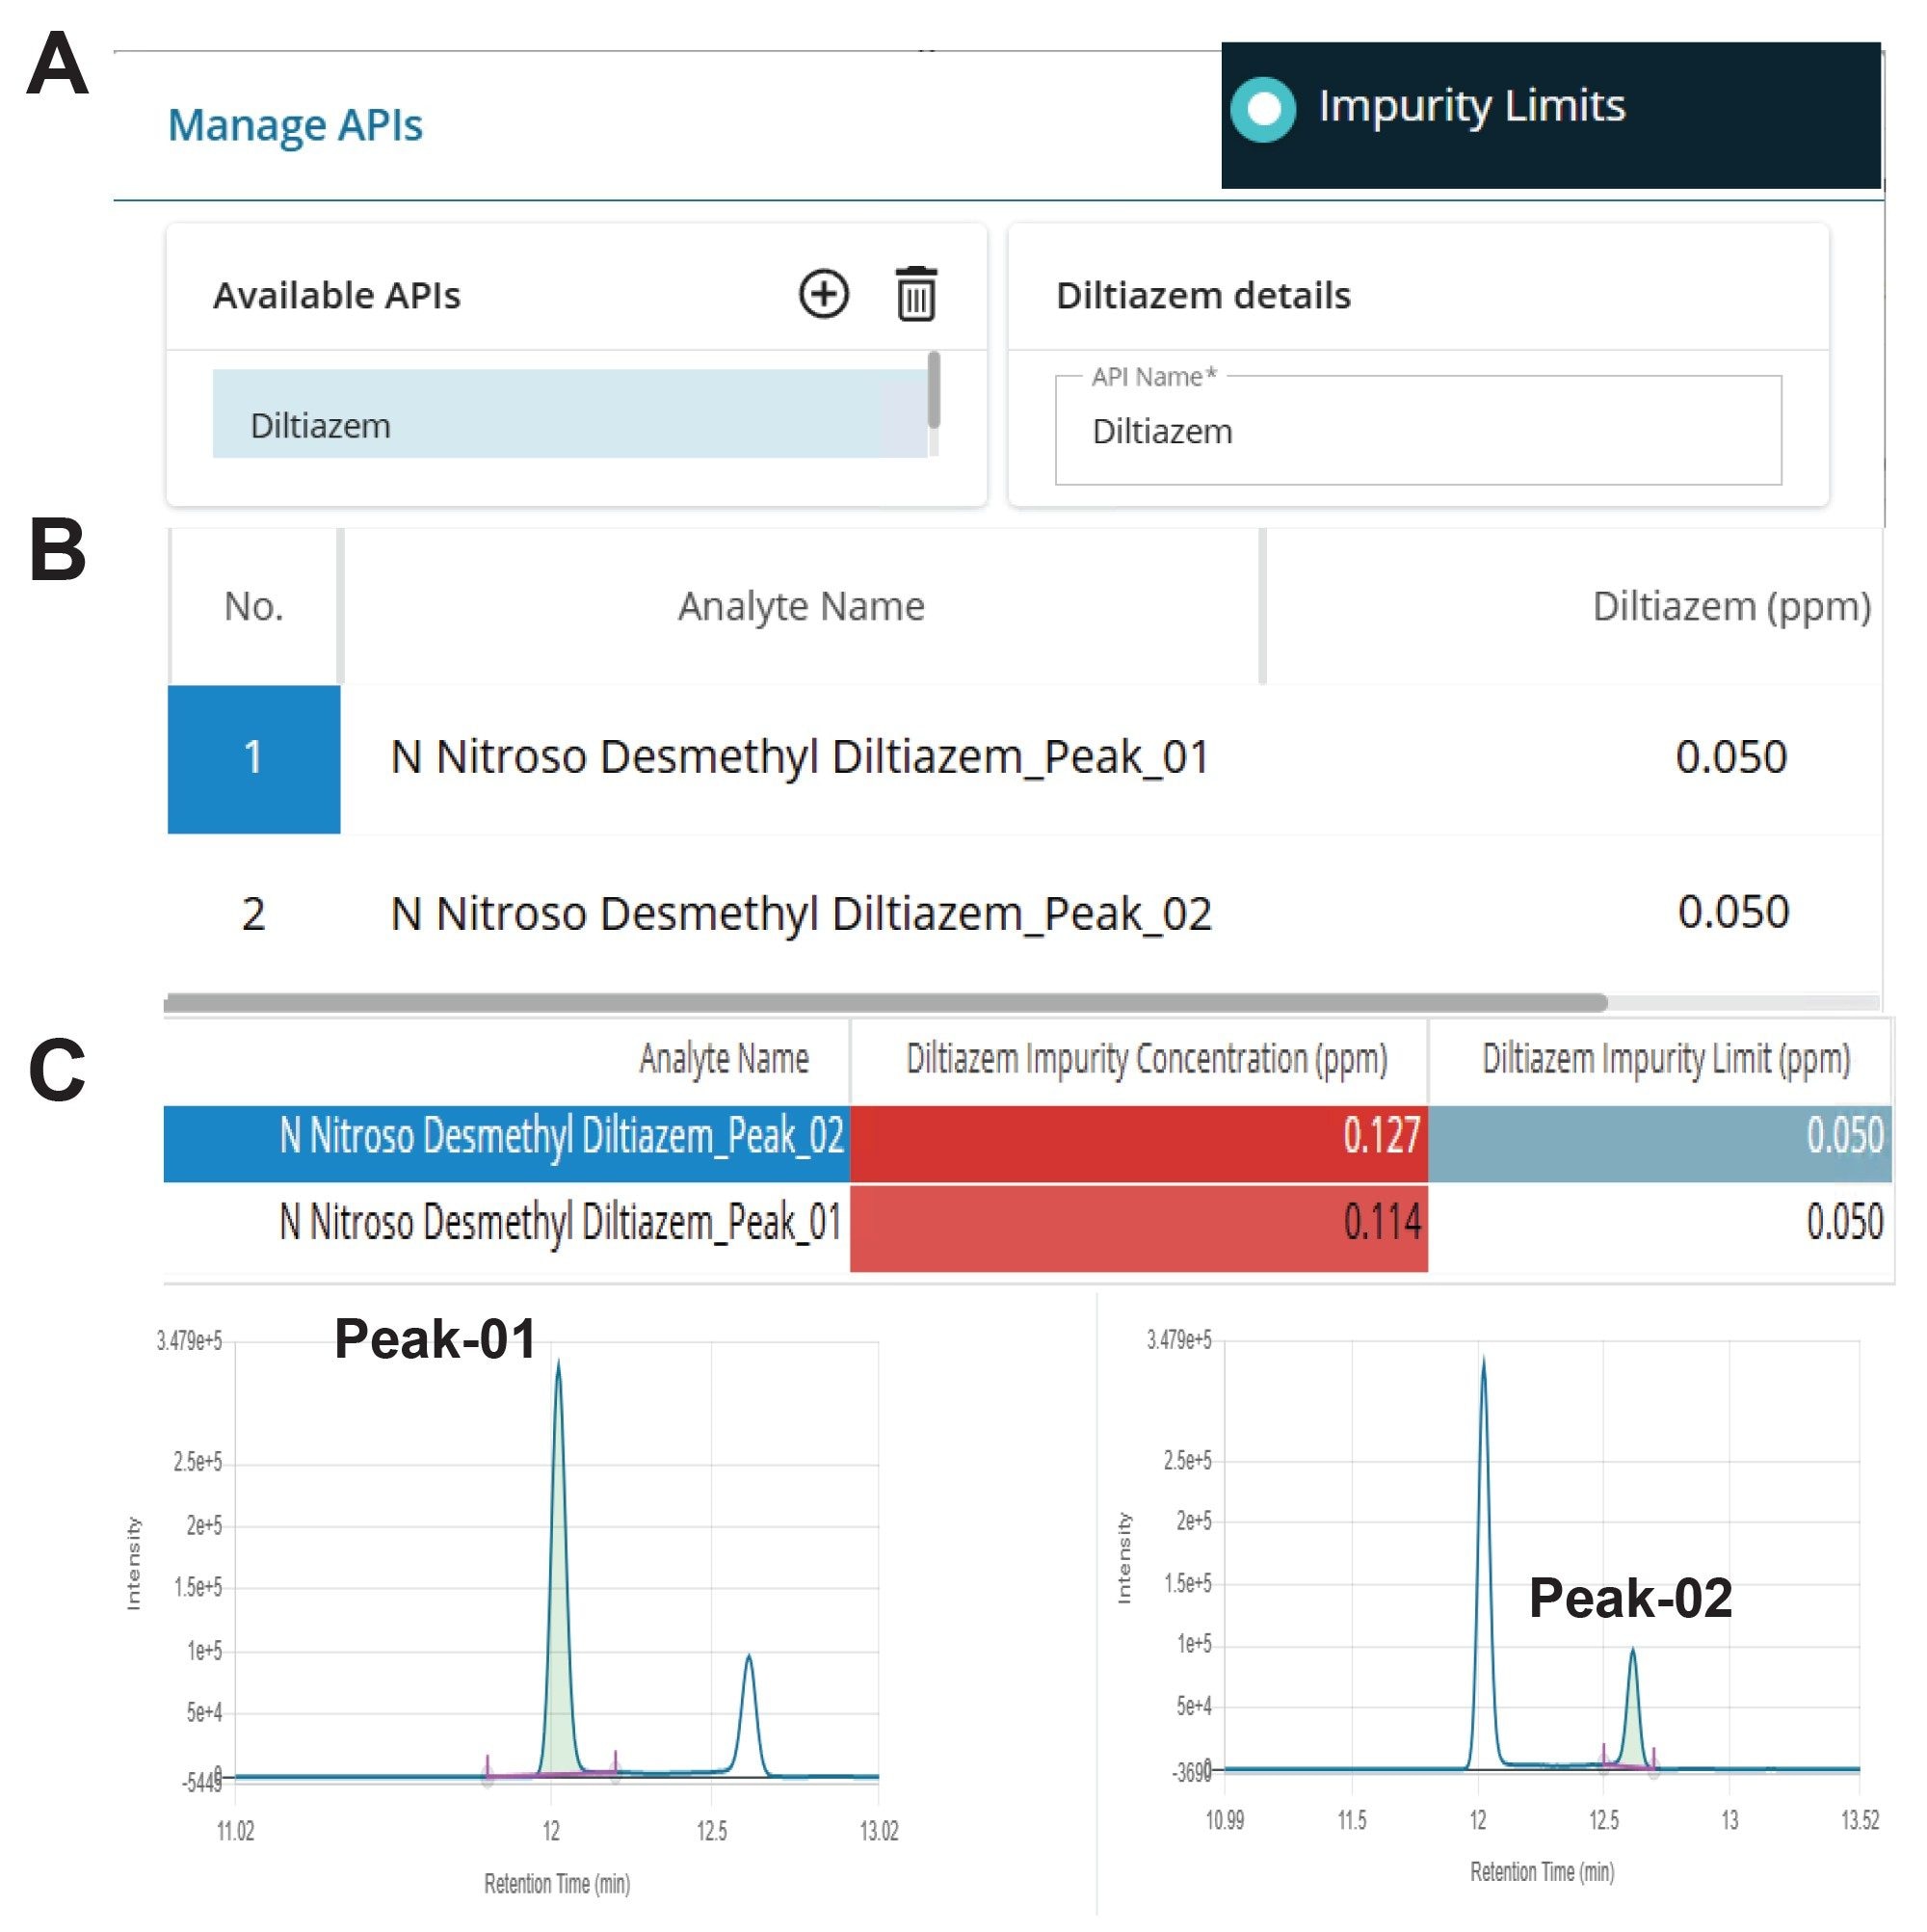
Quantification of NDD in Diltiazem Final Drug Product Tablet
The extracted diltiazem hydrochloride tablet samples (each 120 mg) were analyzed for the presence of the NDD impurity. The concentration detected was found to exceed the threshold set in the software. The quantification results are displayed in the Data Summary Table as shown in Figure 10. The calculation incorporated the mg/mL concentration of the API in the extracted drug product sample, in this case 40 mg/mL, which is based on the sample preparation and is specified in the method.
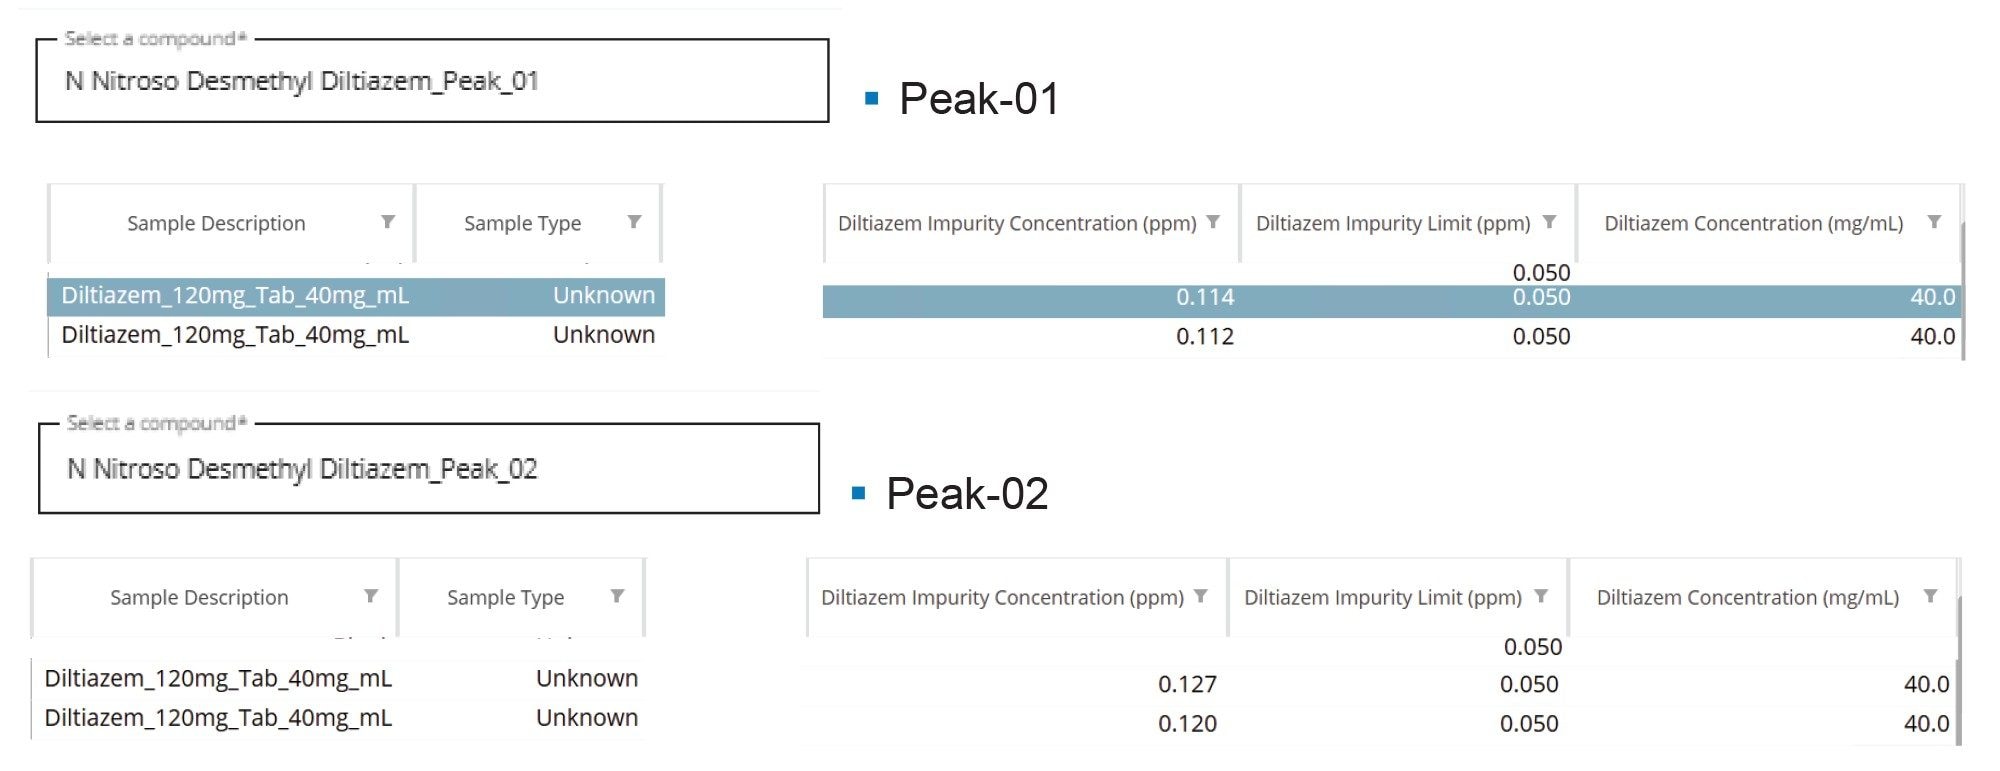
Conclusion
In this study, a robust UPLC-MS/MS method was developed for the quantitation of NDD in drug products. NDD was successfully chromatographically resolved from the diltiazem API, minimizing the potential for matrix effects and helping to ensure accurate impurity quantification. The use of RADAR scans can provide helpful qualitative data to support method development.
The method exceeds the regulatory threshold for detection and quantification of NDD, as determined by the CPCA.13 The method demonstrated at least three orders of linear dynamic range (0.01-10 ng/mL, R² >0.99). The spike recovery for the levels equal to 10-150% of the threshold limits (0.005-0.075 ppb or 0.2-3 ppb (ng/mL)) ranged from 90.67-106.64% with %RSDs from 1.34-9.75 for both detected peaks.
The waters_connect Software with its integrated impurity limits calculation increases the efficiency of the data processing, review and reporting. To support 21 CFR Part 11 compliance, the software ensures data integrity through access restrictions, electronic signature capabilities, and comprehensive automated audit trails.
References
- Moser, J.; Schlingemann, J.; Saal, C. N-Nitrosamines Impurities in Pharmaceuticals; The Abrupt Challenges that Resulted, the Evolving Science, and the Regulatory Framework. Journal of Pharmaceutical Sciences 2023, 112 (5), 1161-1162. DOI: https://doi.org/10.1016/j.xphs.2023.01.016.
- Teasdale, A.; Moser, J.; Ford, J. G.; Creasy, J. N -Nitrosamines. In Mutagenic Impurities, Teasdale, A. Ed.; Wiley, 2021; pp 269-320.
- Bharate, S. S. Critical Analysis of Drug Product Recalls due to Nitrosamine Impurities. Journal of Medicinal Chemistry 2021, 64 (6), 2923-2936. DOI: 10.1021/acs.jmedchem.0c02120.
- Holzgrabe, U. Nitrosated Active Pharmaceutical Ingredients - Lessons Learned? J Pharm Sci 2023, 112 (5), 1210-1215. DOI: 10.1016/j.xphs.2023.01.021 From NLM.
- Schlingemann, J.; et al. (2023). "The Landscape of Potential Small and Drug Substance Related Nitrosamines in Pharmaceuticals." Journal of Pharmaceutical Sciences 112(5): 1287-1304.
- Montesano, R.; Hall, J. Nitrosamine Metabolism and Carcinogenesis. In Mutation, Cancer, and Malformation, Chu, E. H. Y., Generoso, W. M. Eds.; Springer US, 1984; pp 447-464.
- Control of Nitrosamine Impurities in Human Drugs | FDA.
- Scientific review on the risk of nitrosamine impurities in human medicines | European Medicines Agency (EMA).
- ICH M7(R2) Guideline on assessment and control of DNA reactive (mutagenic) impurities in pharmaceuticals to limit potential carcinogenic risk.
- Nitrosamine impurities: guidance for marketing authorisation holders. Appendix 1: Acceptable intakes established for N-nitrosamines, appendix-1-acceptable-intakes-established-n-nitrosamines_en.xlsx
- CDER Nitrosamine Impurity Acceptable Intake Limits. CDER Nitrosamine Impurity Acceptable Intake Limits | FDA.
- Mandapaka, M. K.; Boddu, V. (2025)A Simple and Rapid Analytical Method to Detect and Quantify the N-Nitroso Desmethyl Diltiazem Impurity by Liquid Chromatography-Tandem Mass Spectrometry in Diltiazem Hydrochloride." SEPARATION SCIENCE PLUS 8(5): e70065.
- CDER Nitrosamine Impurity Acceptable Intake Limits | FDA.
- Ishii, K.; et al. (1994). "Direct chromatographic resolution of four optical isomers of diltiazem hydrochloride on a Chiralcel OF column." Journal of Chromatography A 686(1): 93–100.
- A Technical Guide to the Stereoisomers of Diltiazem: A Comparative Analysis of cis-(2S,3S)-Diltiazem and (2R-trans)-Diltiazem Hydrochloride.
720009522, August 2026


