
Method Scaling from UPLC to HPLC Using 3 mm ID MaxPeak Premier Columns
Kenneth Berthelette, Chris Collins, Thomas H Walter, Paul Rainville
Waters Corporation, United States
Published on October 14, 2026

Abstract
The analysis of the Janus kinase inhibitor ritlecinib was performed on an ACQUITY™ UPLC™ H-Class Plus System with Waters ACQUITY C18 RP, 3.0 x 50 mm Column with MaxPeak™ Premier Technology packed with 1.7 µm BEH™ C18 particles. Next, the method was scaled to HPLC on an Agilent 1260 Infinity II LC System with an XBridge™ Premier BEH C18 3.0 x 100 mm Column packed with 3.5 µm BEH C18 particles. Both separations achieved comparable chromatographic performance, highlighting that 3.0 mm ID MaxPeak Premier Columns are appropriate for transferring methods from Ultra-Performance Liquid Chromatography (UPLC) to High Performance Liquid Chromatography (HPLC).
Benefits
- Accurate scaling of the chromatographic method using column calculator tool
- Comparable chromatographic performance achieved with both methods
Introduction
LC methods are vitally important for assessing the identity and purity of pharmaceuticals. In many cases, a method originally developed in one lab may need to be transferred to another location. In those cases, differences in the available laboratory instruments may become a concern. Not all labs are equipped with the same systems, so having the tools to scale an analytical method from UPLC to HPLC allows for more seamless transfers between labs with varying equipment.
Typically, UPLC systems are run with narrow-bore 2.1 mm ID columns packed with sub-2 µm particles. While these columns generally offer the best performance for UPLC, the low column volume can become a problem when using a higher dispersion (higher extra-column volume) LC system.1 As such, some laboratories have standardized on 3.0 mm ID columns packed with sub-2 µm particles. This mitigates some of the dispersion effects when using different LC systems, at the cost of greater mobile phase consumption compared to 2.1 mm ID columns. In many cases, because of instrument dispersion effects on separations, using 3.0 mm ID columns may prove advantageous especially when transferring a method from UPLC to HPLC systems.
This application note focuses on the transfer of a method from UPLC to HPLC using 3.0 mm ID columns on both systems. The selected UPLC Column was a Waters ACQUITY C18 RP Column with MaxPeak Premier Technology packed with 1.7 µm BEH C18 stationary phase. This column employs MaxPeak Premier Technology which is a modification to the column hardware. This modification provides several benefits including but not limited to mitigation of interactions between analytes and the metal oxide surfaces of the columns, and a decrease in the occurrence of metal ions released into the mobile phase.2-4 A less obvious benefit is that in modifying the column hardware, variations in metal quality are masked, which reduces the potential for variability between lots of hardware or columns. Any means of reducing variability is worth investigating when performing method transfer activities.
To highlight this, a UPLC method was scaled to an Agilent 1260 Infinity II LC System, using an XBridge Premier BEH C18 Column packed with 3.5 µm particles. Using the appropriate method scaling tools, both analyzes yielded comparable results for the analysis of ritlecinib, which contained an unknown impurity.
Experimental
Sample Description
A stock solution of ritlecinib was created at 1 mg/mL. The stock solution was diluted to create a final sample containing 100 µg/mL of ritlecinib. The final sample solvent composition was 90:10 water:acetonitrile (v/v).
Method Conditions
LC Conditions
|
UPLC system: |
ACQUITY UPLC H-Class Plus System configured with a Column Manager, 2 Column Auxiliaries, and a PDA Detector |
|
HPLC system: |
Agilent 1260 Infinity II LC System configured with a multicolumn thermostat (MCT), and a Diode Array Detector (DAD) |
|
Detection: |
UV @ 275 nm |
|
Columns: |
XBridge Premier BEH C18 Column, 3.0 x 100 mm, 3.5 µm (p/n: 186009872) Waters ACQUITY C18 RP Column, MaxPeak Premier Technology, 1.7µm, 130 Å, BEH, 3.0 x 50 mm (p/n: 186011839) |
|
Vials: |
LCGC Certified Glass Vials (p/n: 186000272C) |
|
Column temperature: |
30 °C |
|
Sample temperature: |
10 °C |
|
Injection volume: |
1.0 µL (UPLC) and 2.0 µL (HPLC) |
|
Flow rate: |
0.495 mL/min (HPLC) 1.020 mL/min (UPLC) |
|
Mobile phase A: |
Water with 0.1% formic acid |
|
Mobile phase B: |
Acetonitrile with 0.1% formic acid |
|
Gradient (UPLC): |
Initial conditions of 95:5 (A:B). Linear gradient to 95% B in 6.86 minutes, followed by a hold for 1.14 minutes. Return to starting conditions and re-equilibrate for 2.28 minutes. Total run time 10.30 minutes. |
|
Gradient (HPLC): |
Initial conditions of 95:5 (A:B). Linear gradient to 95% B in 28.25 minutes, followed by a hold for 4.69 minutes. Return to starting conditions and re-equilibrate for 9.39 minutes. Total run time 42.41 minutes. |
Data Management
|
Chromatography software: |
Empower™ Chromotography Data System |
Results and Discussion
Prior to carrying out the methods, both systems used were characterized to determine the gradient delay volume, also called the dwell volume.1 It is important to have measured values to ensure that the gradient is properly scaled. In this case, both systems were characterized by using water mobile phases, with line B containing 0.1% acetone. By following the typical steps for determining gradient delay, the process of characterizing a system is relatively straightforward.1,5 In this experiment, it was determined that the ACQUITY UPLC H-Class Plus System had a dwell volume of 0.389 mL, and the Agilent 1260 Infinity II System had a dwell volume of 0.808 mL. It should be noted that different configurations of systems will have different dwell volumes, and any change in tubing can impact the value.
Once both systems were characterized by the original method, performed using a 2.1 mm ID column, was translated to a 3.0 mm ID column packed with the same stationary phase, BEH C18 1.7 µm. The resulting chromatogram is shown in Figure 1.
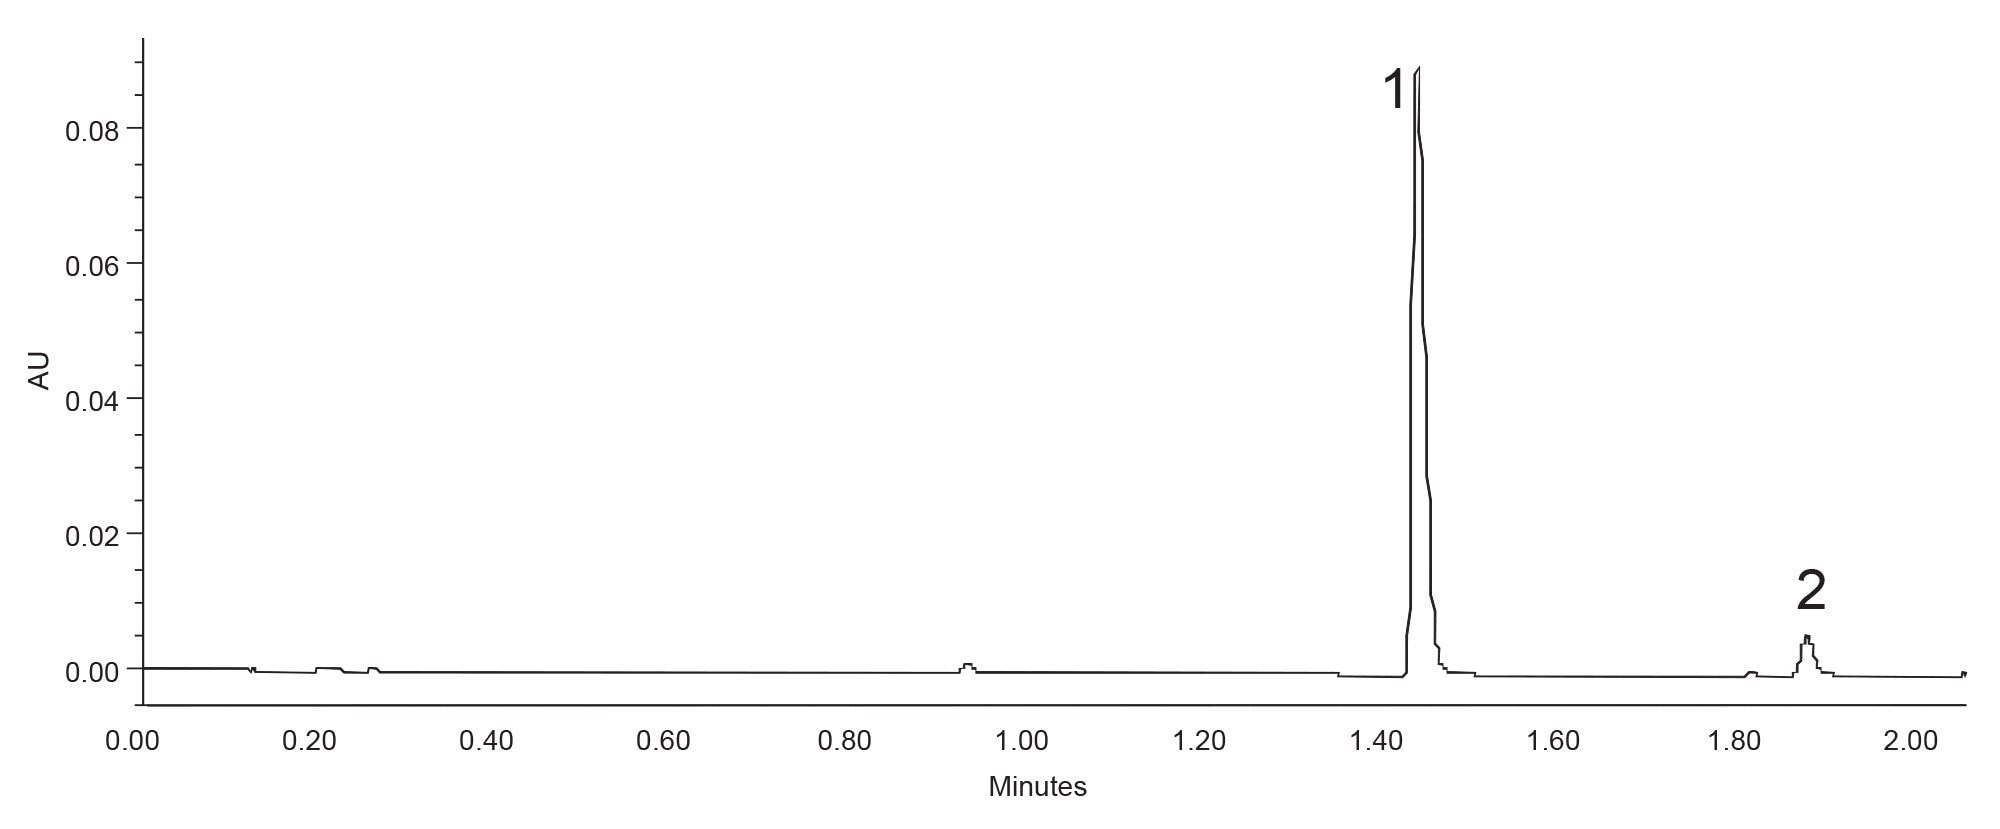
Good peak shapes were achieved for both ritlecinib and an unidentified impurity. Given that this impurity is a true unknown, and mass spectrometry was not possible for this analysis, relative retention time is a critical parameter for tracking the impurity peak during scale-up to HPLC. Under UPLC conditions, the relative retention of the impurity was 1.31 relative to the ritlecinib peak. For scaling the method from UPLC to HPLC, the Waters Column Calculator was used. Previously, the columns calculator had been shown to aid in scaling a method, both by obviating the need for manual calculation and by mitigating the risk of errors.6,7 Figure 2 shows the Column Calculator inputs and outputs for the analysis of ritlecinib when moving from the UPLC system with a 3.0 x 50 mm 1.7 µm column, to an HPLC system with a 3.0 x 100 mm 3.5 µm column.
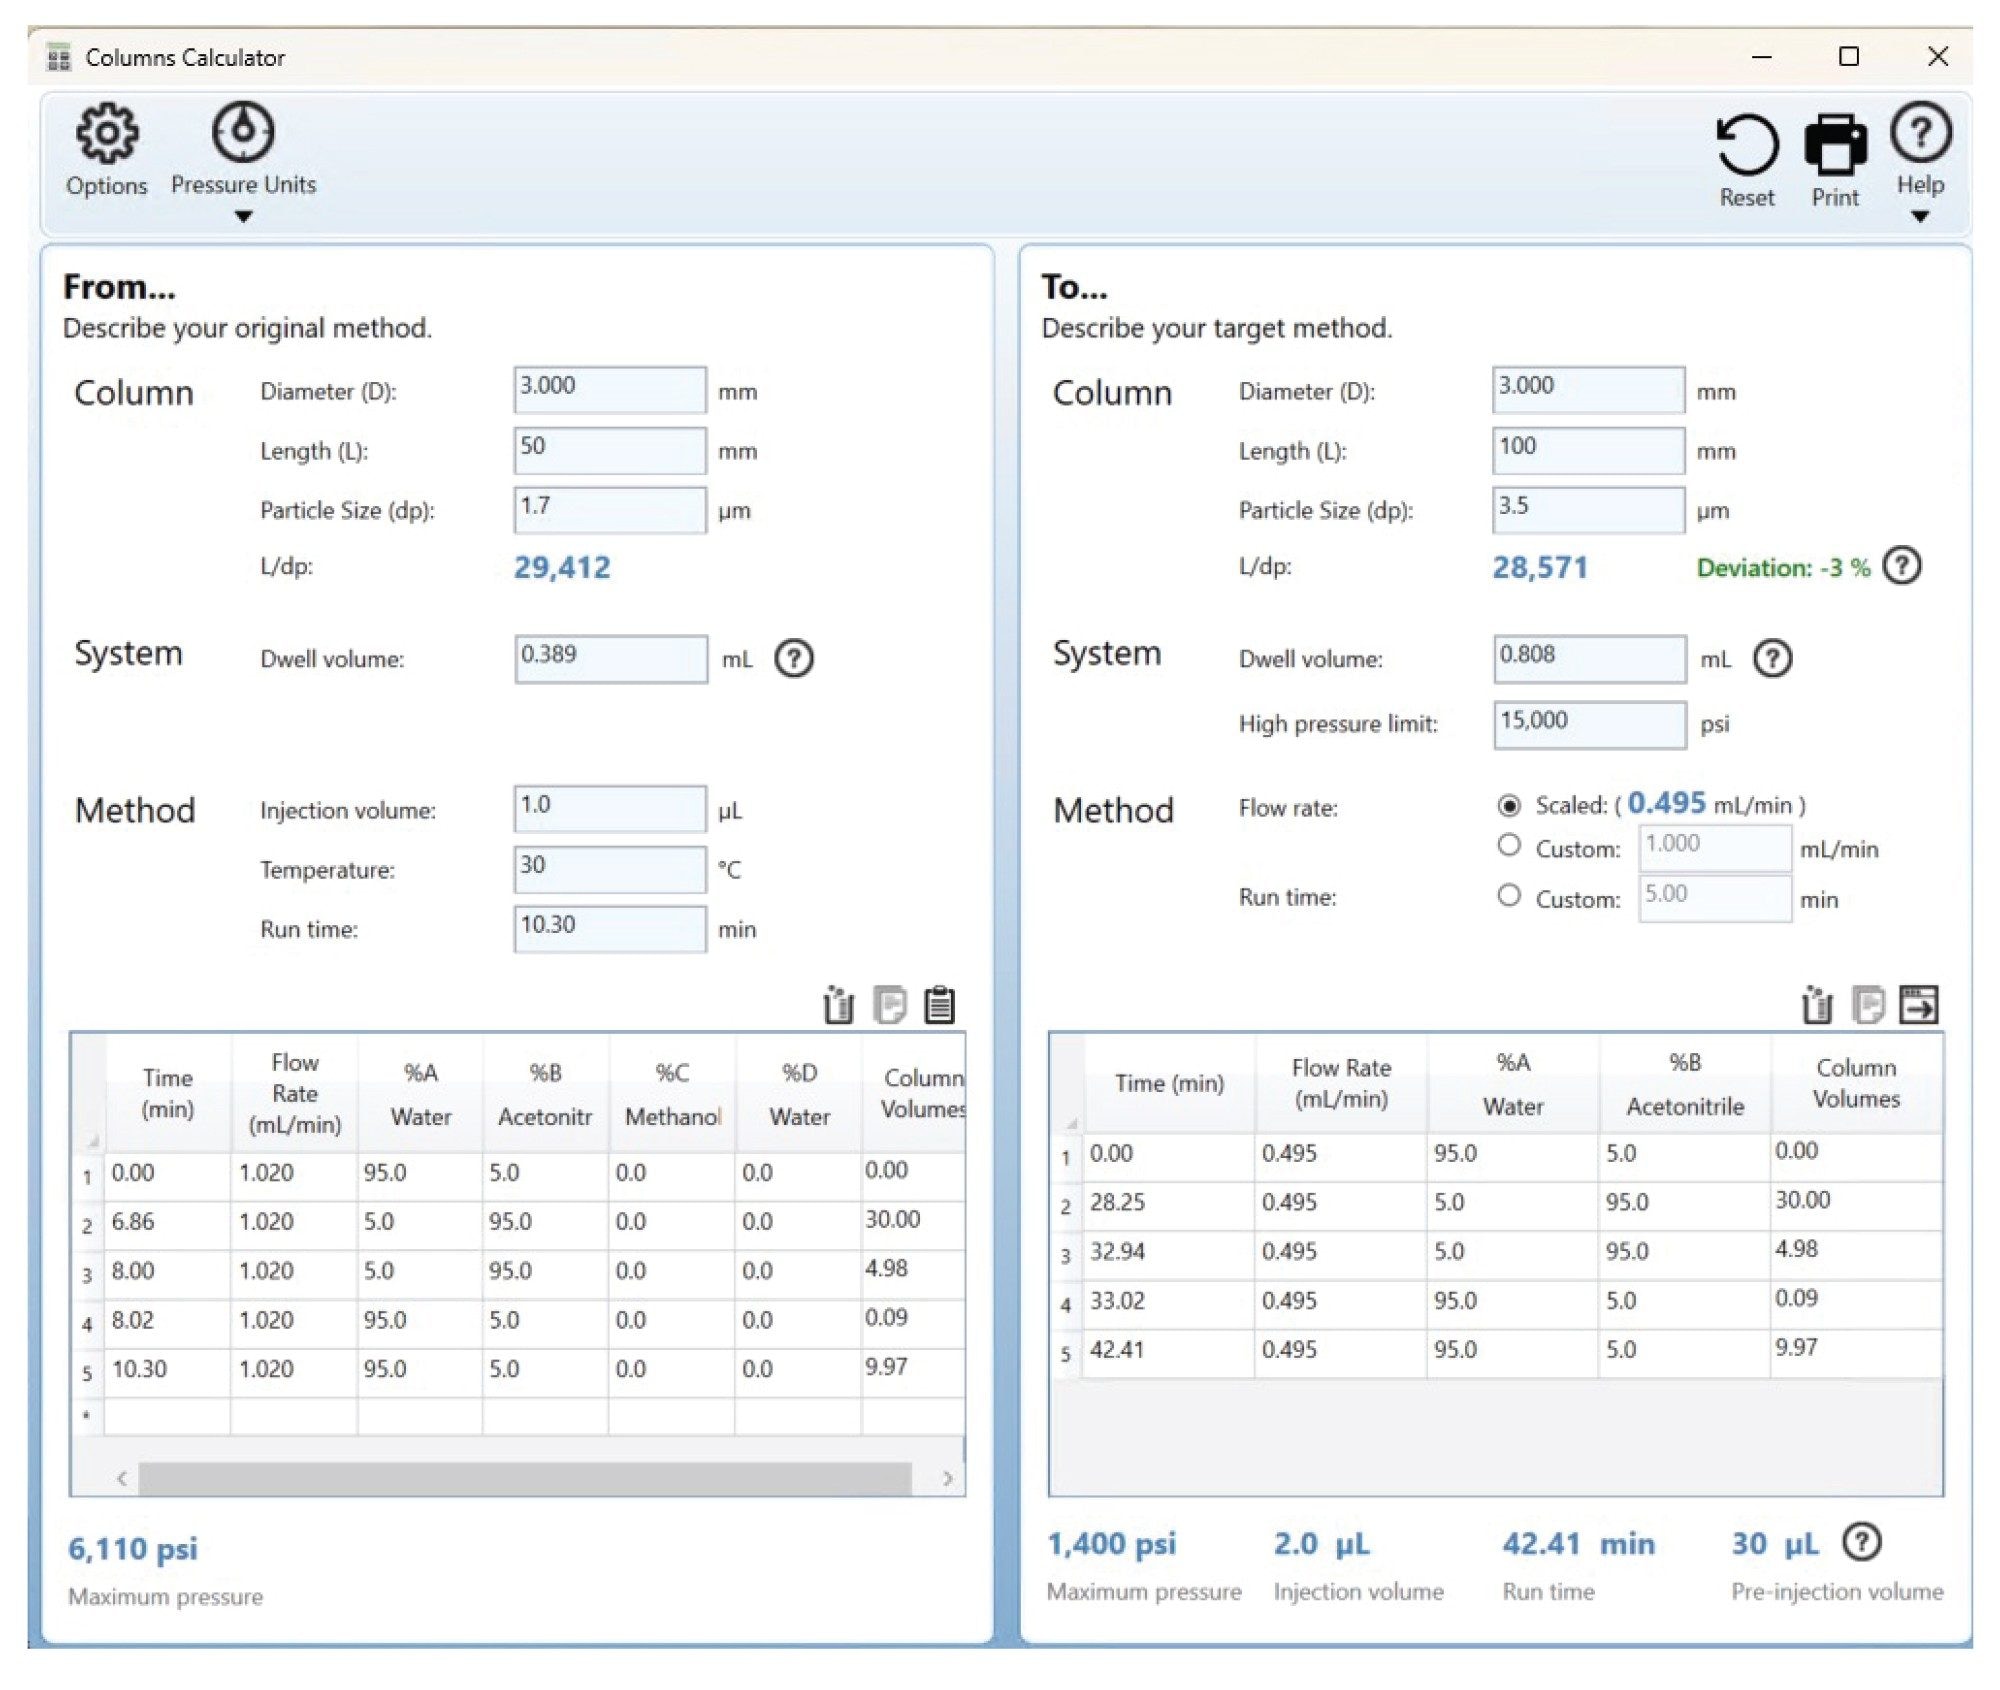
To use the calculator, an analyst must first input their original method on the left side of the screen. This includes the original column ID, length (L), and particle size (dp). Length and particle size are needed to calculate the L/dp ratio, which is a measure of column efficiency. Ideally when scaling a method between two columns, the L/dp will be maintained. In some cases, like USP monographs, there are strict guidelines around allowable changes to column configuration based on L/dp. Next, the analyst enters their system dwell volume, however this can be ignored for isocratic separations. Next, values for injection volume, column temperature, run time, and the gradient table for the original method must be entered. Lastly, the user has to enter the column configuration they are scaling to, along with the dwell volume of the new system.
The calculator then determines the scaled flow rate, gradient table, injection volume and run time of the new method. Additionally, the calculator will suggest including a pre-injection volume or adding an additional hold at the start at the gradient to account for differences in system dwell volume. In this case, a 30 µL pre-injection volume was recommended, however the HPLC system being used does not accommodate that adjustment. As such, the gradient table alone was used when analyzing ritlecinib on the HPLC system and column. Figure 3 shows the resulting chromatogram of ritlecinib and the impurity obtained using the Agilent 1260 Infinity II system with an XBridge Premier BEH C18, 3.0 x 100 mm, 3.5 µm Column.
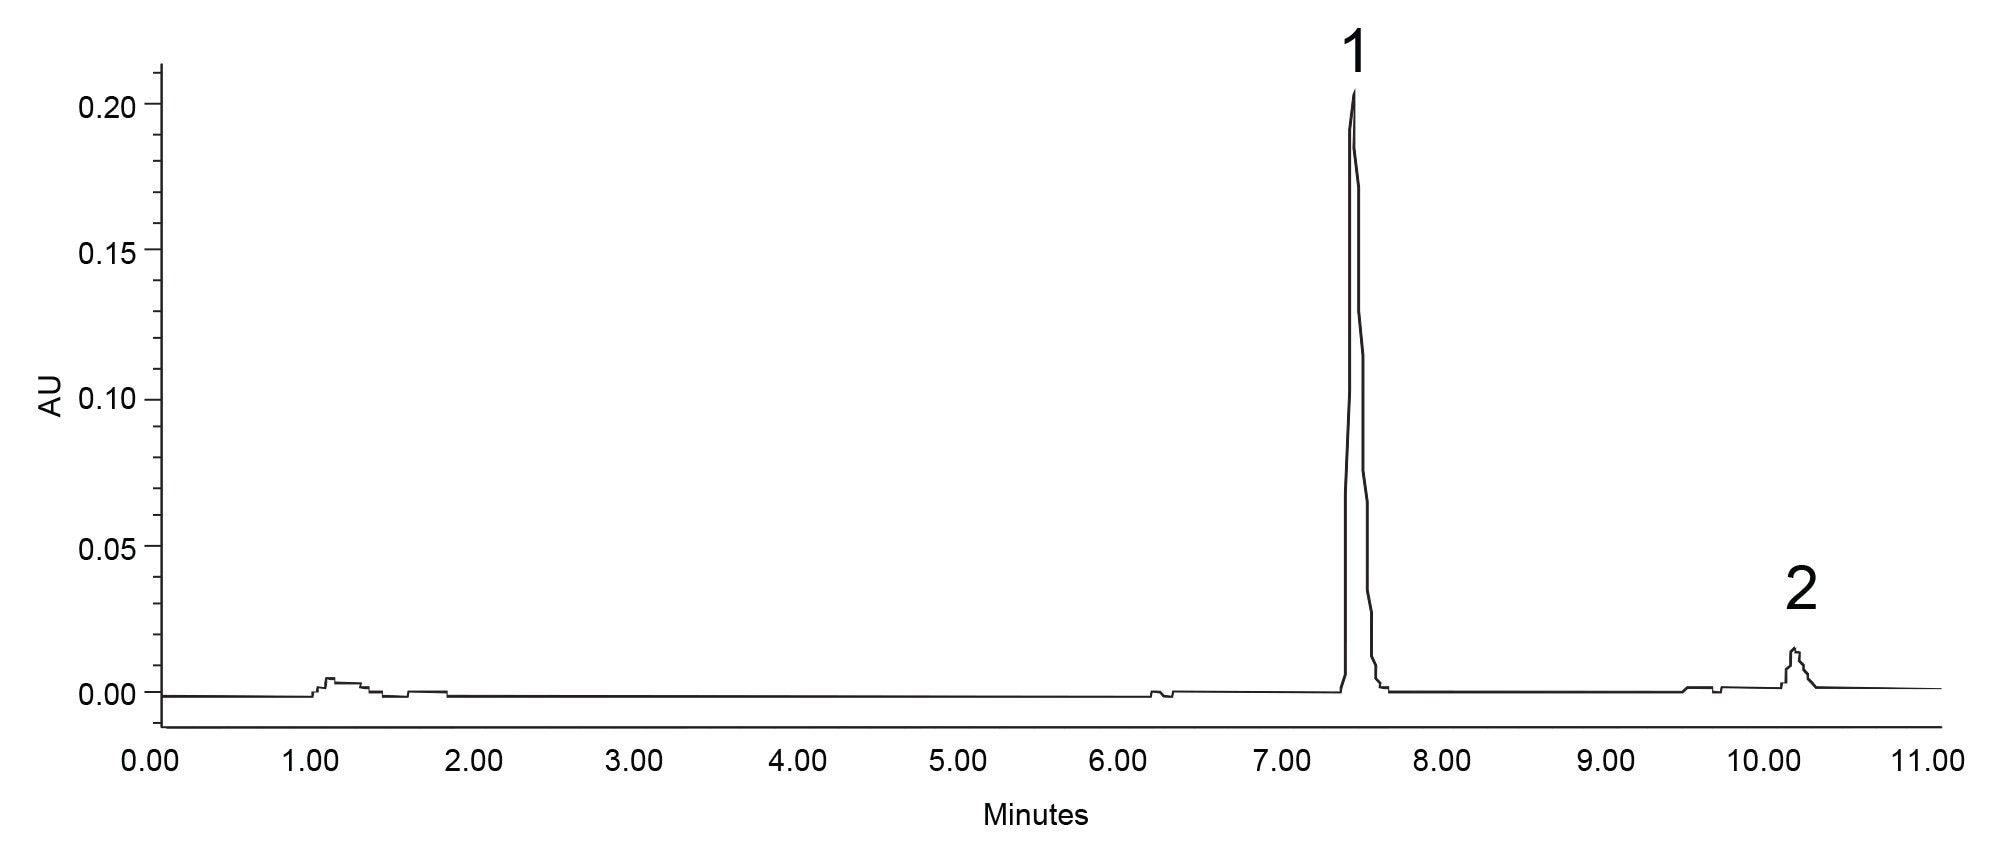
The scaled method produced comparable data relative to the UPLC separation with the process impurity eluting with a relative retention of 1.37. Further comparisons of separation performance including USP resolution for the impurity, and USP plate count of ritlecinib are shown in Table 1. In addition, the peak area percentage of the impurity was approximately 6.8 and 6.5 on the UPLC and HPLC systems, respectively.

As expected, when scaling a method using the Column Calculator, and accounting for differences in the dwell volume, comparable chromatographic performance was achieved. For this analysis, the USP plate counts for ritlecinib for the two methods were very similar, as were the USP resolution values and relative retention time for the impurity.
Conclusion
While transferring a method between instruments can be challenging by using the appropriate tools that process can be more easily performed. This application note examines the scaling of a method from UPLC to HPLC, using 3.0 mm ID MaxPeak Premier Columns. Comparable chromatographic performance was achieved on both systems.
References
- Hong, P.; McConville, P. Dwell Volume and Extra-Column Volume: What Are They and How Do They Impact Method Transfer?, Waters white paper 720005723.
- DeLano, M.; et al. Using Hybrid Organic-Inorganic Surface Technology to Mitigate Analyte Interactions with Metal Surfaces in UHPLC. Anal Chem. 93 (2021) 5773–5781 doi: 10.1021/acs.analchem.0c05203.
- Lauber.; et al. Low Adsorption LC Technology Based on MaxPeak High Performance Surfaces, Waters white paper 720006930.
- Zabala, G.; Berthelette, K.; Gu, W.; Haynes, K. Improved Reproducibility for Acetaminophen Assay USP Monograph using MaxPeak Premier Columns after Modernization to 2.5 µm Particles. Waters Application Note. 720007938.
- Magee, M.; et al.“Measure Your Gradient”: A New Way to Measure Gradients in High Performance Liquid Chromatography by Mass Spectrometric or Absorbance Detection. J Chrom A. 1369 (2015) 73–82.
- Berthelette, K.; Turner, J.; Kalwood J.H. Faster, Simpler Method Scaling Across Particle Sizes Using the Waters Column Calculator Compared to Manual Calculation Workflow. Waters Application Note. 720007887.
- Dlugasch, A.; Simeone, J.; McConville, P. Scaling a USP Gradient Method on the ACQUITY Arc System in Support of Lifecycle Management. Waters Application Note. 720006620.
720009611, October 2026


