
Development and Validation of an Automated Online SPE Kit Coupled to Xevo TQ-S micro for the Identification and Quantification of 48 PFAS in Environmental Water Matrices
Sara Beverleya, Peter Hancocka, Euan Rossa, Chelsea Plummerb, Tiantian Lic
aWaters Corporation, Wilmslow, United Kingdom.
bWaters Corporation, Milford, United States.
cCTC Analytics AG, Industriestrasse 20, 4222 Zwingen, Switzerland.
Published on October 16, 2026

Abstract
Per- and polyfluoroalkyl substances (PFAS) represent a diverse and persistent class of environmental contaminants requiring ultra-trace detection and robust automated methods to keep pace with the demands of increasing throughput. This study describes the development and evaluation of an online solid-phase extraction (SPE) kit coupled to a core-performance LC–MS/MS for the determination of the 48 PFAS as defined in the UK Drinking Water Inspectorate (DWI) and aligned with current EU and UK regulatory frameworks. The method integrates automated sample preparation with LC-MS/MS enabling low (ng/L) quantification, reduced contamination risk and designed to support extended unattended and overnight operation. The method performance was assessed in three environmental water types including a certified reference material (CRM), demonstrating excellent accuracy, linearity (R²> 0.99), low limits of quantification (LOQ; down to 0.05 ng/L) and precision.
Benefits
- Improved sensitivity and low (sub ng/L) detection limits for 48 PFAS on the Xevo™ TQ-S micro Mass Spectrometer under waters_connect™ for Quantitation Software control
- An automated online SPE workflow enabling high sample throughput with minimal analyst intervention, supporting extended and overnight operation
- Improved quantitative confidence across drinking, river, and groundwater samples through effective matrix clean-up and reduced matrix effects
- Better precision and reproducibility compared to manual offline SPE
- Reduced solvent consumption and single-use plastic waste compared to manual offline SPE, helping laboratories lower operating costs and environmental impact
Introduction
PFAS are among the persistent organic pollutants characterized by their prevalence in the environment, high mobility, and adverse impact not only on the ecosystem but also on human health.1 Establishing accurate and robust analytical methods for PFAS representing the class chemical diversity is essential to determine their concentration for both regulatory monitoring and remediation processes.2,3 Since 2000, the Water Framework Directive 2000/60/EC (WFD) has been the main legal instrument for water protection in Europe. Together with the Environmental Quality Standards Directive (EQSD) and the Groundwater Directive, it applies to inland, transitional and coastal surface waters, as well as groundwaters. The WFD covers surface water pollutants of greatest (EU-wide) concern by identifying them as priority substances, including a subset of priority hazardous substances. They are listed in Annex X to the Directive, and environmental standards are set for them in the EQSD. A new standard has been established for the sum of 25 PFAS (expressed as PFOA equivalents with an EQS as low as 0.0044 µg/L).4 In 2025, the Drinking Water Inspectorate (DWI) in England and Wales outlined the requirements for the monitoring of 48 PFAS (including 6:2 FTAB) with a cumulative limit of 100 ng/L in raw water sources that will ultimately be used for supplying drinking water.5
SPE is commonly used in routine PFAS analysis because it provides an effective and selective means of isolating trace-level compounds from complex environmental and biological matrices.6 Typically, many different PFAS are present within the sample at concentrations ranging from low ng/L to mg/L. A wide range of interfering substances may also coexist, making sample clean-up and pre-concentration essential for accurate quantitation. SPE enables both enrichment of analytes and the removal of matrix components, thus improving detection, sensitivity and analytical accuracy in subsequent LC–MS/MS or GC-MS/MS analysis. SPE methods based on weak anion-exchange (WAX) mechanisms are well suited to PFAS due to their ionic and amphiphilic nature, allowing strong retention and efficient recovery across a broad range of PFAS chemistries.7 As compared to other preparation techniques, SPE offers reproducibility, compatibility with regulatory methods, and scalability for high-throughput monitoring, making it a standard and reliable approach in PFAS analysis.8 However, offline SPE methods using vacuum manifold equipment are considered labor-intensive and prone to contamination.
Trap-and-elute 2D chromatography (2D-LC) is an online technique in which analytes are first retained and concentrated on a trapping column for matrix clean-up, then eluted onto an analytical column for chromatographic separation. Sample loading, washing, and elution occur on the first dimension. Switching valves allow the retained analytes to be transferred seamlessly onto the analytical column without manual intervention. In comparison to offline SPE, trap and elute chromatography offers significant benefits including improved efficiency and throughput by reducing hands-on time by automating the extraction steps. Multiple samples can be processed sequentially with minimal user input, making it ideal for high-throughput laboratories. Automation minimizes operator-dependent variability, leading to more consistent recoveries and better quantitative reliability compared to manual or offline SPE resulting in enhanced reproducibility and precision. Since the samples remain within a closed system, there is less risk of contamination, analyte loss, or degradation which are common issues in manual workflows involving multiple transfer steps. Online SPE typically uses smaller solvent volumes and eliminates the need for single use disposable SPE cartridges, reducing costs and environmental impact.9 The ability to interface directly with LC-MS improves sensitivity and limits critical points for analyte loss within the method, often enabling lower detection limits to be achieved.
Here, the development and evaluation of 2D-LC chromatography are described as a strategy to improve sensitivity, selectivity, and clean-up for the 48 PFAS by combining online sample pre-concentration with LC-MS/MS using the Xevo TQ-S micro Mass Spectrometer.
Experimental
LC Conditions
|
Online SPE system: |
Waters Online SPE UPLC™-MS/MS Kit featuring • Two ACQUITY™ UPLC Solvent Managers, H-Class QSM and I-Class Plus with Binary Solvent Management (BSM) and Flow-Through Needle (FTN) modified with PFAS free solvent lines • Atlantis™ Premier BEH™ C18 AX 5 µm, 2.1 x 50 mm Isolator Column (p/n: 186009407) • CTC PAL-3 RSi Sample Manager (fitted with PFAS free parts) • ACQUITY UPLC Column Manager |
|
Vials: |
PFAS-free PAL System Vial 10 CV, 8 mL, PP with ND18 Screw Caps |
|
Trap column: |
Custom Oasis™ WAX Direct Connect Column connected to an XBridge™ BEH C8 Direct Connect Column (p/n: 186005233) |
|
Load solvent composition: |
Water adjusted to pH 3.0 [±0.3] |
|
Wash solvent composition: |
2 mM ammonium acetate in water adjusted to pH 5.5 [±0.1] |
|
Analytical column: |
Atlantis Premier BEH C18 AX Column, 1.7 µm, 2.1 x 100 mm (p/n: 186009368) |
|
Analytical column temperature: |
40 oC |
|
Sample temperature: |
Room temperature |
|
Injection volume: |
3000 µL |
|
Analytical column flow rate: |
0.350 mL/min |
|
Mobile phase A: |
10 mM ammonium acetate in water adjusted to pH 5.4 [±0.1] with acetic acid |
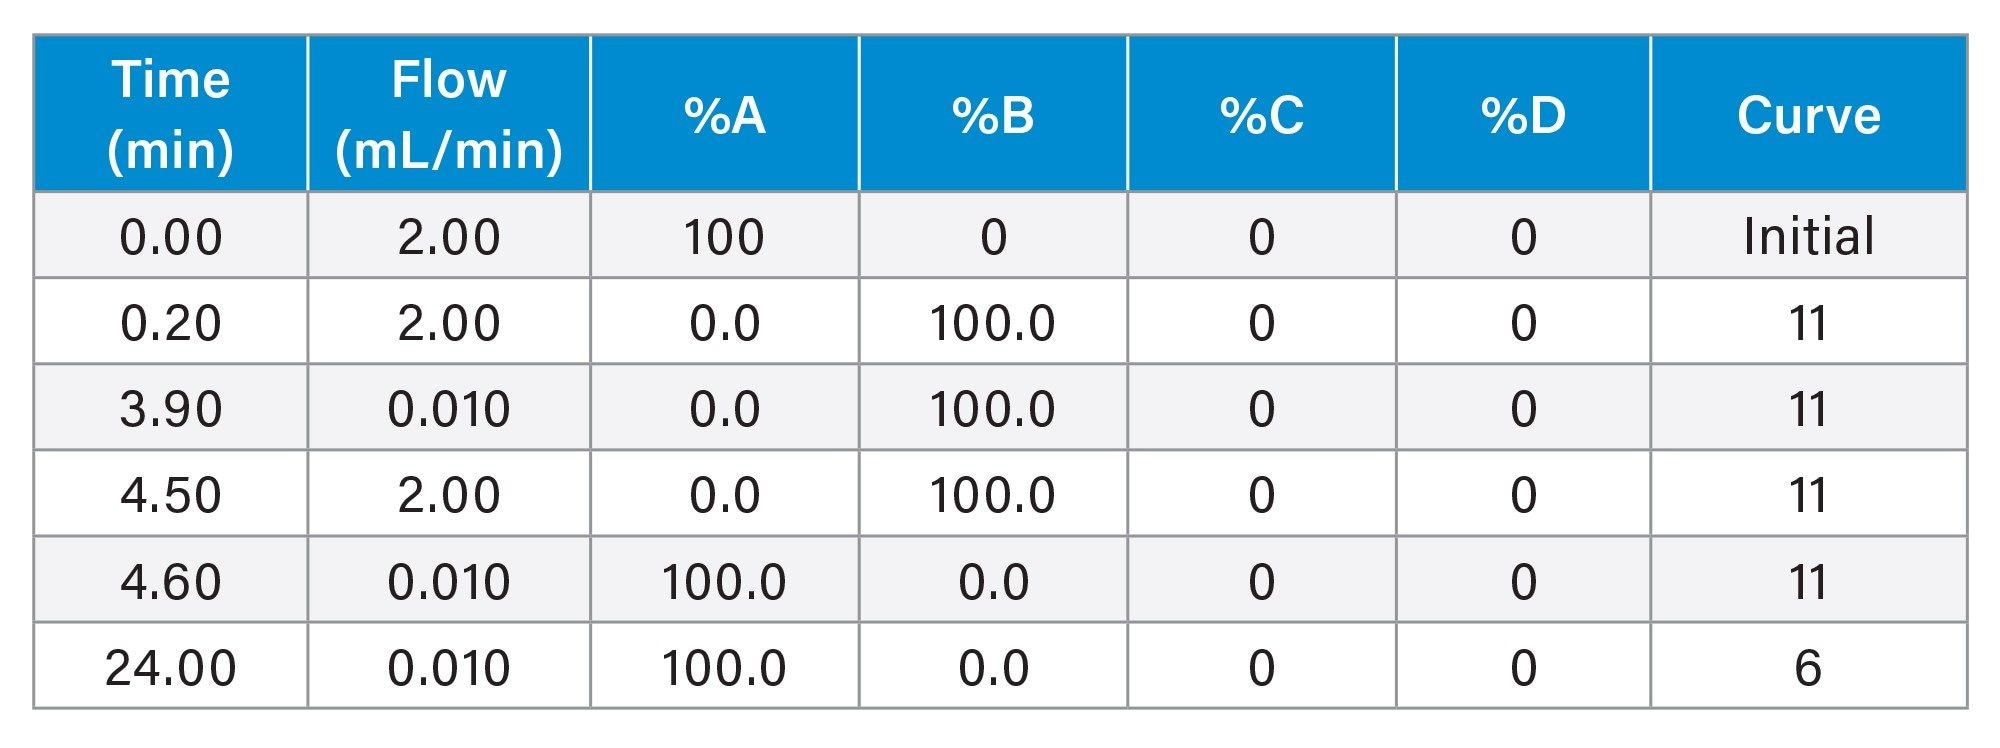
Gradient Table – QSM
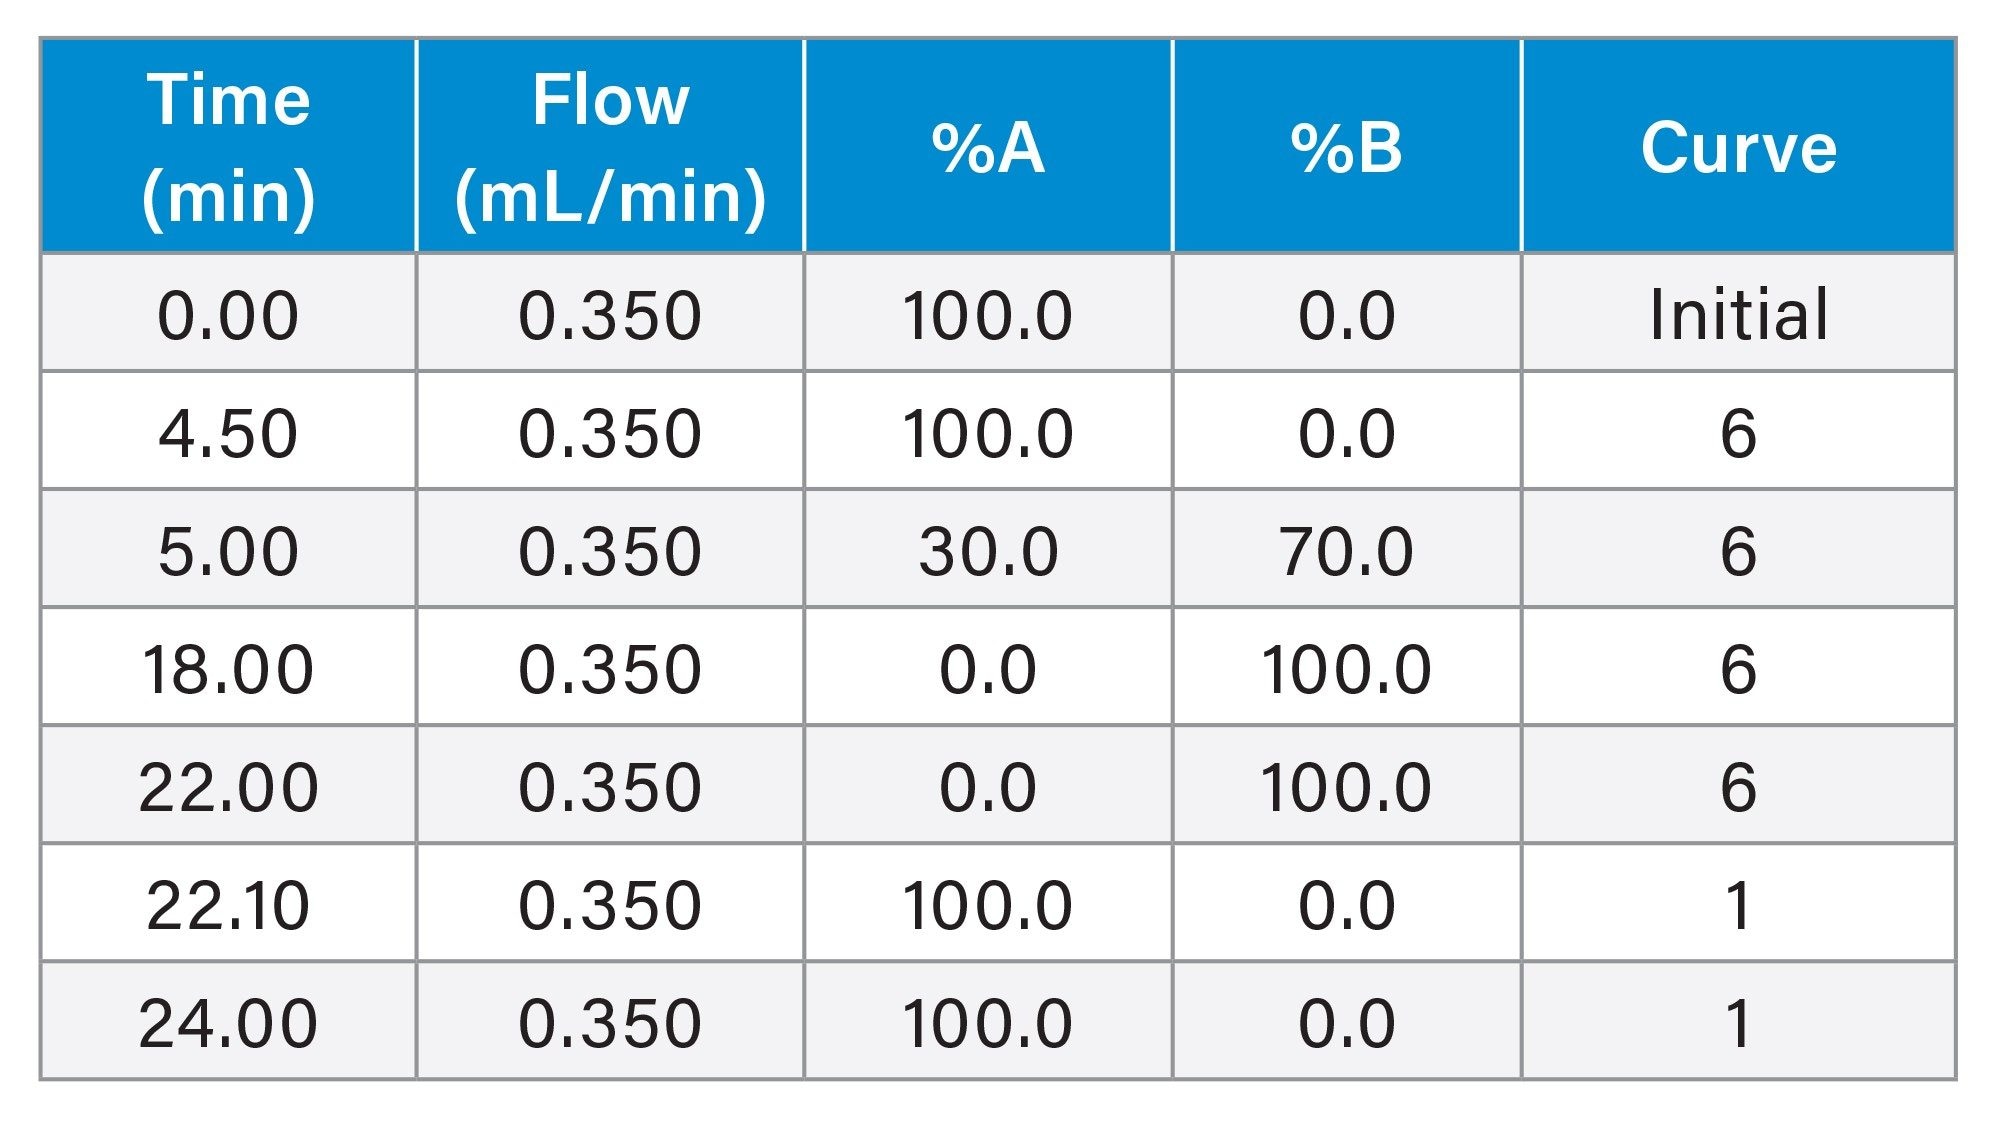
Gradient Table - BSM
MS Conditions
|
MS system: |
Xevo TQ-S micro Mass Spectrometer |
|
Ionization mode: |
UniSpray™ Source, positive/ negative mode |
|
Acquisition mode: |
MRM |
|
Impactor voltage: |
1 kV |
|
Desolvation temperature: |
450 oC |
|
Desolvation gas flow: |
900 L/hr |
|
Cone gas flow: |
50 L/hr |
|
Source temperature: |
120 oC |
|
Collision energy: |
Compound specific |
|
Cone voltage: |
Compound specific |
Data Management
|
Informatics: |
waters_connect for Quantitation Software |
Results and Discussion
Method Development
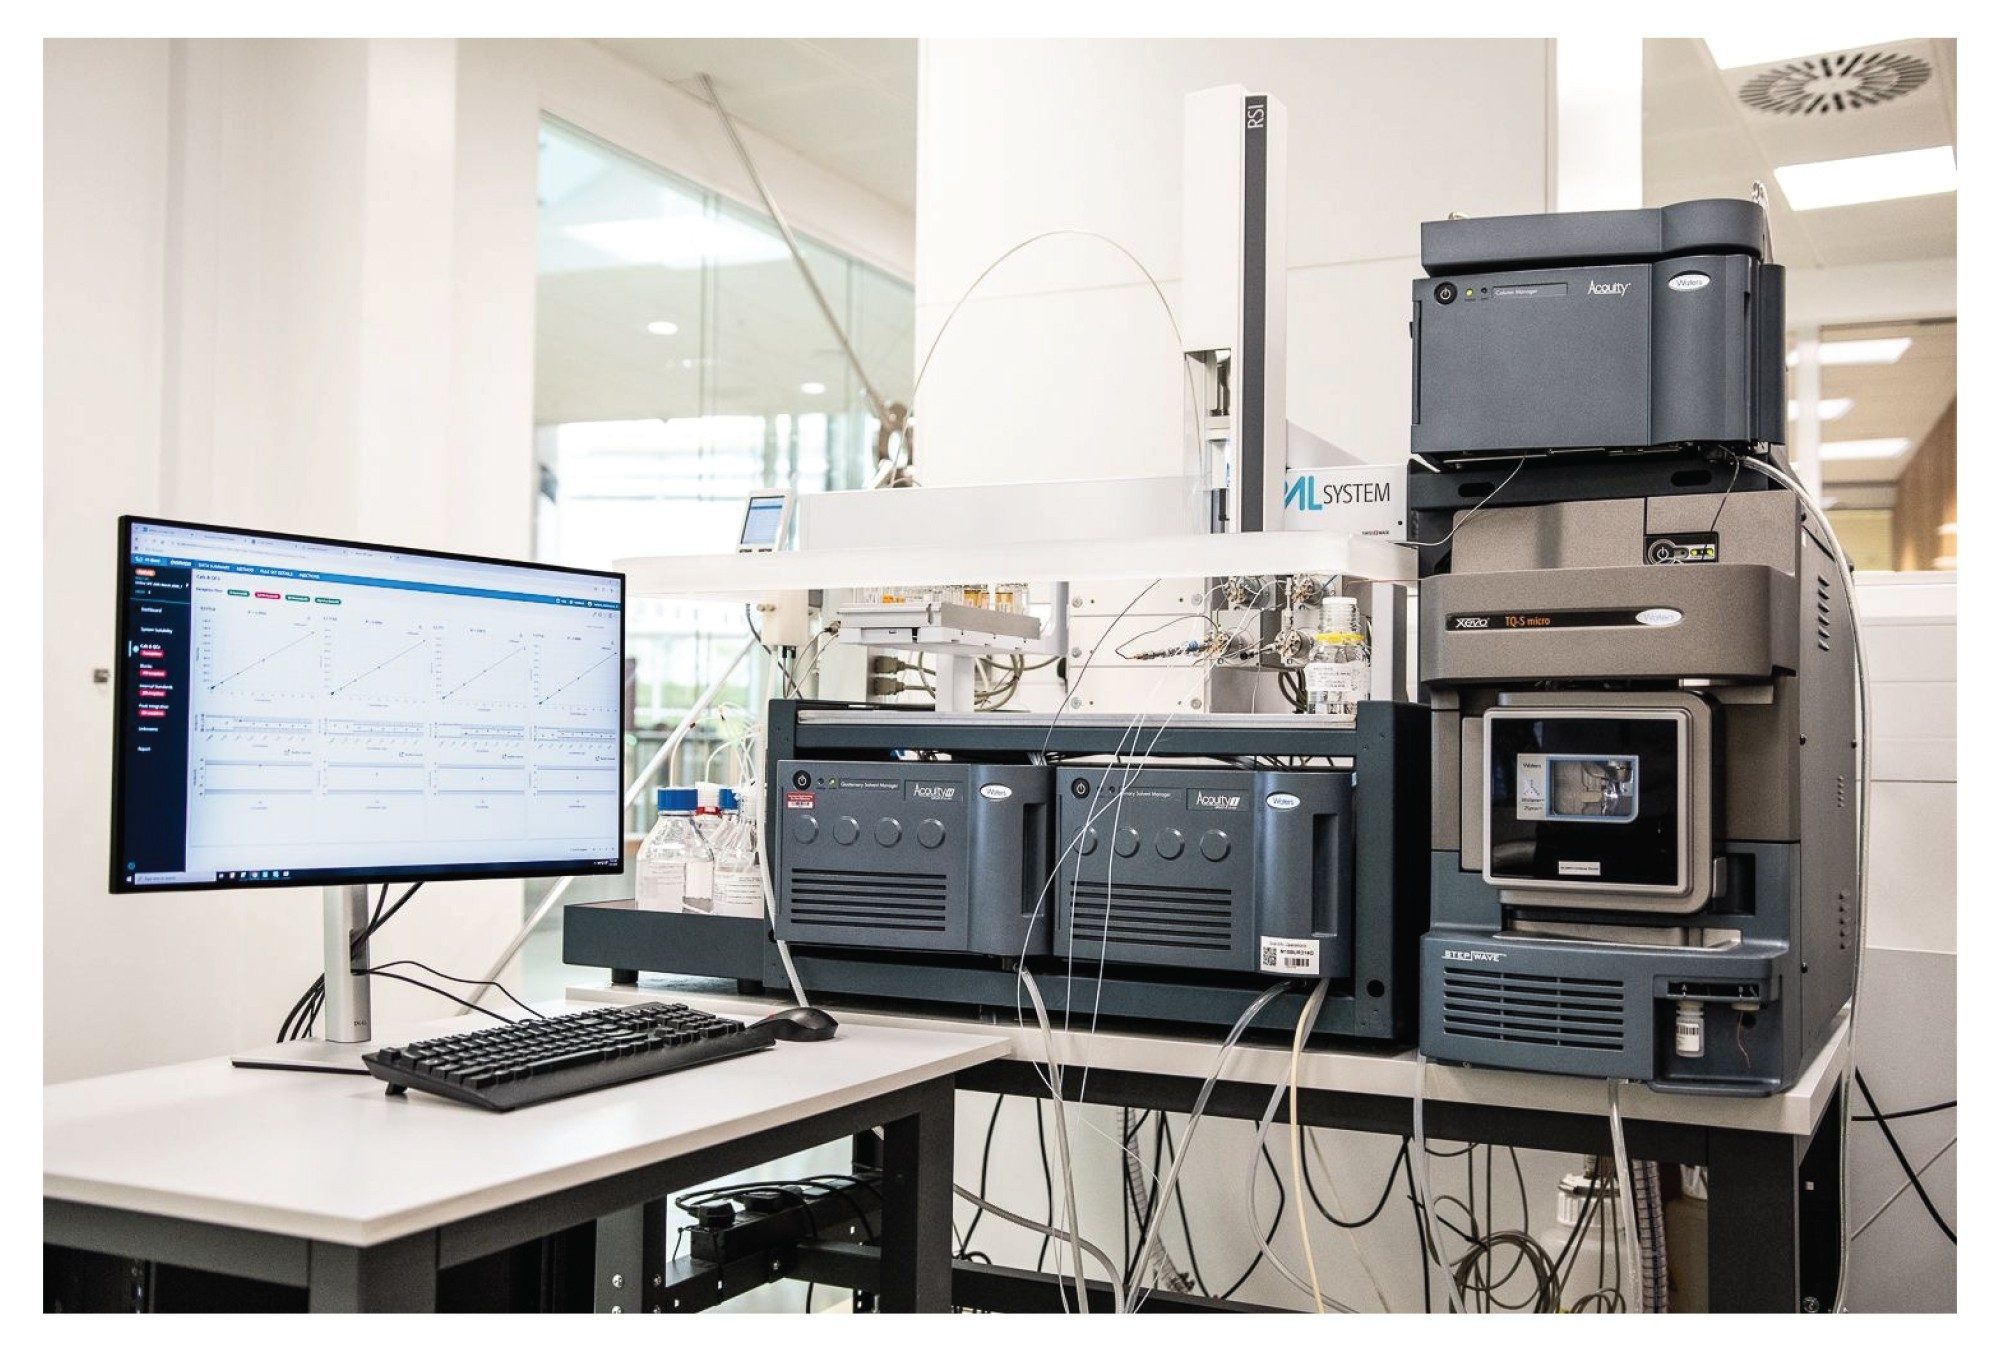
Automated online SPE was performed using a Waters Online SPE UPLC-MS/MS kit featuring two ACQUITY UPLC solvent managers, a CTC PAL-3 RSi sample manager (fitted with PFAS free parts), an ACQUITY UPLC Column Manager and Xevo TQ-S micro Mass Spectrometer controlled by waters_connect for Quantitation Software.
The CTC PAL RSi System was configured for online SPE operation using the dilutor tool running the ‘Waters Online SPE Single Column’ method script. All parts of the CTC PAL RSi System in contact with the sample and solvent flow path were fitted with ‘PFAS free’ parts (Figure 1).
Online SPE ‘Trap’ Column Chemistry
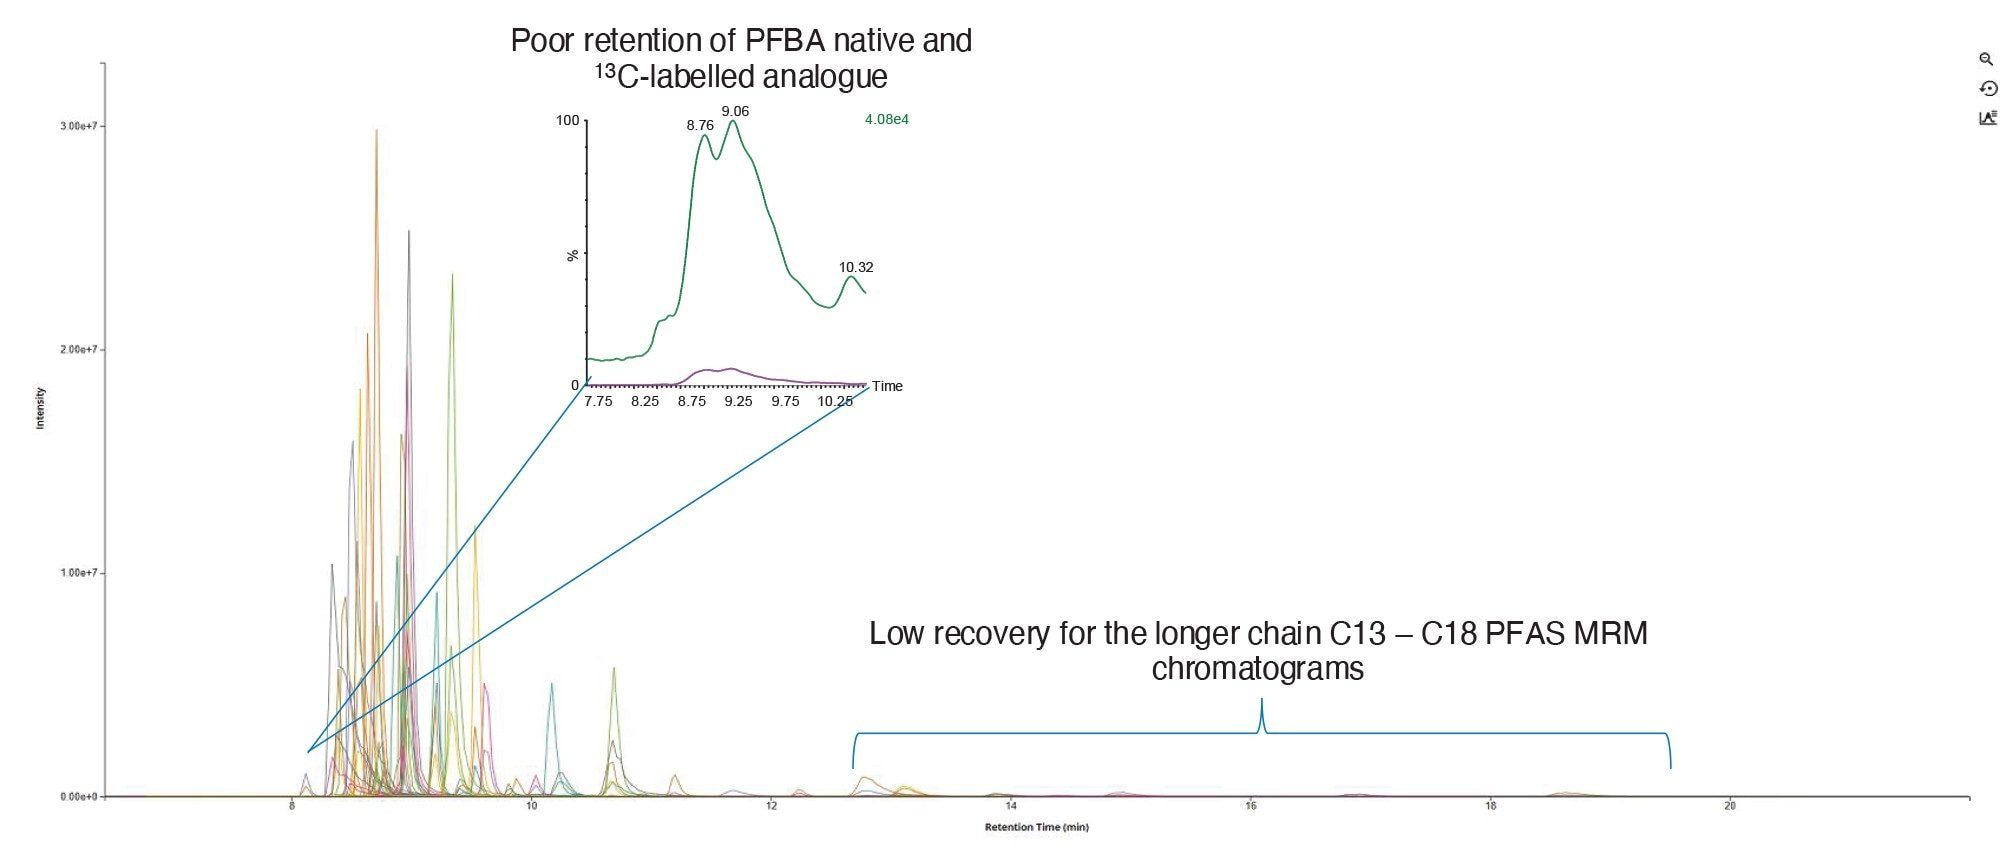
Initially, work was focused on developing conditions for the first dimension (SPE ‘trap’ Column). The choice of column chemistry was evaluated for the 48 target PFAS. Direct connect columns packed with different sorbents (with the following dimensions: 20 µm, 2.1 mm x 30 mm) including HLB, C18 and a custom Oasis mixed mode with reversed phase (RP) and WAX. As expected, neither the HLB nor C18 sorbents provided adequate performance for the 48 PFAS. Particularly affected were the shorter chain PFCAs and PFSAs with low/ negative pKa values showing poor retention as illustrated in Figure 2. In addition, the hydrophobic (van der Waals) interactions from the reversed phase chemistry were found to strongly retain the longer chain PFAS resulting in incompletion elution, low recovery and potential for carryover from the trap column in this configuration where the strength of the elution solvent is lower in comparison to offline SPE methods.
For these reasons, the mixed mode sorbent combining RP and WAX was selected for further development. The RP component provides sufficient hydrophobic retention of the perfluoroalkyl tail, and the WAX functionality selectively retains anionic PFAS through electrostatic interactions via the deprotonated carboxylate and sulfonate groups. The weak anion exchange mechanism can be turned on and off by modulating the solvent environment where the mixed mode sorbent is exposed to. Due to their very low pKa values, PFCAs and PFSAs behave as strong acids and remain fully ionized (negatively charged) across the trap-column operating pH range of 2–10. As a result, their ionization state is largely unaffected by changes in the external pH environment.
2D Online SPE Method Development
In 2D chromatography systems, the ‘elution solvent’ serves two purposes, firstly to disrupt the binding mechanism between the trap column and the retained analyte(s) and secondly, as the mobile phase used for separation on the second dimension (analytical column). This often results in the introduction of the analytes to the second dimension in a compromised solvent composition, for example, a high organic solvent composition resulting in poor retention and/or band broadening of the more polar, earlier eluting analytes. This can result in reduced overall sensitivity and peak shape distortions e.g., peak fronting/tailing and splitting making automated peak integration more challenging. One solution is the use of At Column Dilution (ACD) whereby the sample eluent from the first dimension, in high organic solvent, is combined with a secondary ‘weaker’ mobile phase stream prior to the second dimension. This approach reduces the effective solvent strength at the head of the analytical column which allows the momentary retention and focusing for the more polar analytes. However, ACD adds complexity and cost to the hardware configuration due to the requirement for an additional pump (for the dilution flow path) and controlled mixing point near the analytical column inlet.
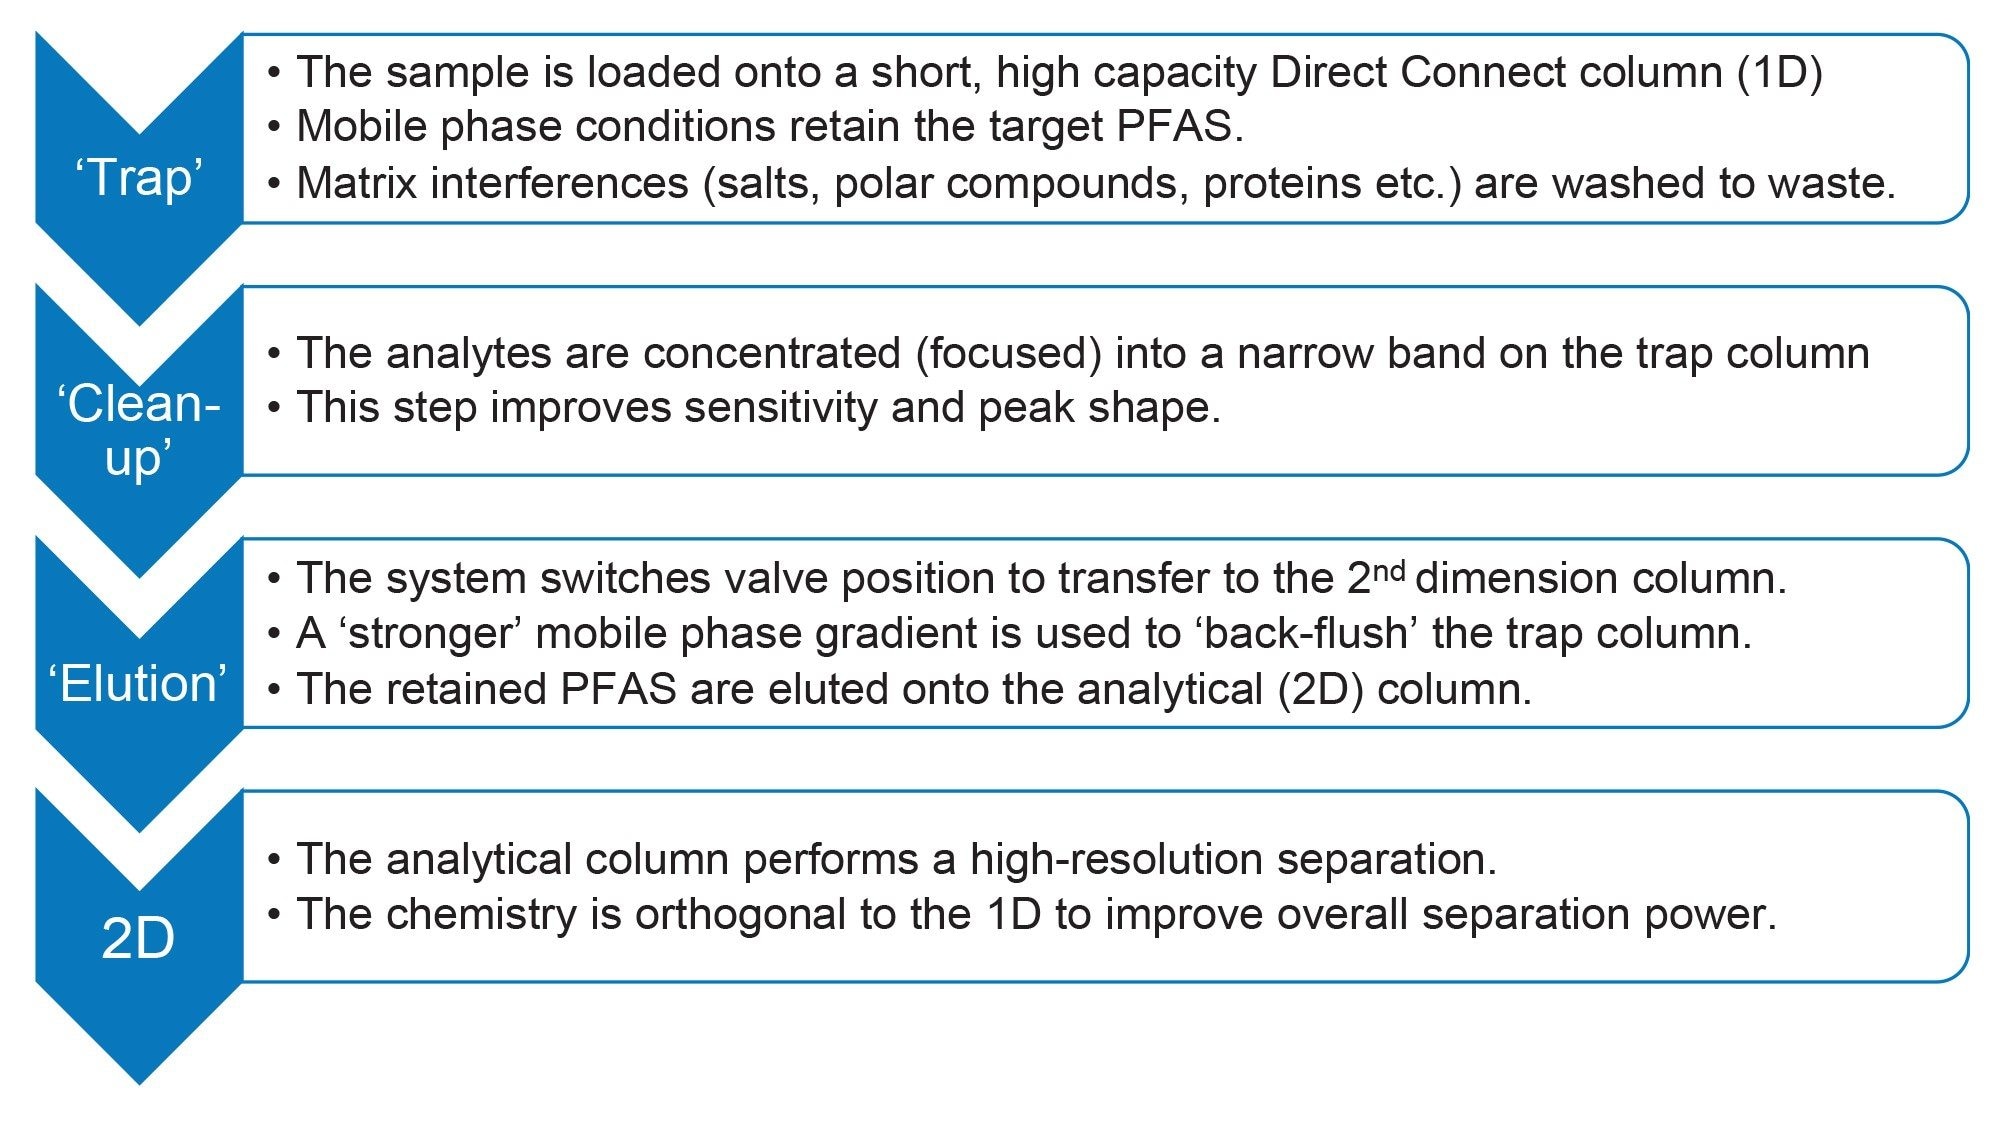
An alternative strategy to ACD was investigated whereby the solvent strength (elutrophic and ionic) and pH were optimized to control the analyte focusing upstream to minimize the solvent mismatch as much as possible. The QSM pump was used to deliver the load and wash solvents via solvent lines A and B, respectively. The sample was loaded using weak mobile phase conditions to retain the analytes on the trap column. To activate the trap column weak anion exchange mechanism, the aqueous load solvent was adjusted to pH 3.0 [±0.3]. The loading solvent rate was also found to be an important parameter for analyte retention. The wash solvent composition was optimized to maximize the analyte retention and focusing whilst effectively washing off weakly or non-retained matrix components. The wash step was found to be critical for maintaining low background noise, stable retention times and reducing carryover. Following a valve switching event, the BSM pump was used to deliver the solvent gradient for ‘back flush’ elution from the trap column and subsequent chromatographic separation on to the analytical column. A mobile phase pH gradient comprising 10 mM ammonium acetate in water adjusted to pH 5.5 (solvent line A) and acetonitrile containing 0.1% ammonium hydroxide (c. pH 10.0) (solvent line B) was developed. Following an initial hold period, the gradient was started at 30% aqueous and ramped to 100% organic over 17 minutes. A column wash step at 100% organic was performed before returning to the starting conditions and re-equilibration giving an overall run time of 24 minutes per sample. Figure 3 shows a schematic representation of four phases optimized in the 2D online SPE workflow.
A significant part of the method development was focused on the conditions for the ‘back flush’ elution from the trap column to ensure adequate retention and recovery for the target PFAS was achieved along with compatibility of the gradient conditions for separation on the second dimension, analytical column. The ionic strength of the aqueous ammonium acetate (mobile phase A) was evaluated at 2, 5 and 10 mM. Peak shape, in terms of reduced tailing factor was found to improve with higher ionic strength with only a minor impact on overall sensitivity (data not shown). For this reason, 10 mM ammonium acetate was selected as the optimal ionic strength for the 2D configuration.
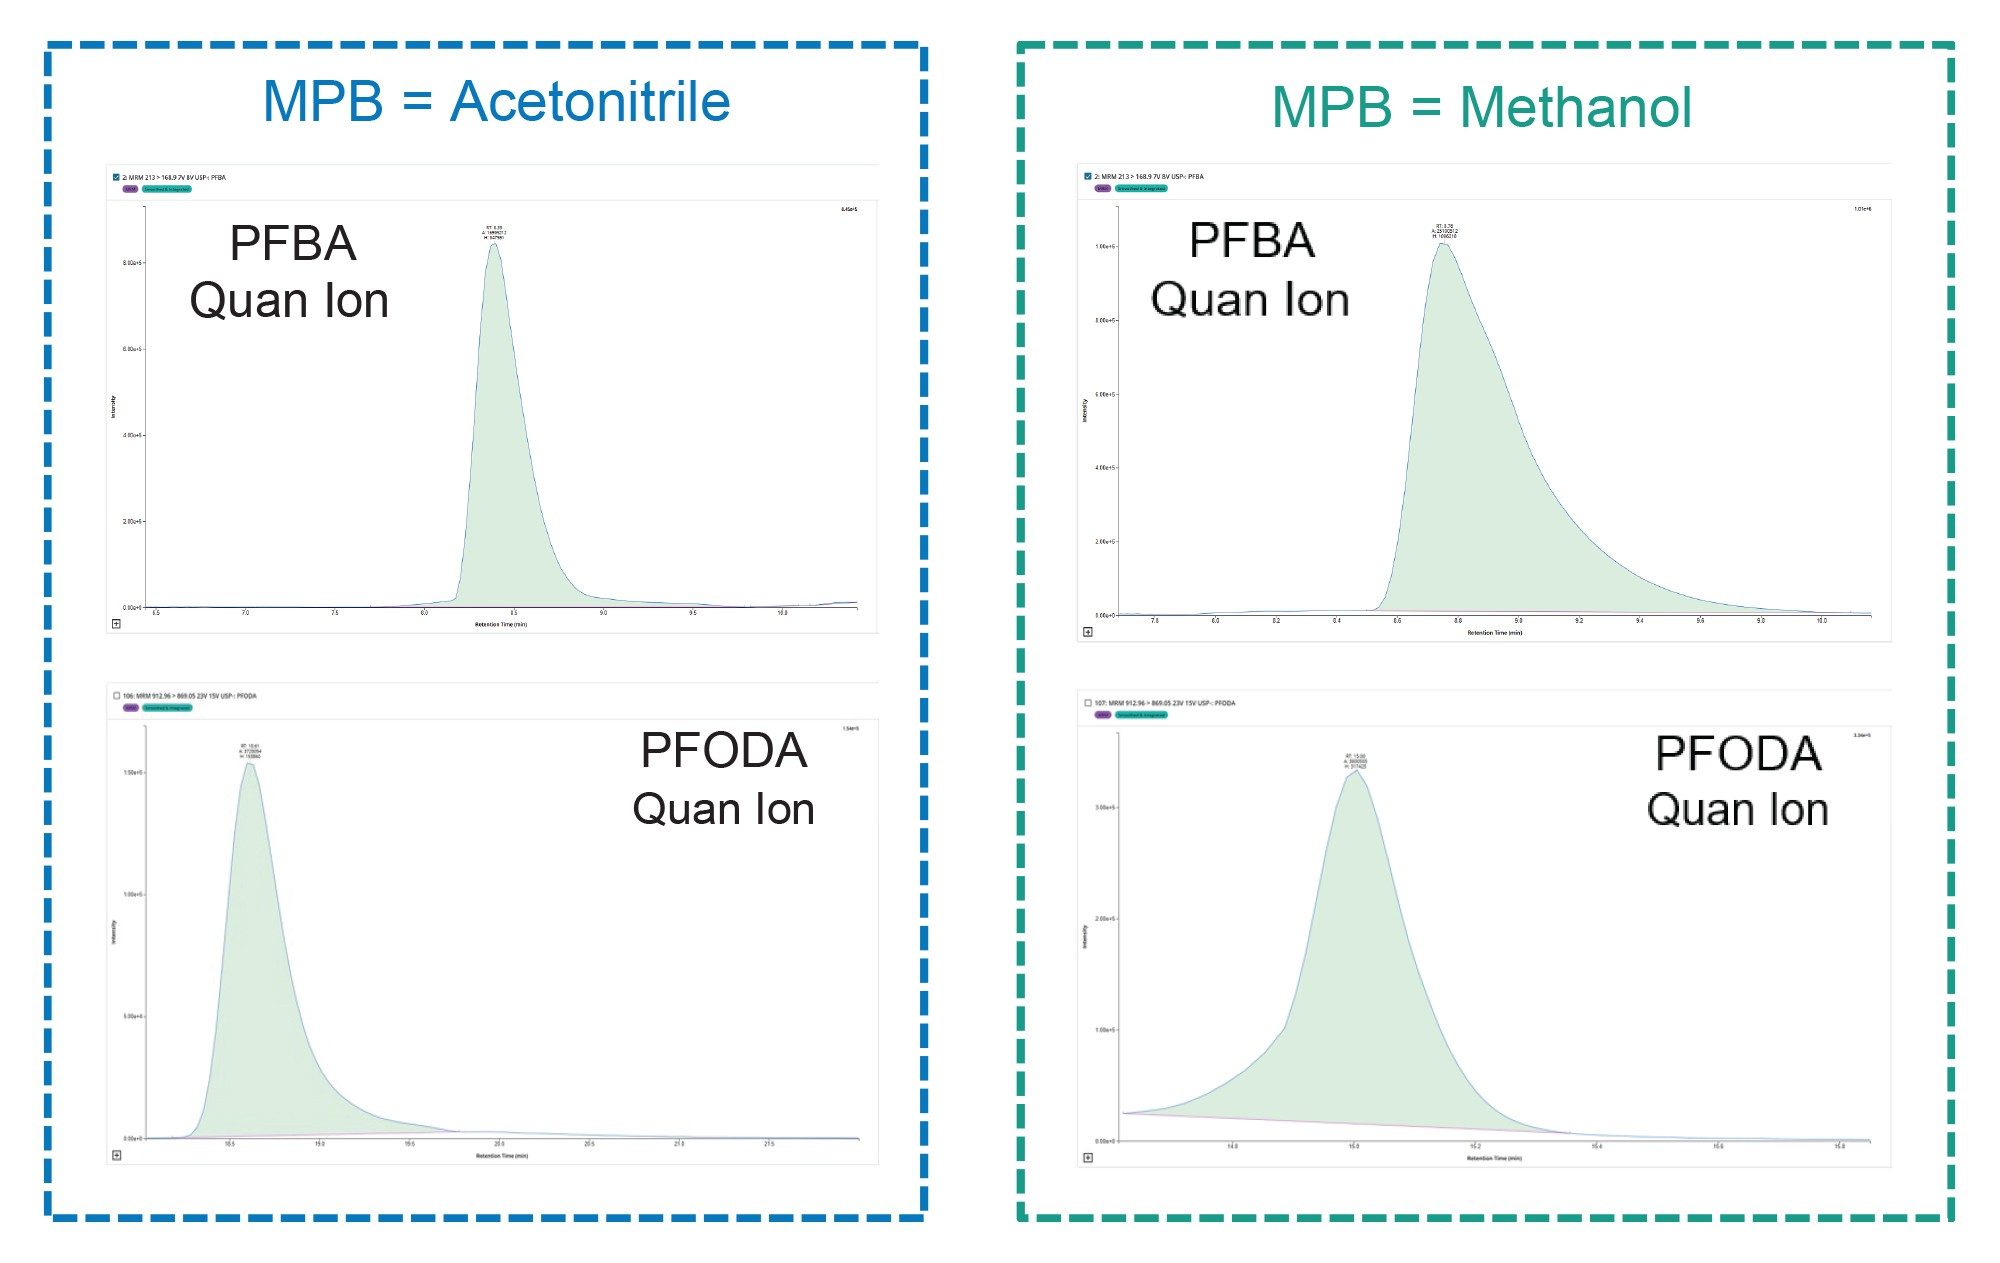
The pH of mobile phase A was then optimized. A pH of 5.5, close to the pKa of the anionic exchange ligand, was found to be best compromise for retention of the short chain anionic PFAS whilst allowing complete recovery from the trap column during the pH gradient mediated elution phase. High pH was introduced into the gradient via mobile phase B. At pHs above pKa, the anion exchange ligand becomes progressively more deprotonated thus disrupting the ionic interactions resulting in the elution of the bound PFAS. Methanol and acetonitrile for use as the organic solvent (mobile phase B) were compared in terms of peak shape and chromatographic resolution. Acetonitrile was found to give the most gaussian peak shapes, reduce retention times and improve resolution in terms of separation of the branched and linear isomers of PFOS. Figure 4 shows the peak shape obtained for PFBA and PFOA (the first and last eluting PFAS) in acetonitrile and methanol. In addition, both the background chemical noise levels and the system back pressure were found to be lower in acetonitrile as compared to methanol.
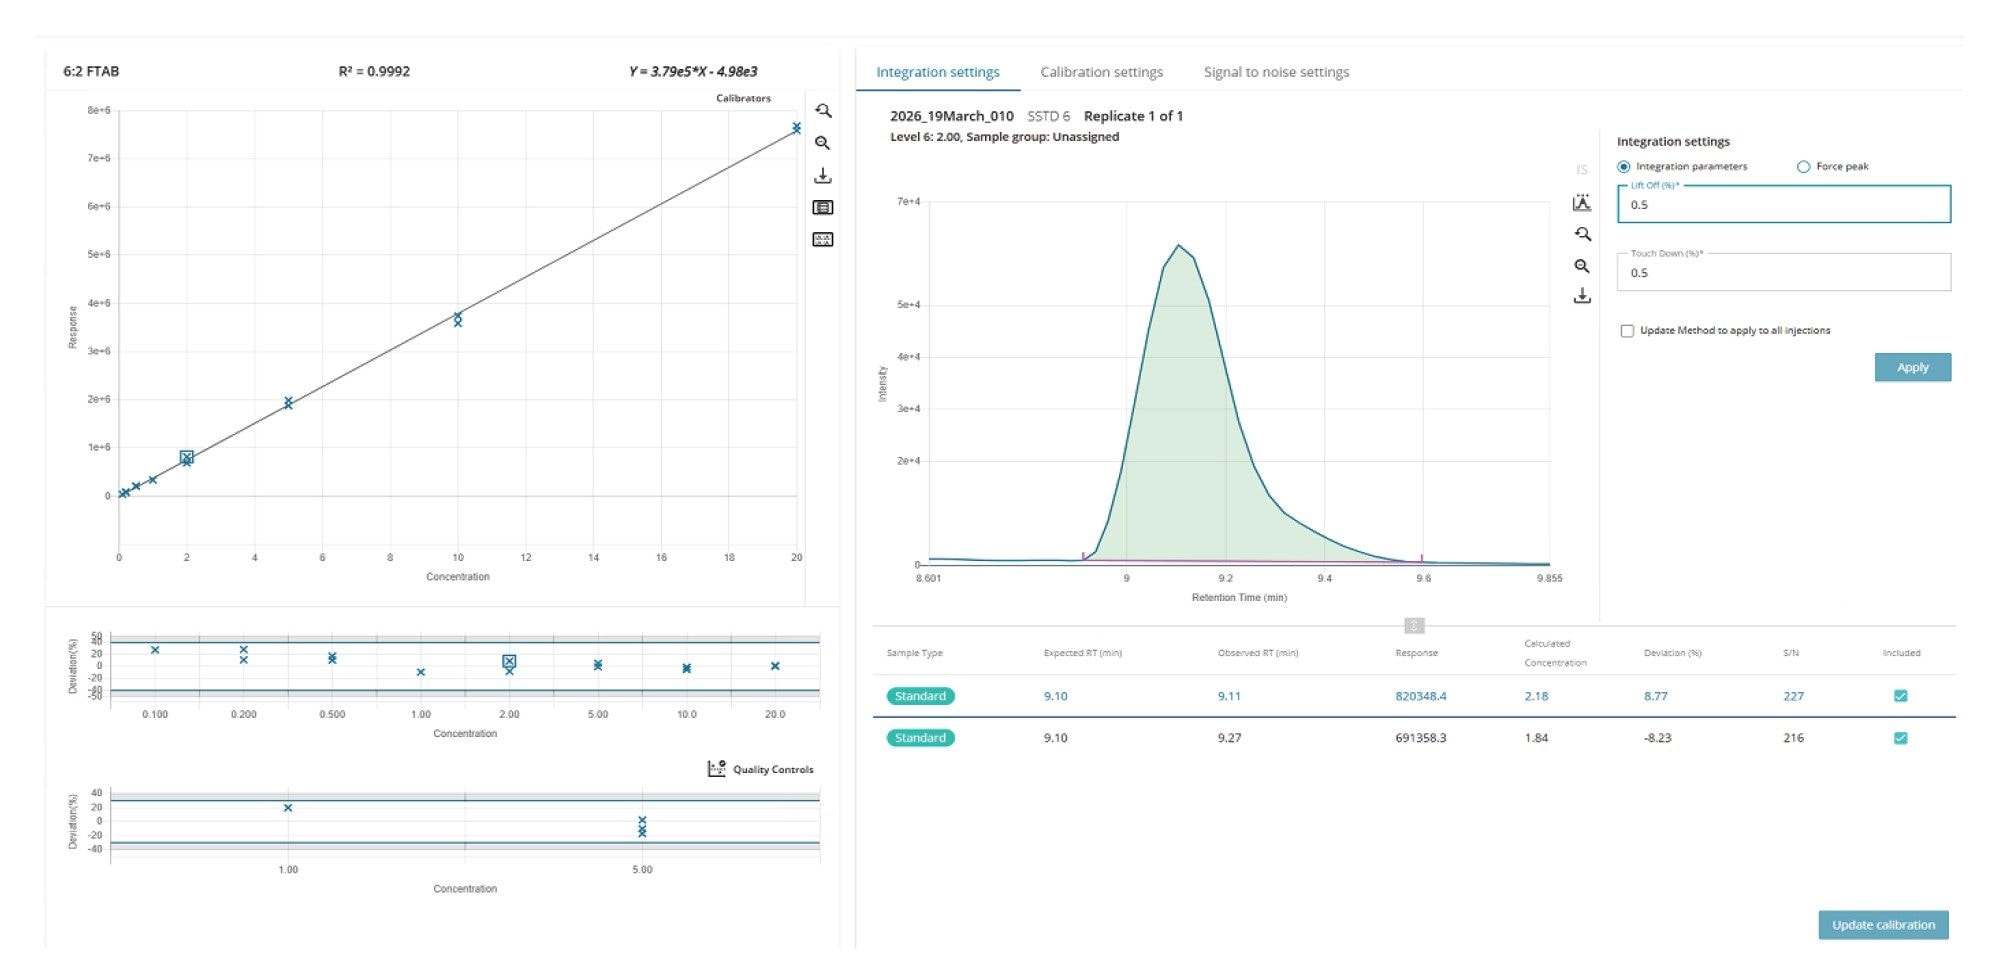
The performance of the neutral and zwitterionic PFAS defined in the DWI 48 list was investigated. Under the previously optimized loading solvent condition of pH 5.5 (for anionic PFAS) of the zwitterionic species, 6:2 FTAB carries a net neutral charge. On the mixed mode WAX sorbent, the retention mechanism for neutral species is primarily driven by hydrophobic interactions between the perfluoroalkyl chain and the reversed phase backbone. In comparison to the anionic PFAS, the neutral and zwitterionic compounds showed weaker retention on the mixed mode WAX sorbent and are more susceptible to breakthrough during the loading step and losses during the washing step. Figure 5 shows excellent performance for 6:2 FTAB across the calibration range of 0.1 to 20 ng/L. The residual deviation for both calibration standards and QC controls at 1 and 5 ng/L are within ±25%.
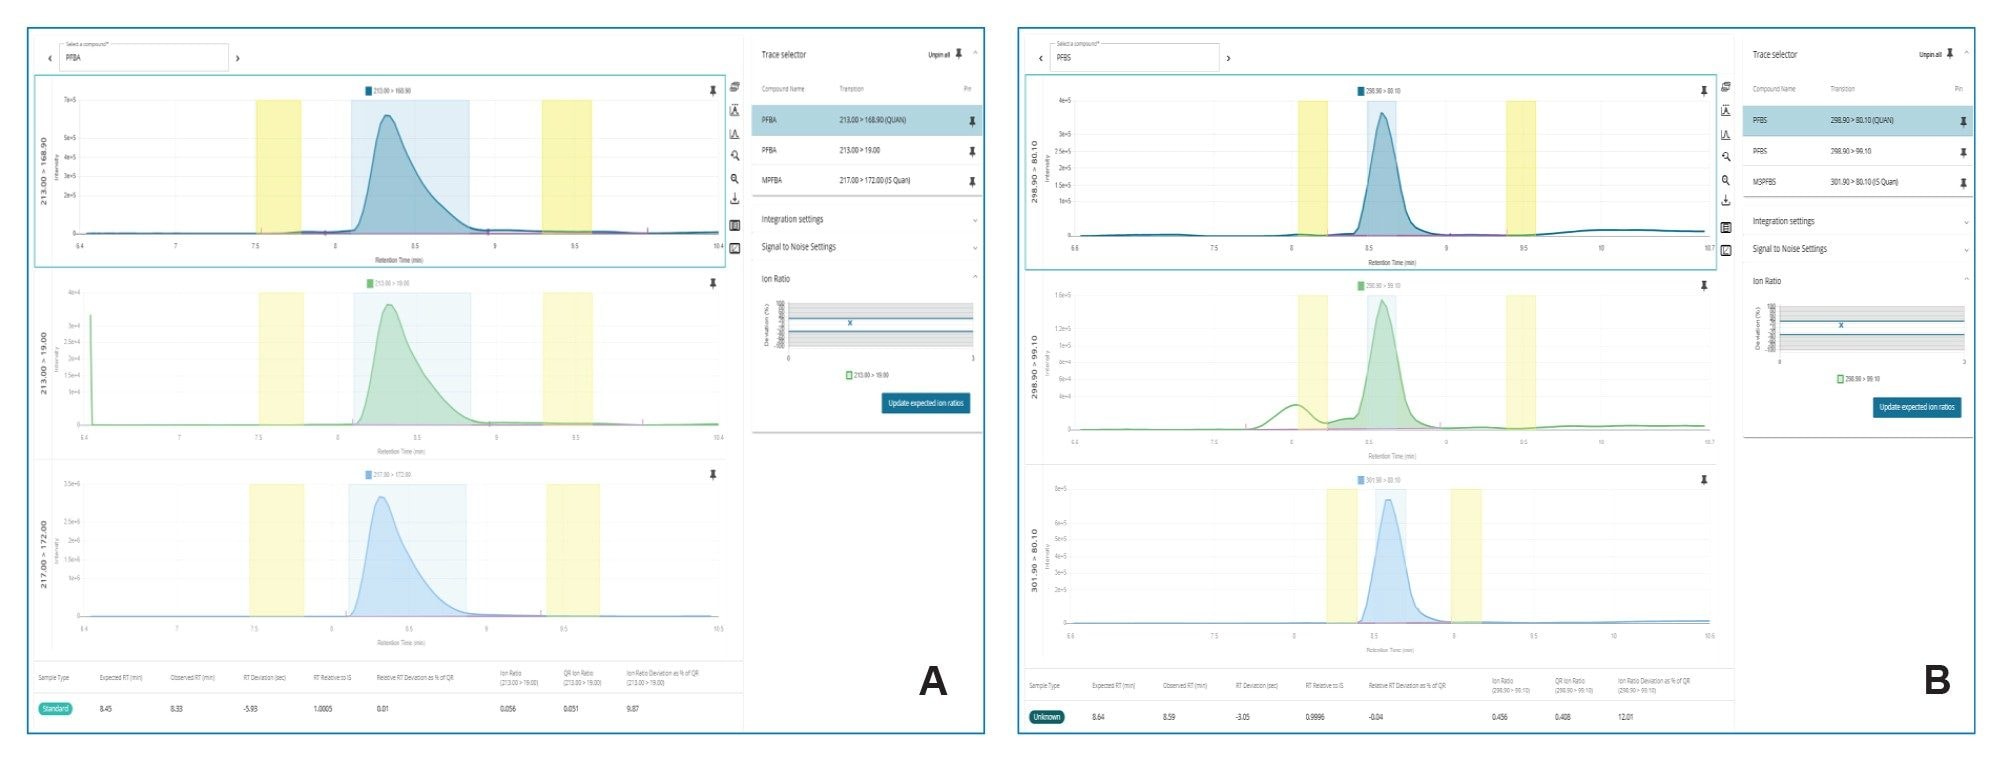
In addition to the 48 native PFAS, MRM functions for a mix of 24 isotopically labeled (13C) PFAS internal standards were included. A fixed volume of the ILIS mix was added to the autosampler vials for all relevant sample types. The average peak width for all PFAS was calculated and used by the acquisition method editor (AME) application to determine the optimum dwell time (ms) for each transition to achieve a minimum of 12 data points per peak. Figure 6 shows example MRM transitions and associated ILIS for the early eluting PFBA and PFBS. MS Quan Application automatically defines the signal and noise regions and displays the signal to noise (S/N) for each transition. The acceptable ion ratio range is also plotted for each sample in this view.
Background and Carryover
As the final phase of method developed, the background level of PFAS originating from the hardware and solvents was assessed. ‘PFAS free’ parts including PEEK tubing were used on the CTC PAL RSi and BSM Systems. The CTC PAL RSi setup including dilutor port wash steps and solvent compositions were optimized along with other sample parameters including the front and rear air gaps to minimize carryover. An isolator column (Atlantis Premier BEH C18 AX 5 µm, 2.1 x 50 mm Column) was installed after the solvent mixing unit on the BSM pump. In this configuration, the system background PFAS levels were shown to be negligible.
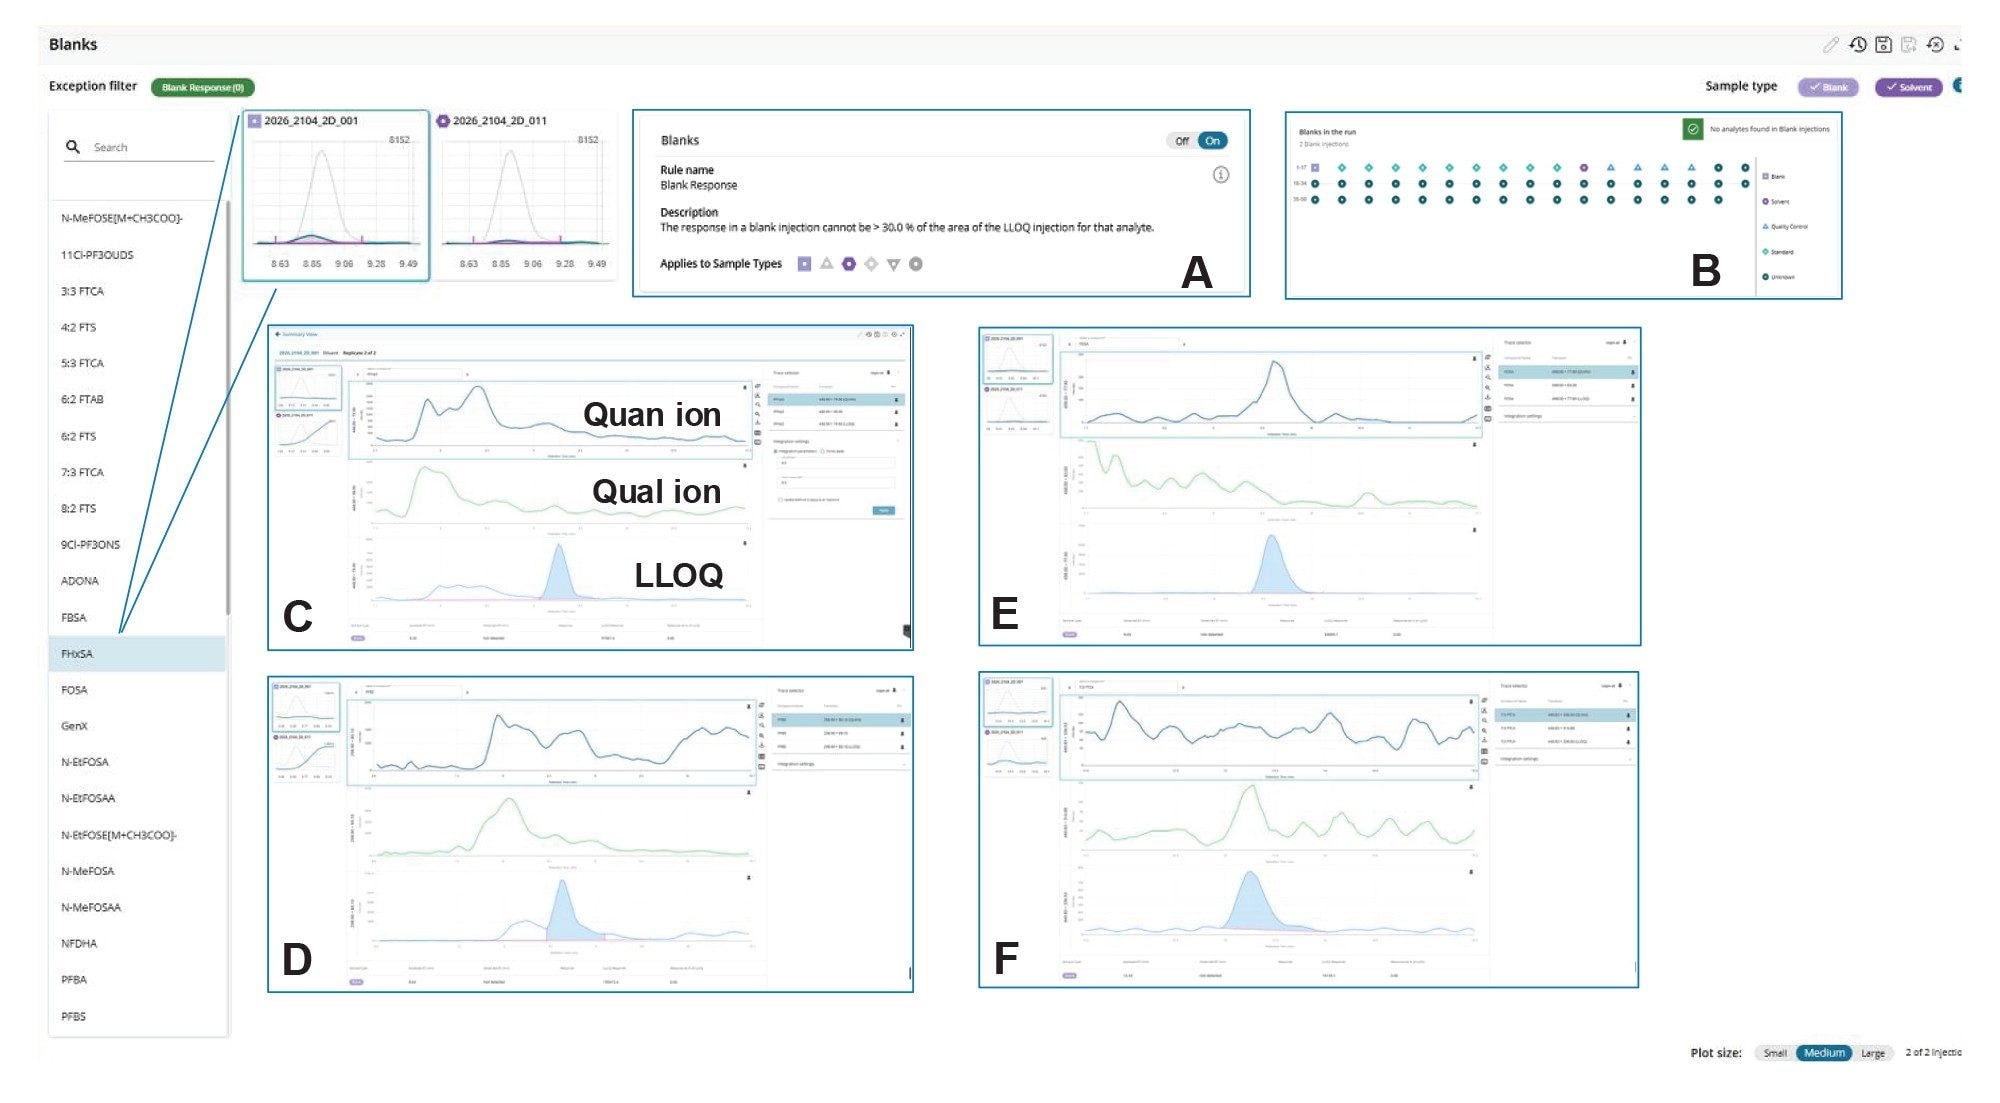
Carryover in solvent following injection of the top concentration of PFAS standard was assessed. MS Quan ‘Review by Exception’ workflow automatically calculates any concentration in the blank and solvent sample types, exceeding the threshold value, as a percentage of the lowest limit of quantitation (LLOQ). Immediately following injection of the top standard (20 ng/L), no PFAS exceeding 30% of its respective LLOQ was observed in accordance with the EPA 1633 recommendations for blank acceptance criteria (Figure 7).
Method Validation Phase
Method performance was then evaluated in various environmental water types including drinking water, river water and ground water. The following parameters including linearity, LLOQ, repeatability using spiked river water and accuracy using a CRM were investigated. The longer-term stability of the method over an extended period of continuous analysis was also investigated.
Linearity and LLOQs
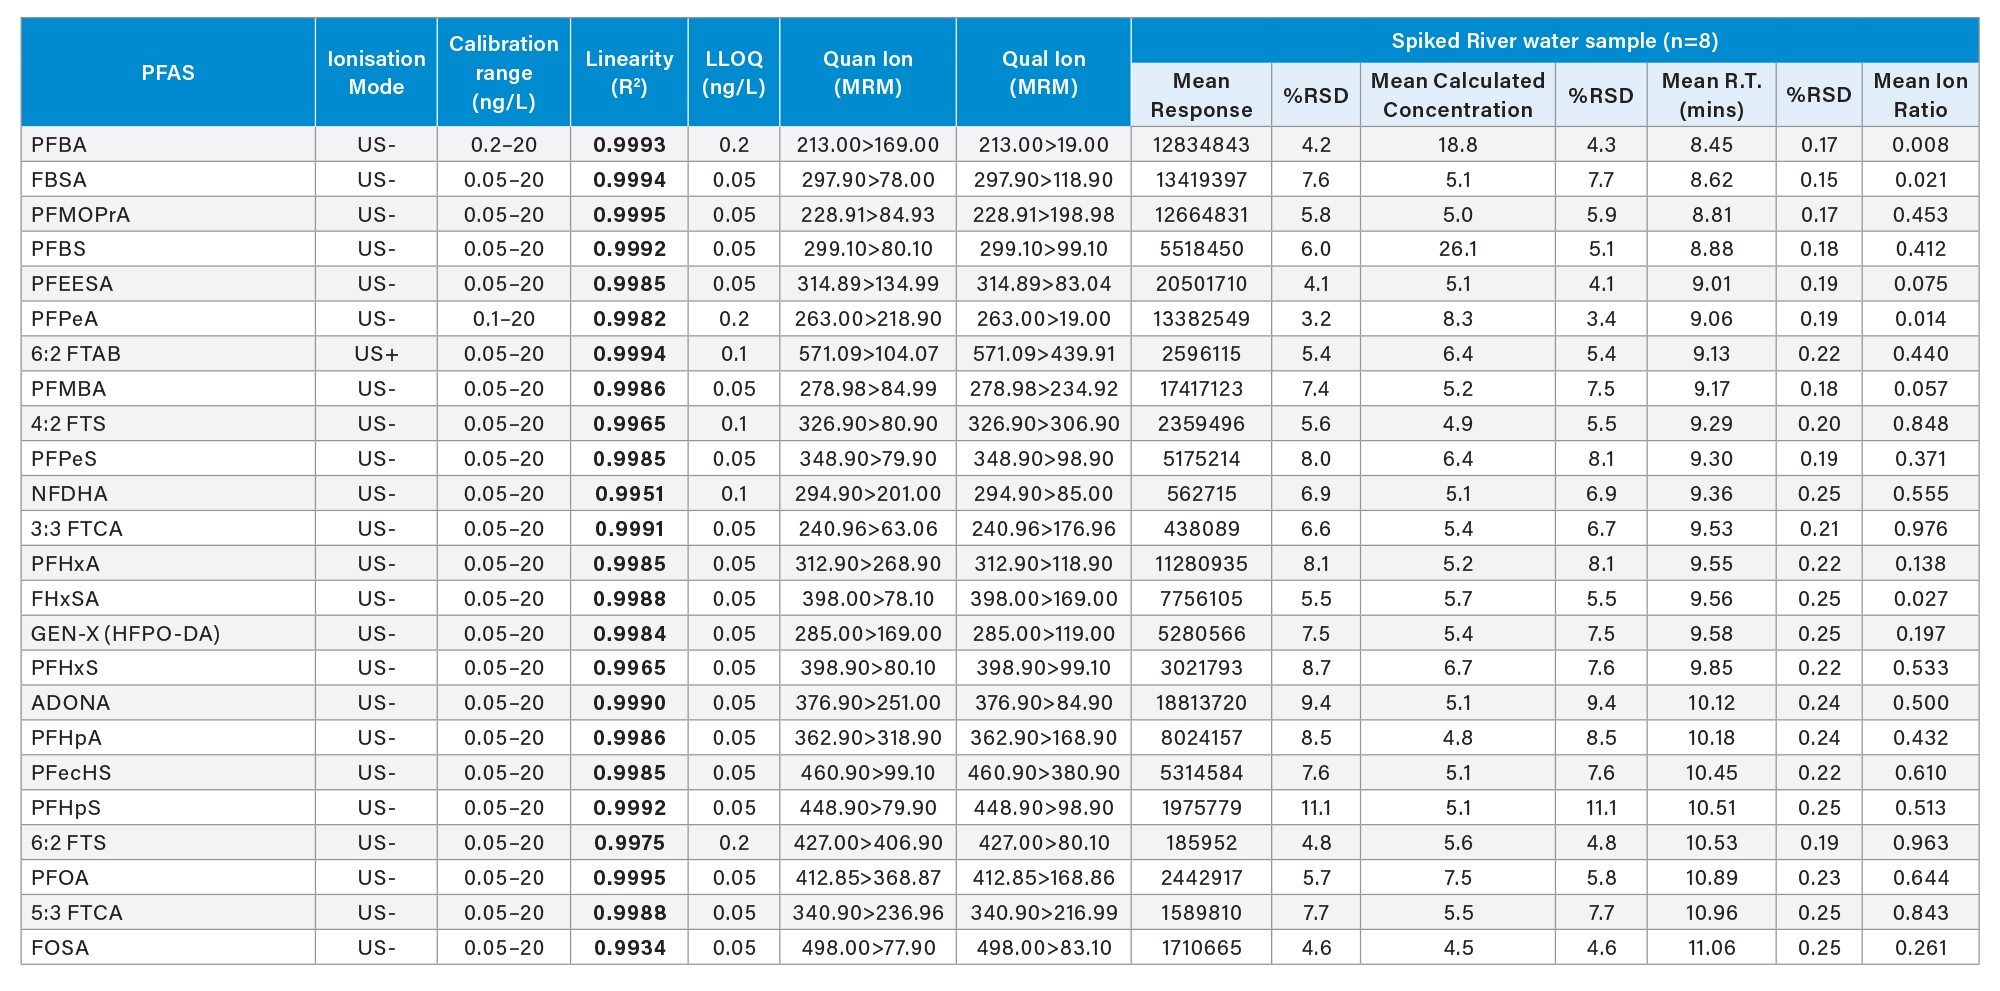
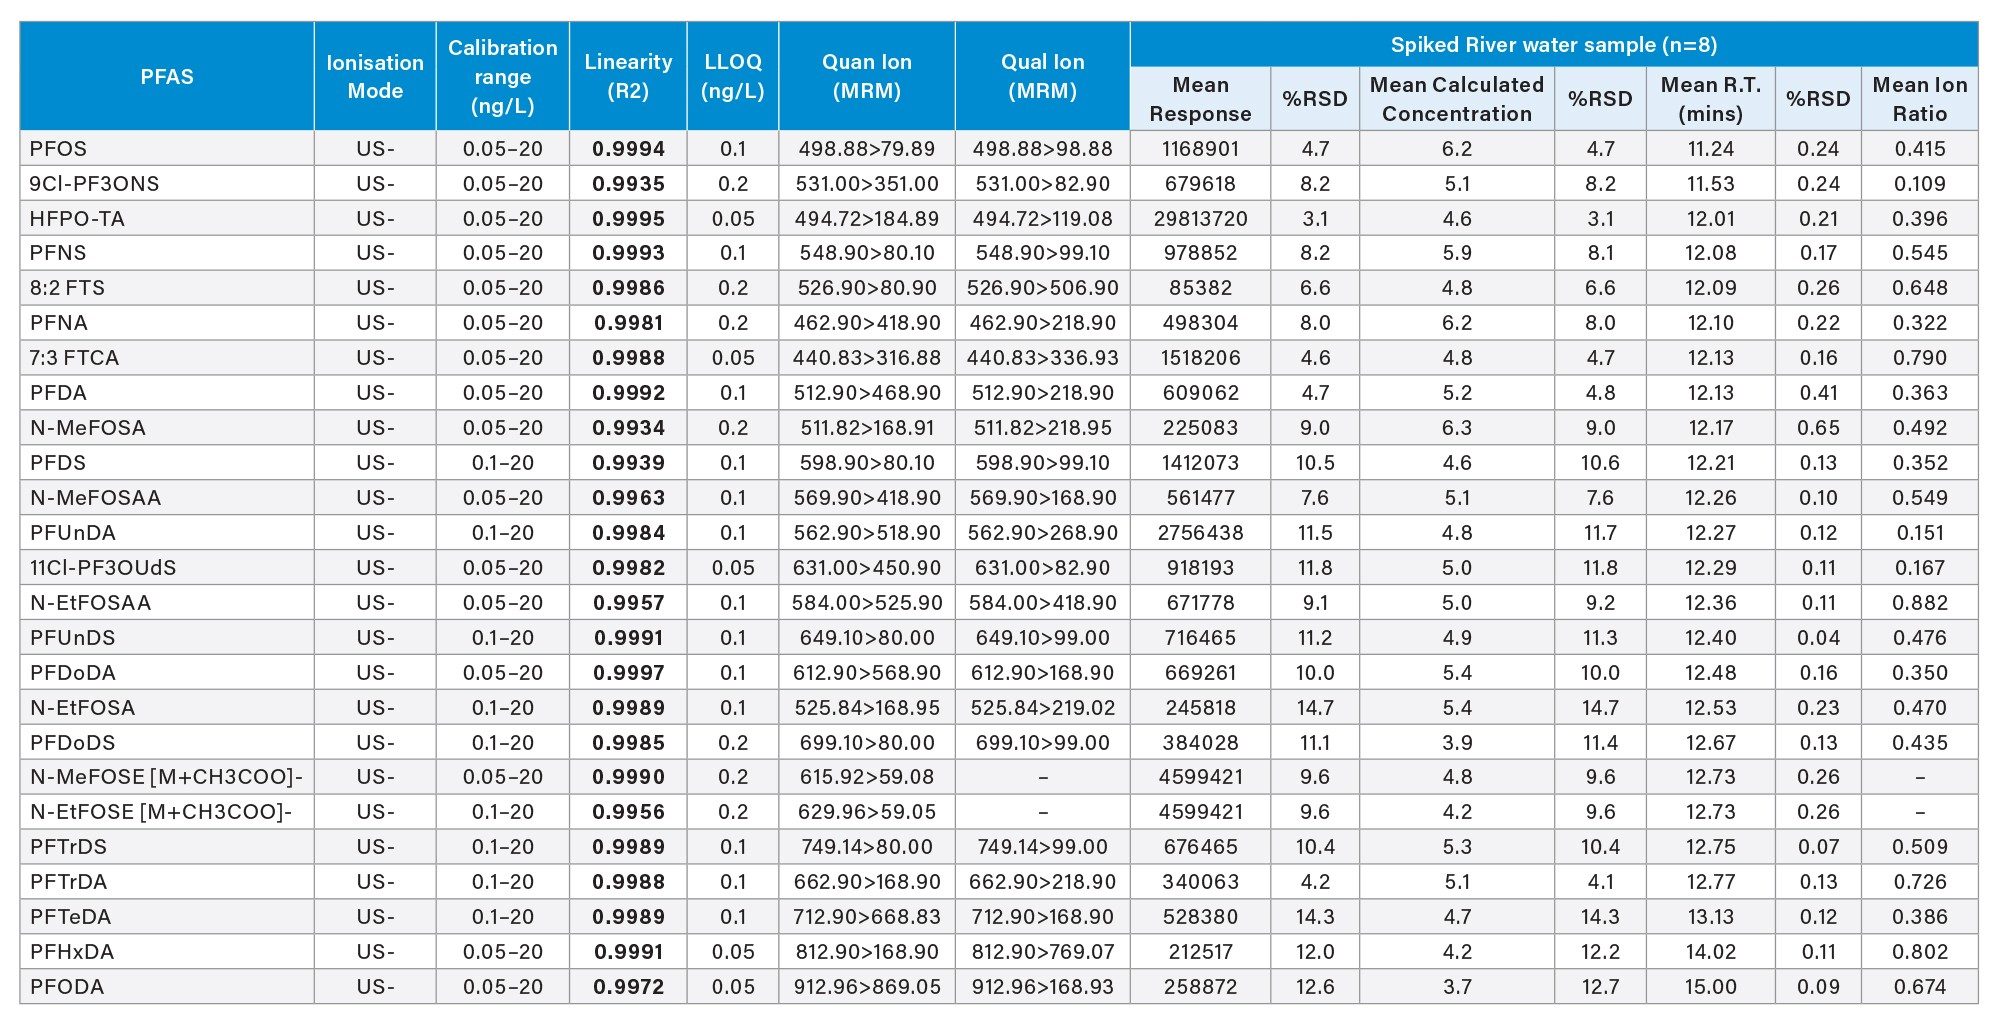
A series of standards were prepared in laboratory grade water between the concentration range of 0.05 to 20 ng/L. The standard series along with various blanks and spiked QC samples were analyzed in duplicate using the optimized conditions. The analytical batch ran continuously for a 12-hour period. MS Quan Application was used to plot the calibration curves. For all 48 PFAS, an R2 of greater than 0.99 was achieved. The LLOQs for each PFAS were determined from this data set and defined as the lowest calibration standard achieving the confirmatory criteria of S:N >10 for both quantifier and qualifier ions and an ion ratio within ±30% of the expected value. Two MRM transitions were monitored for all PFAS with the exceptions of N-MeFOSE and N-EtFOSE. The LLOQs ranged from 0.05 to 0.2 ng/L (Tables 1a and 1b).
Accuracy
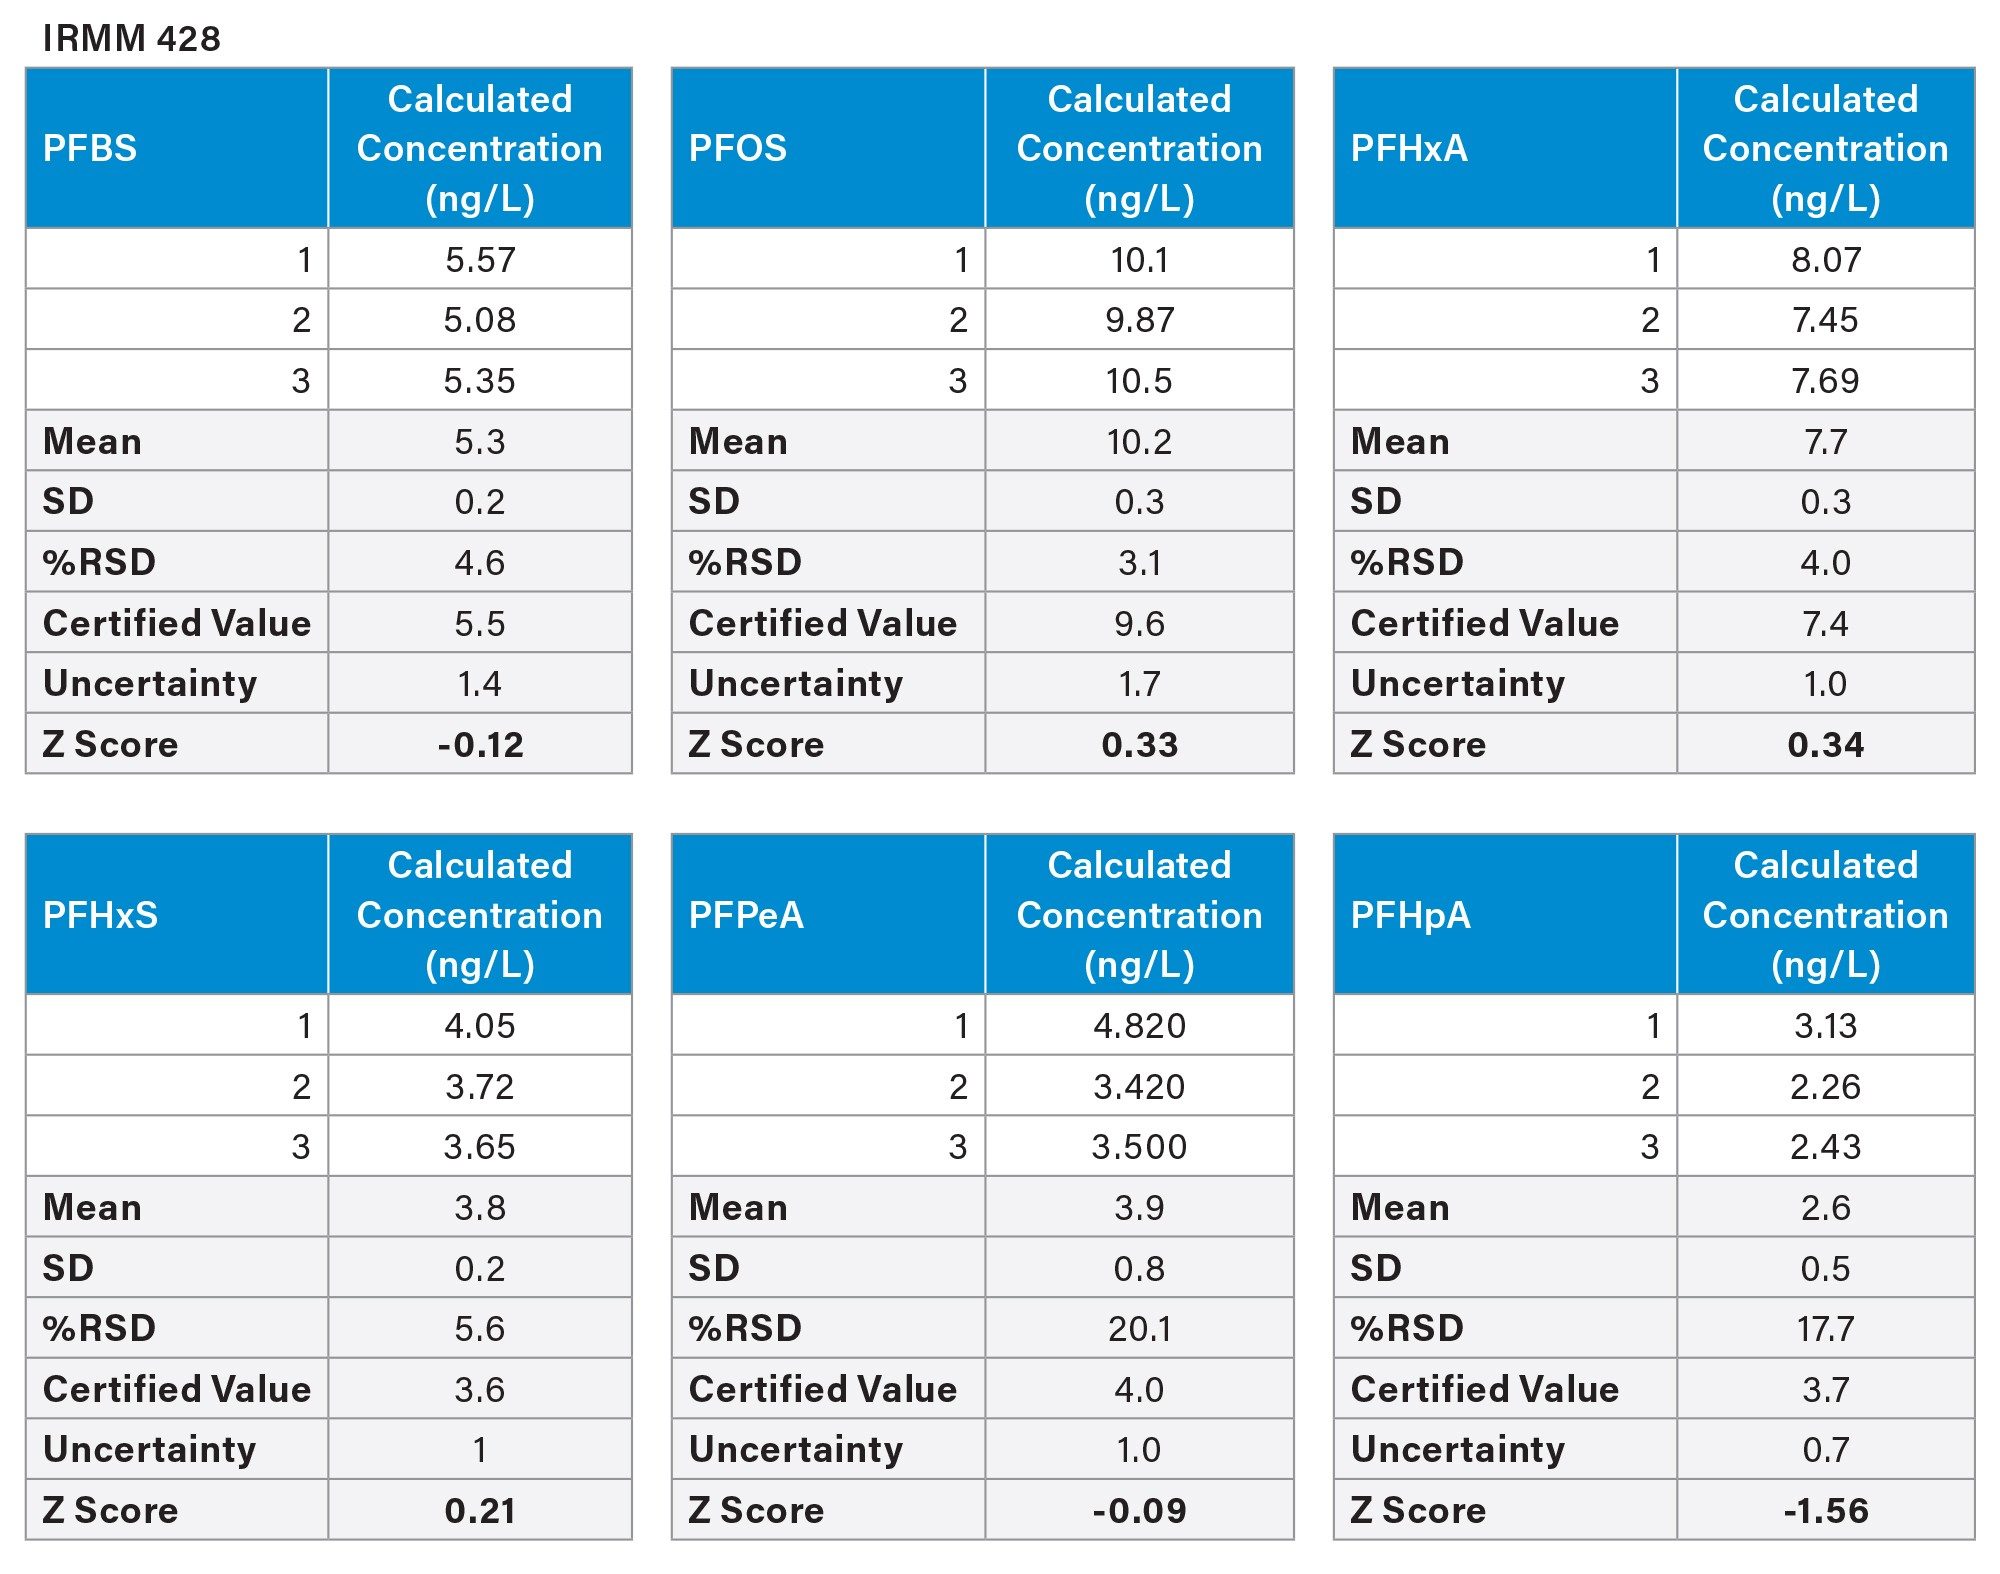
A CRM, IRMM-428 for drinking water containing PFAS, was purchased and used to determine the accuracy of the online SPE method. The CRM sample was allowed to reach room temperature and vortex mixed for 1 minute prior to aliquoting into three autosampler vials. The ILIS mix was added to the autosampler vials at a concentration of 2 ng/L. The analysis was performed in triplicate. The measured concentrations were quantified using a bracketed calibration series. Observation concentration was calculated via external and internal standardization and results found to be comparable (data not shown) indicating negligible matrix effects. For simplicity of approach, the externally standardized results were used and compared to the certified values. The Z-Scores were calculated using the equation below.

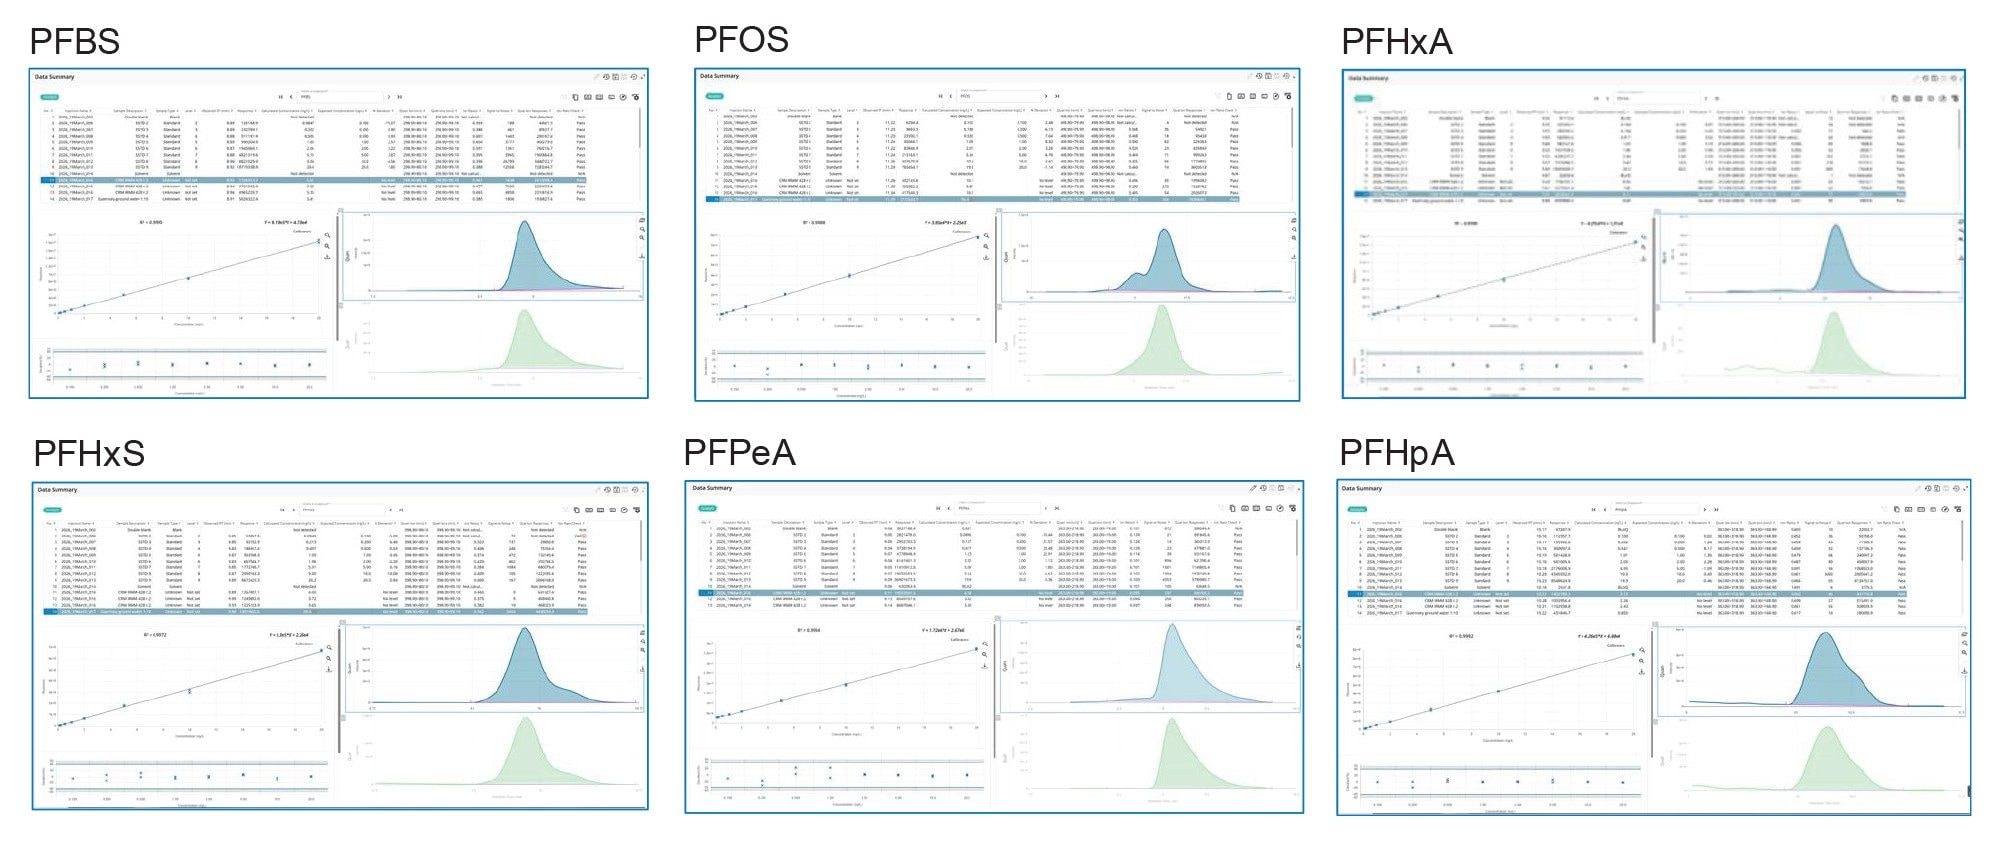
For all six PFAS, the mean calculated concentrations were in close agreement to the certified values reported in the IRMM-428 certificate of analysis10 (Table 2). The Z-Scores were well within the acceptable range of ± 2.0 units indicating the excellent accuracy of the online SPE method in drinking water. The results, as visualized in MS Quan Application ‘Data Summary’ view are shown in Figure 8. The analyst can interact with a user configurable tabulated data summary, MRM chromatograms, calibration and QC data for each analyte in a single view for efficiency of data processing and reporting in multi-residue methods.
Repeatability in River Water and Performance in Groundwater
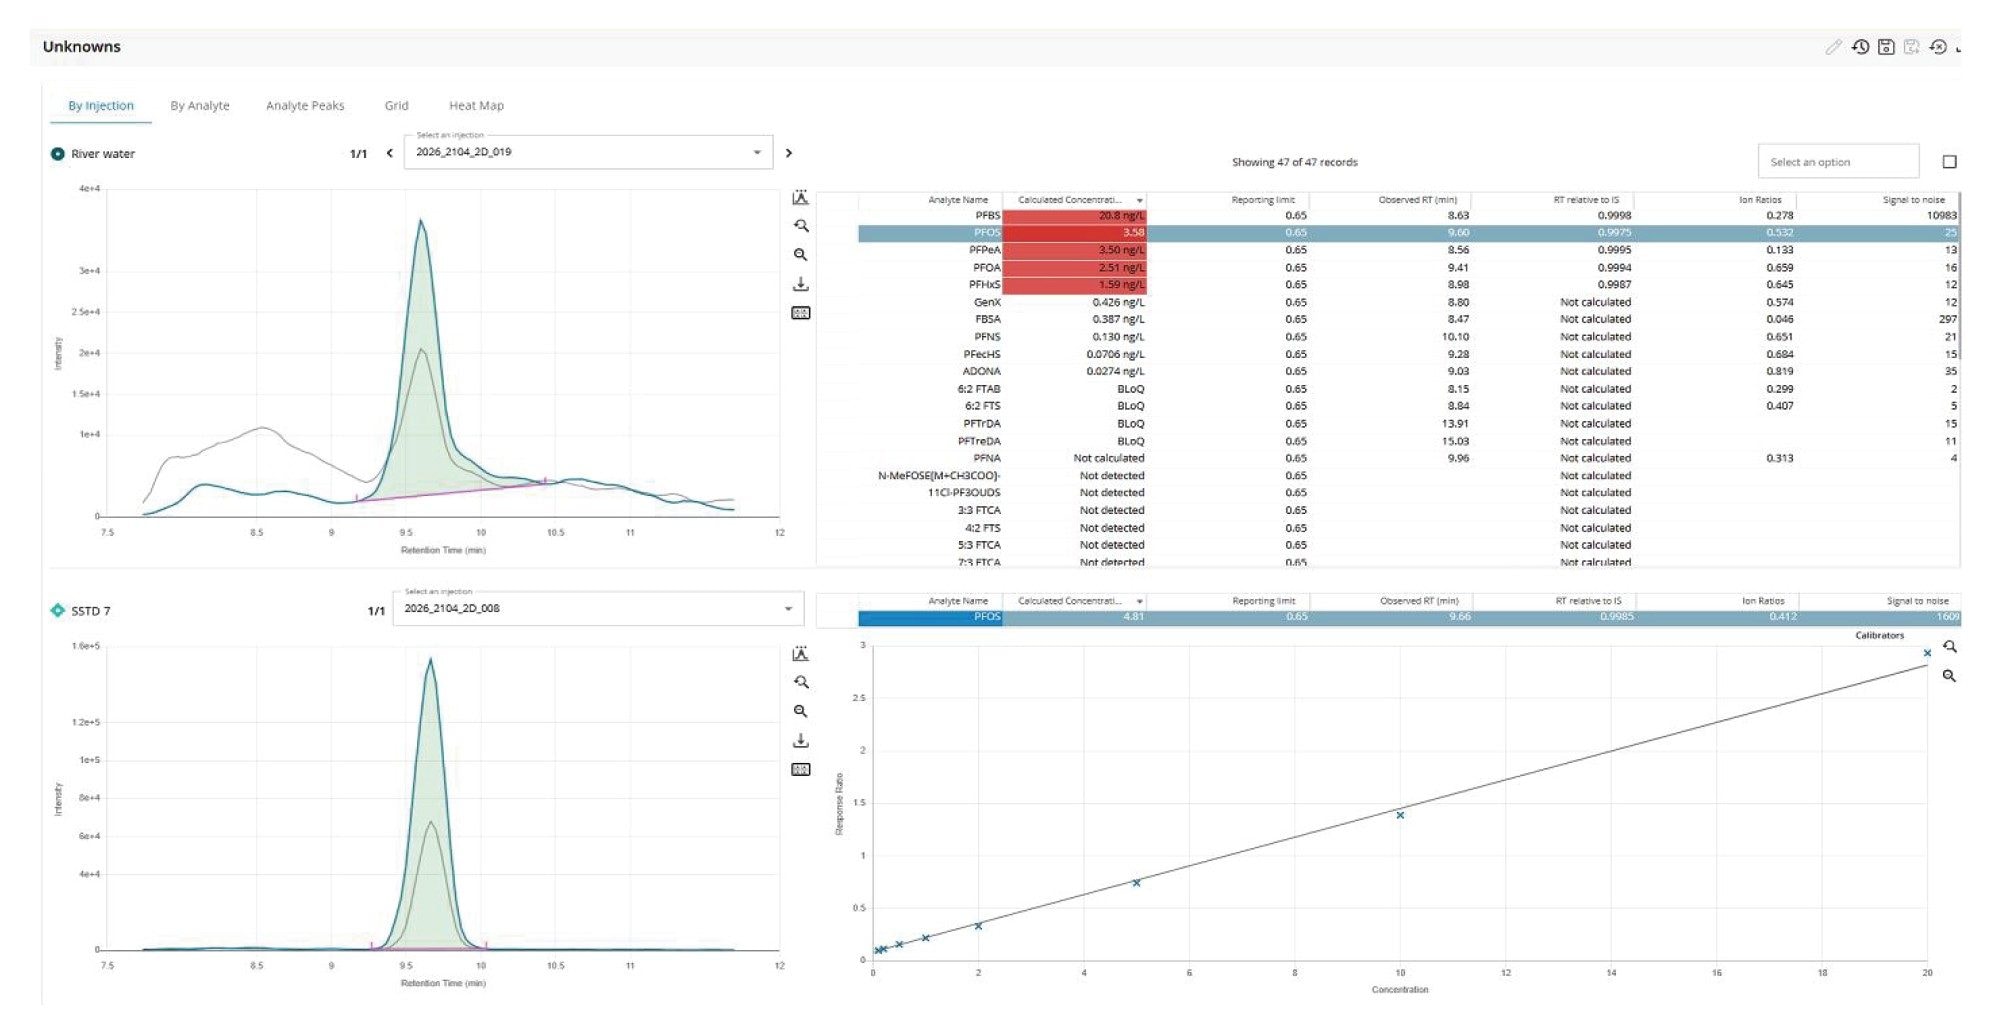
Four samples of river water collected from various locations in the Northwest of England were pooled. The pooled river water was centrifuged at 4500 rpm at 15 oC for 15 minutes and the supernatant separated from any visible pellet fraction. Aliquots (10 mL) of the supernatant were dispensed into 50 mL polypropylene centrifuge tubes. One set of aliquots were used as ‘blank controls’, and the second set were spiked with the 48 PFAS to give an additional 5 ng/L. The internal standard mix was added to all samples, with the exceptions of the double blank and reagent blank, to give a concentration equivalent to 2 ng/L. The blank controls (n = 3) and spiked samples (n = 8) were then analyzed with the solvent standard calibration curve and procedural blanks. To correct for matrix effects, the ILISs were used for quantification purposes. For each sample, the calculated concentration for all PFAS, above the respective LLOQ, was determined. For the spiked sample set the mean observed concentration, standard deviation and %RSD were calculated. For all 48 PFAS, the RSD was shown to be less than 15%. Retention time stability was also determined and shown to be less than 0.3%. This performance is compliant with the EPA 1633 analyte specific requirements in aqueous matrices for initial precision.11 As expected, background levels for some of the target PFAS were detected in the control river water sample (Figure 9). Notably, background levels of PFBS, L-PFOS, PFPeA, PFOA and PFHxS were detected at concentrations exceeding 1 ng/L.
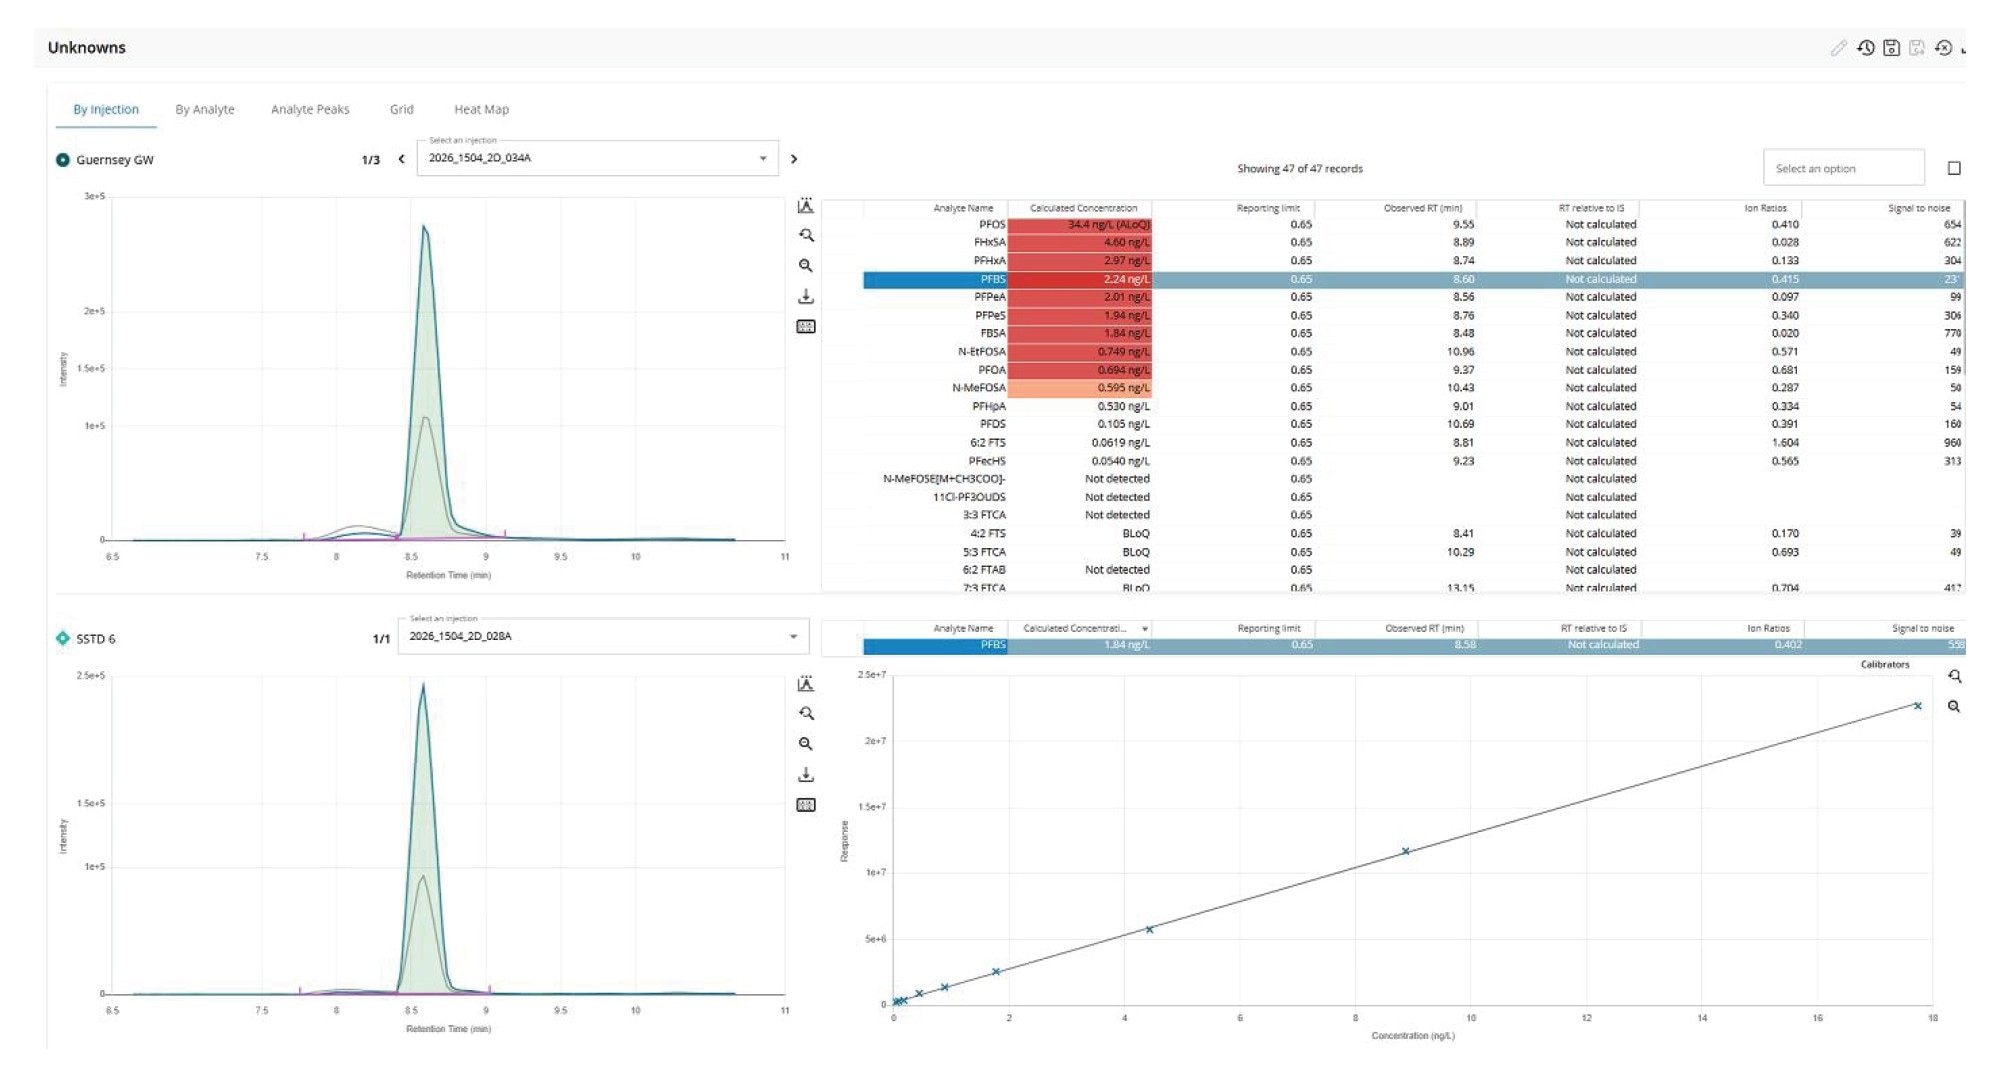
A sample of contaminated groundwater sourced from the U.K. Channel Islands was also analyzed using the online SPE method to assess the method performance in a third water type. As prior analysis demonstrated negligible matrix effects for groundwater, the sample was quantified against the solvent standards without the use of ILIS and found to contain concentrations of PFAS ranging from c. 34.4 to 0.05 ng/L (Figure 10). The highest concentration observed was for L-PFOS, however, as this exceeded the top calibration standard the neat sample was diluted by a factor of 10 (1:9 parts in laboratory grade water) and re-analyzed. A calculated concentration of 6.8 ng/L was recorded, equivalent to 68 ng/L in the neat groundwater sample.
Conclusion
- This validation study, has demonstrated that:Automated online SPE kit coupled to the core-performance Xevo TQ-S micro Mass Spectrometer offers a method capable of accurate and precise quantitative performance in a range of environmental water samples in 24 minutes per sample. The method performance was shown to be excellent in terms of linearity, repeatability, accuracy and robustness. Depending on the complexity of the sample and requirement to correct for matrix effects, ILIS can be effectively used to improve quantitative performance.
- The scope of the method covers the 48 PFAS currently included in the U.K. DWI guidelines (at the time of writing) with potential to expand the coverage to ultra-short chain PFAS and zwitterionic species based on the novel mixed mode SPE sorbent chemistry used.
- Sensitivity, in terms of LLOQ in drinking water is sub ng/L, showing that the online clean up and concentration method coupled to a mid-tier TQ is suitable for checking compliance with current regulations including the EU Drinking Water Directive 2020/2184 (where applicable) and U.K. DWI Guidelines.
- The automated online SPE method enables laboratories to increase sample throughput, reduce analyst hands-on time, minimize contamination risk and lower solvent and consumable usage compared with manual offline SPE. Up to 60 samples can be processed in a 24-hour period with minimal analyst intervention.
- The waters_connect Software (AME, Sample Sub, MS ToolKit and MS Quan) were shown to significantly increase efficiency in terms of time reduction during all aspects of method development, validation, data processing and review phases.
References
- Li, J.G. Perfluorinated Organic Compounds: Emerging Environmental Pollutants with Potential Health Risks. Chin. J. Prev. Med. 2015;49:467–469.
- Xiao, F. Emerging Poly- and Perfluoroalkyl Substances in the Aquatic Environment: A Review of Current Literature. Water Research. 2017;Nov 124(1):482-495.
- Mabury, S.A.; D’Agostino, L.A. Identification of Novel Fluorinated Surfactants in Aqueous Film Forming Foams and Commercial Surfactant Concentrates. 2014. Environ. Sci. Technol.
- Directive (EU) 2020/2184 of the European Parliament and of the Council of 16 December 2020 on the Quality of Water Intended for Human Consumption (recast) [Online] https://eur-lex.europa.eu/eli/dir/2020/2184/oj
- Drinking Water Inspectorate (DWI) Information Letter, Requirements for Poly and Perfluorinated Alkyl Substances (PFAS) Monitoring by Water Companies in England and Wales 05/2021 https://dwi-content.s3.eu-west-2.amazonaws.com/wp-content/uploads/2021/10/04203217/Information-Letter-PFAS-Monitoring.pdf
- Organtini, K.L.; Renner, B.; Lame, M.E.; Brinster, K.R. Oasis WAX for Extraction of Per- and Polyfluorinated Alkyl Substances (PFAS) from Drinking Water in Accordance with EPA Method 533. Waters Application Note 720006808. Dec 2020.
- Shoemaker, J.; Tettenhorst, D. Method 537.1: Determination of Selected Per- and Polyfluorinated Alkyl Substances in Drinking Water by Solid Phase Extraction and Liquid Chromatography/ Tandem Mass Spectrometry (LC/MS/MS) Version 2.0 In USEPA, Ed. 2020.
- Zou, J. et al. Rapid and Simultaneous Determination of Ultrashort-, Short- and Long- Chain Perfluoroalkyl Substances by a Novel Liquid Chromatography Method. J. Chrom A. 2024; 1734 465324.9.
- De la Serna Calleja, M.Ả.; Bolado, S.; Jiménez, J.J.; López-Serna. Performance Critical Comparison of Offline SPE, Online SPE, and Direct Injection for the Determination of CECs in Complex Liquid Environmental Matrices. Microchemical Journal. 2023; 187 108395.10 European Commission, Joint Research Centre. Certified Reference Material IRMM-426 Certificate of Analysis. IRMM-428_cert
- U.S. Environmental Protection Agency (EPA). (2024). Method 1633A: Analysis of Per- and Polyfluoroalkyl Substances (PFAS) in Aqueous, Solid, Biosolids, and Tissue Samples by LC-MS/MS. EPA 820-R-24-007. Office of Water, Washington, DC. December 2024 https://www.epa.gov/system/files/documents/2024-12/method-1633a-december-5-2024-508-compliant.pdf
720009542, August 2026


