
Chemical Stability Testing of Daraxonrasib Using Ultrashort 2.1 x 10 mm UPLC Columns
Kenneth Berthelette, Chris Collins, Thomas H Walter, Paul Rainville
Waters Corporation, United States
Published on September 24, 2026

Abstract
A stability study was developed and performed for two pharmaceuticals, Omeprazole and Daraxonrasib. The testing was performed using an ACQUITY™ Premier LC System coupled to a Xevo™ TQ-S micro Mass Spectrometer with a 2.1 x 10 mm analytical column to achieve fast separations. Over 27 hours, Daraxonrasib showed stable peak areas under three stress conditions, while Omeprazole degraded under acidic and neutral test conditions. Acquiring data in under 90 seconds for each injection, provided more data than traditional techniques.
Benefits
- Faster run times compared to traditional 50 mm long columns
- Provides greater time resolution to improve the characterization of analyte stability
Introduction
Drug metabolism and pharmacokinetic (DMPK) studies are a critical part of early drug discovery as they evaluate how a candidate compound will behave in biological systems.1–3 However, as in vivo testing can be expensive and time consuming, it can be advantageous to perform in vitro stability testing prior to live studies.4 The in vitro stability testing performed will depend on the candidate as well as the laboratory, but for many labs performing stability tests at acidic, basic, and neutral pH at physiological temperatures will at least assess whether a candidate will be stable enough to be introduced into a living system. If a candidate does not possess sufficient stability under these test conditions, then any in vivo study results would be confounded by the instability of the molecule leading to potential false readings of uptake or metabolism in the biological system.
Analytical laboratories supporting drug discovery often perform these stability studies using high-throughput LC-MS/MS methodologies. In these situations, the highest concern is not the separation quality, but rather the speed at which samples can be analyzed. As such, anything that can be done to reduce analysis time without compromising the ability to monitor for degradation is worth considering. Examples of approaches to speeding up analyzes for DMPK studies include using ballistic gradients that push the limits of a liquid chromatography system and using shorter analytical columns to increase cycle time. The use of ballistic methods, which typically employ flow rates that generate very high pressure, is common but can present several challenges, including a propensity to over pressure the system.5,6 Since ballistic methods operate near the upper limit of a system’s pressure tolerance, a sudden increase in pressure can cause the system to over pressure, leading to re-injections and potentially some instrument downtime.
Using shorter analytical columns, e.g. 2.1 x 10 mm columns, can speed up an analysis without having to rely on the system pumping high flow rates. Ultrashort 2.1 x 10 mm columns have been shown previously to decrease cycle time for the analysis of small molecule pharmaceuticals in a bioanalytical setting employing solid phase extraction (SPE) to clean up plasma samples.7 In addition to speed improvements, methods using these columns also provide sustainability benefits due to reductions in energy and solvent usage.8 As such, the use of these columns with short 1.25 minute cycle time runs should be appropriate for a DMPK stability study. To test this, two analytes were selected and subjected to typical stability study conditions. Omeprazole, a proton pump inhibitor, was selected as it is known to degrade rapidly under acidic conditions. This makes Oomeprazole ideal to determine if the proposed methodology would provide sufficient data to monitor and assess the stability of a drug candidate. The second compound, Daraxonrasib, is an investigational oncology drug for the treatment of solid tumors with RAS mutations.9
Experimental
Sample Description
Stock solutions of Daraxonrasib (10 mM) and Omeprazole (10 mM) were created in 60:40 water:acetonitrile (v:v). For each test condition, stock solution was removed and placed into the QuanRecovery™ Plate and diluted with the appropriate catalyst. Final sample concentration for each test compounds was 100 µM.
LC Conditions
|
LC system: |
ACQUITY Premier Binary Solvent Manager (BSM) with Column Manager (CM) and Photo-Diode Array (PDA) Detector |
|
Detection: |
Mass Detection |
|
Columns: |
XSelect™ HSS T3 Column, 2.1 x 10 mm, 2.5 µm (p/n: 186011466) |
|
Vials: |
QuanRecovery with MaxPeak™ 700 µL Plate (p/n: 186009185) |
|
Column temperature: |
30 °C |
|
Sample temperature: |
37 °C |
|
Injection volume: |
1.0 µL |
|
Flow rate: |
0.5 mL/min |
|
Mobile phase A: |
Water with 0.1% formic acid |
|
Mobile phase B: |
Acetonitrile with 0.1% formic acid |
|
Gradient conditions: |
Initial conditions of 5% B. Hold at 5% B for 0.15 minutes, followed by linear ramp to 100% B in 0.26 minutes. Hold at 100% B for 0.06 minutes, then switch to initial conditions and re-equilibrate for 0.66 minutes. Total run time 1.25 minutes. |
MS Conditions
|
LC system: |
Xevo TQ-S micro Mass Spectrometer |
|
Ionization mode: |
ESI Positive |
|
Detection: |
Multiple Reaction Monitoring (MRM) See Table 1. |
|
Capillary voltage: |
3.00 kV |
|
Cone voltage: |
30 V |
|
Desolvation temperature: |
350 °C |
|
Desolvation gas: |
1000 L/hr |
|
Cone gas: |
10 L/hr |
Data Management
|
Chromatography software: |
MassLynx™ Software |
Results and Discussion
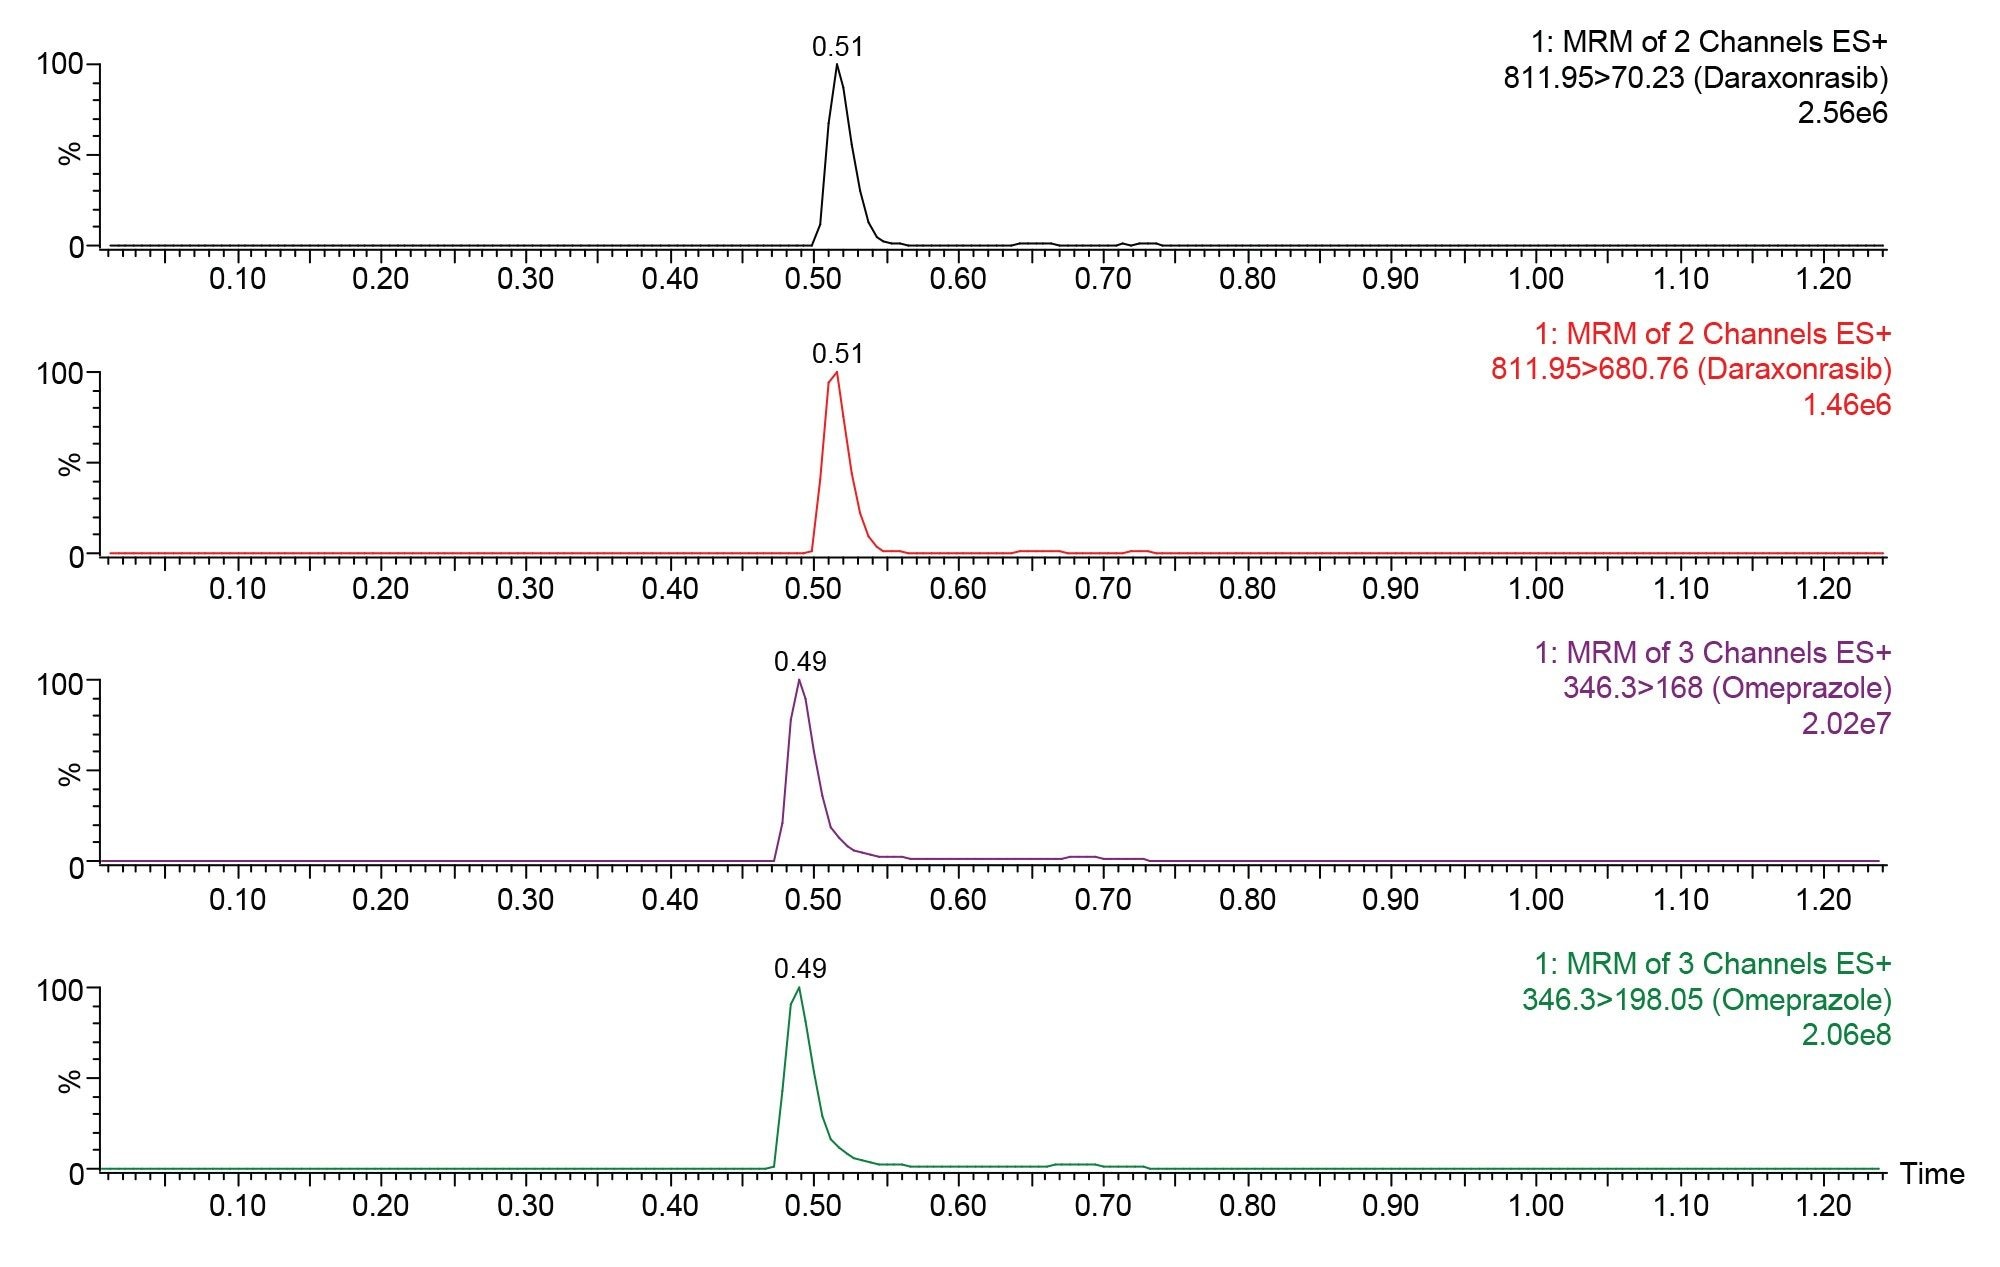
Prior to sample analysis, MRM transitions were determined or confirmed. In the case of Omeprazole, previously documented transitions were confirmed. For Daraxonrasib, only one transition was found that had been previously reported as 811.95 -> 680.76. As such, a second transition was found and optimized through manual tuning and infusion of a stock solution of Daraxonrasib with 60:40 water:acetonitrile. Full transition details are outlined in Table 1 and example chromatograms are shown in Figure 1.

To determine the ability to detect peak area loss in a short time frame, Omeprazole was subjected to the testing first. Omeprazole being a proton pump inhibitor designed to rapidly break down under acidic conditions found in the stomach of a patient, should show poor stability when subjected to the acid stress conditions outlined in this work.10 What is less clear based on the literature is the stability of the compound at neutral and high pH. To test this, three test conditions were assessed at 37 °C. For each test condition, a solution with a final concentration of 100 µM of the test compound was prepared in either 0.1 N hydrochloric acid (HCl), phosphate buffered saline (PBS), or 0.01 N sodium hydroxide (NaOH). These samples were prepared in triplicate and placed into a 96 well plate for analysis along with a blank sample well, and a 100 µM neat standard which contained no catalyst. The neat standard results were used to determine if temperature alone would cause a change in peak area.
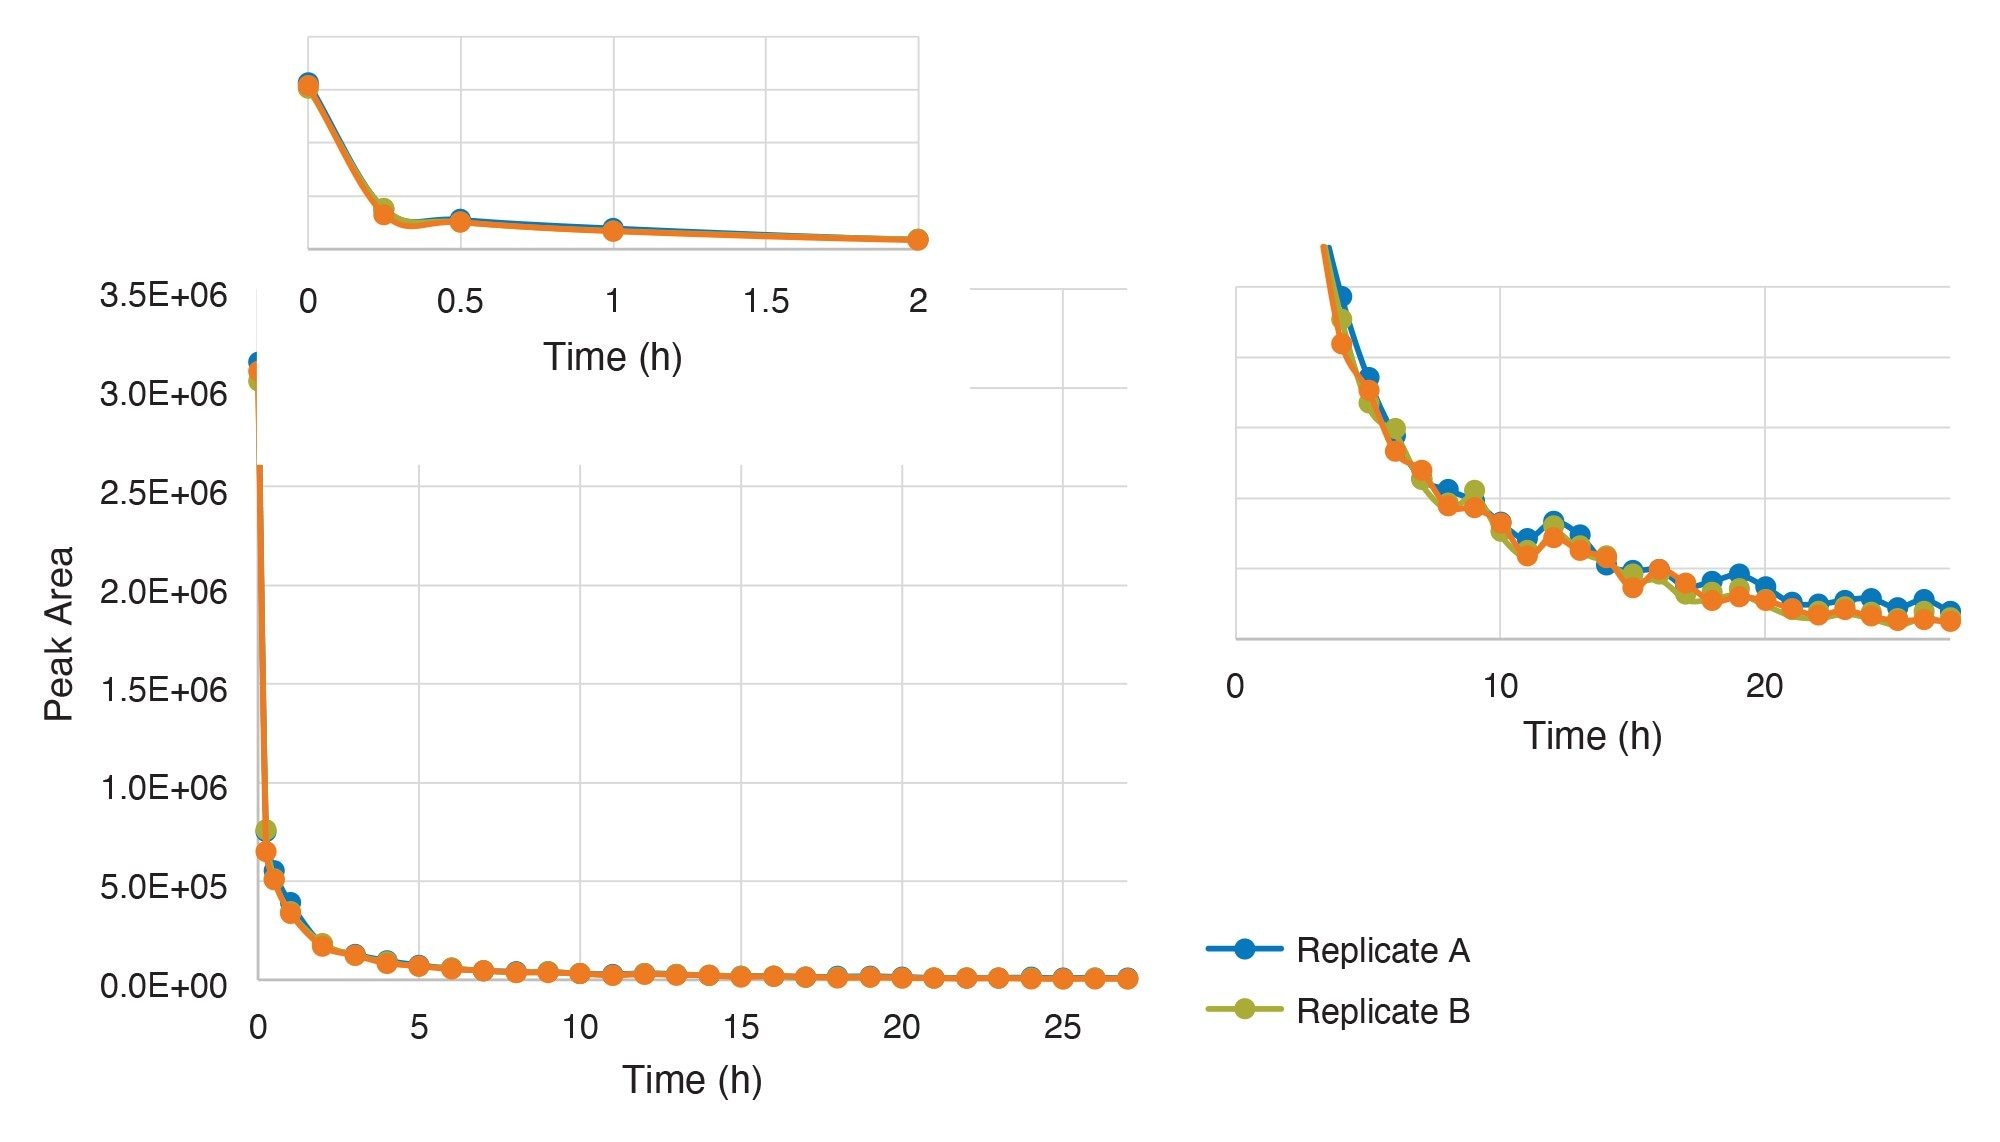
Figure 2 shows the plot of peak area vs time for the acid stability test of Omeprazole over 27 hours. As expected, Omeprazole readily degraded under the acidic conditions, with significant peak area loss within the first 15 minutes. The peak area continued to decrease throughout the testing albeit at a slower rate (right inset of Figure 2). Testing at physiological pH using phosphate buffered saline (PBS) and at elevated pH using sodium hydroxide were also performed. Figure 3 shows the results of that testing for Omeprazole.
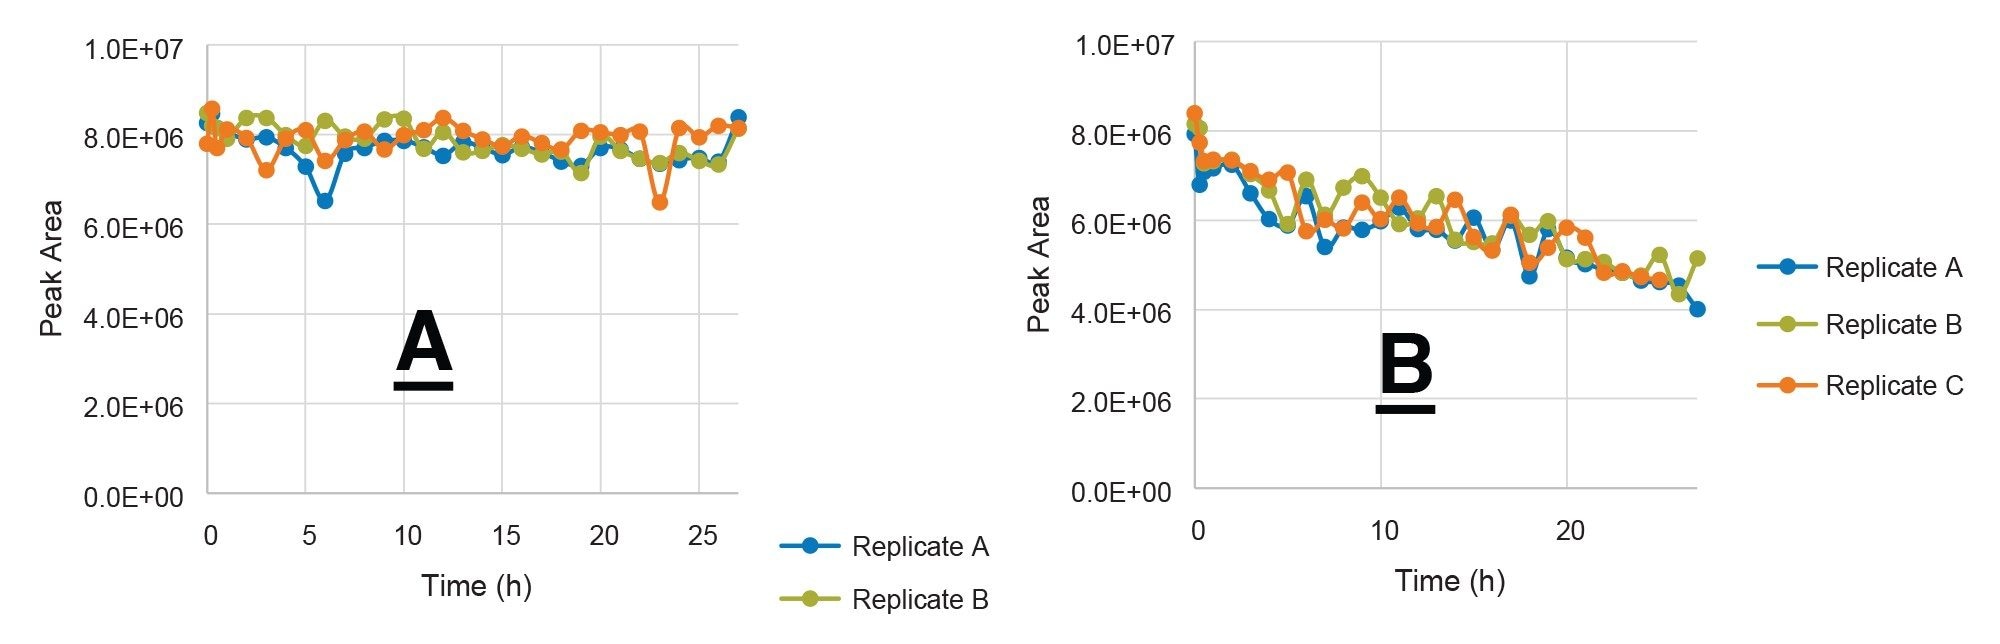
The sodium hydroxide results (Figure 3A) show good stability across the duration of the testing, with only slight variability in peak area for a few injections. The use of PBS as the diluent for omeprazole stability showed a slow and steady decline in peak area over 27 hours, with <50% loss of peak area compared to the initial values. Neat standard analysis showed no peak area change for Omeprazole before, during or after the testing.
With the test parameters set, Daraxonrasib was subjected to the same stability testing using acidic, neutral, and basic diluents. As with Omeprazole, solutions having a final concentration of 100 µM Daraxonrasib were created with the three testing diluents and placed into a 96-well plate. Acid stability, PBS stability, and basic stability testing results are shown in Figures 4–6 respectively.
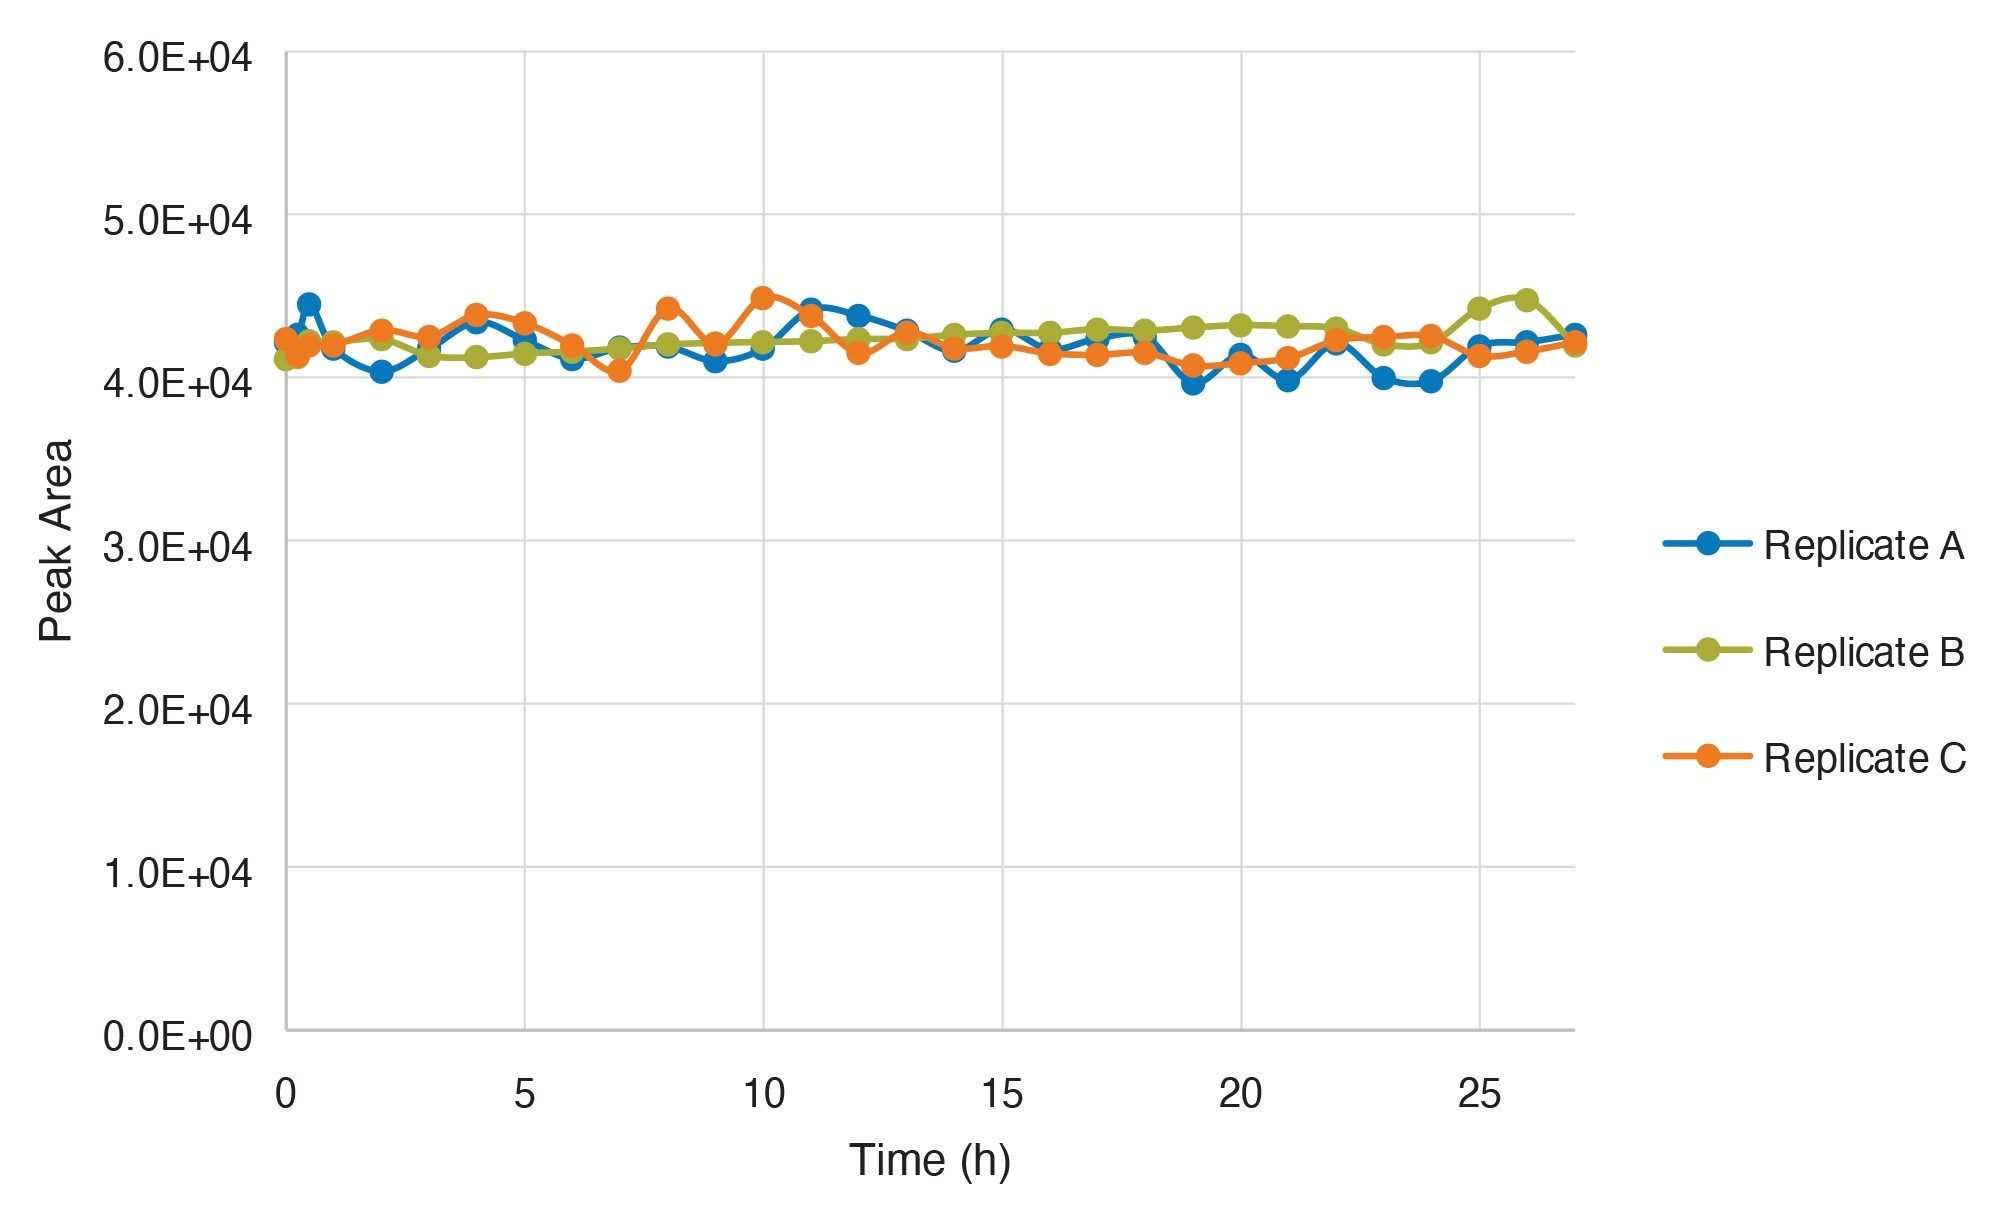
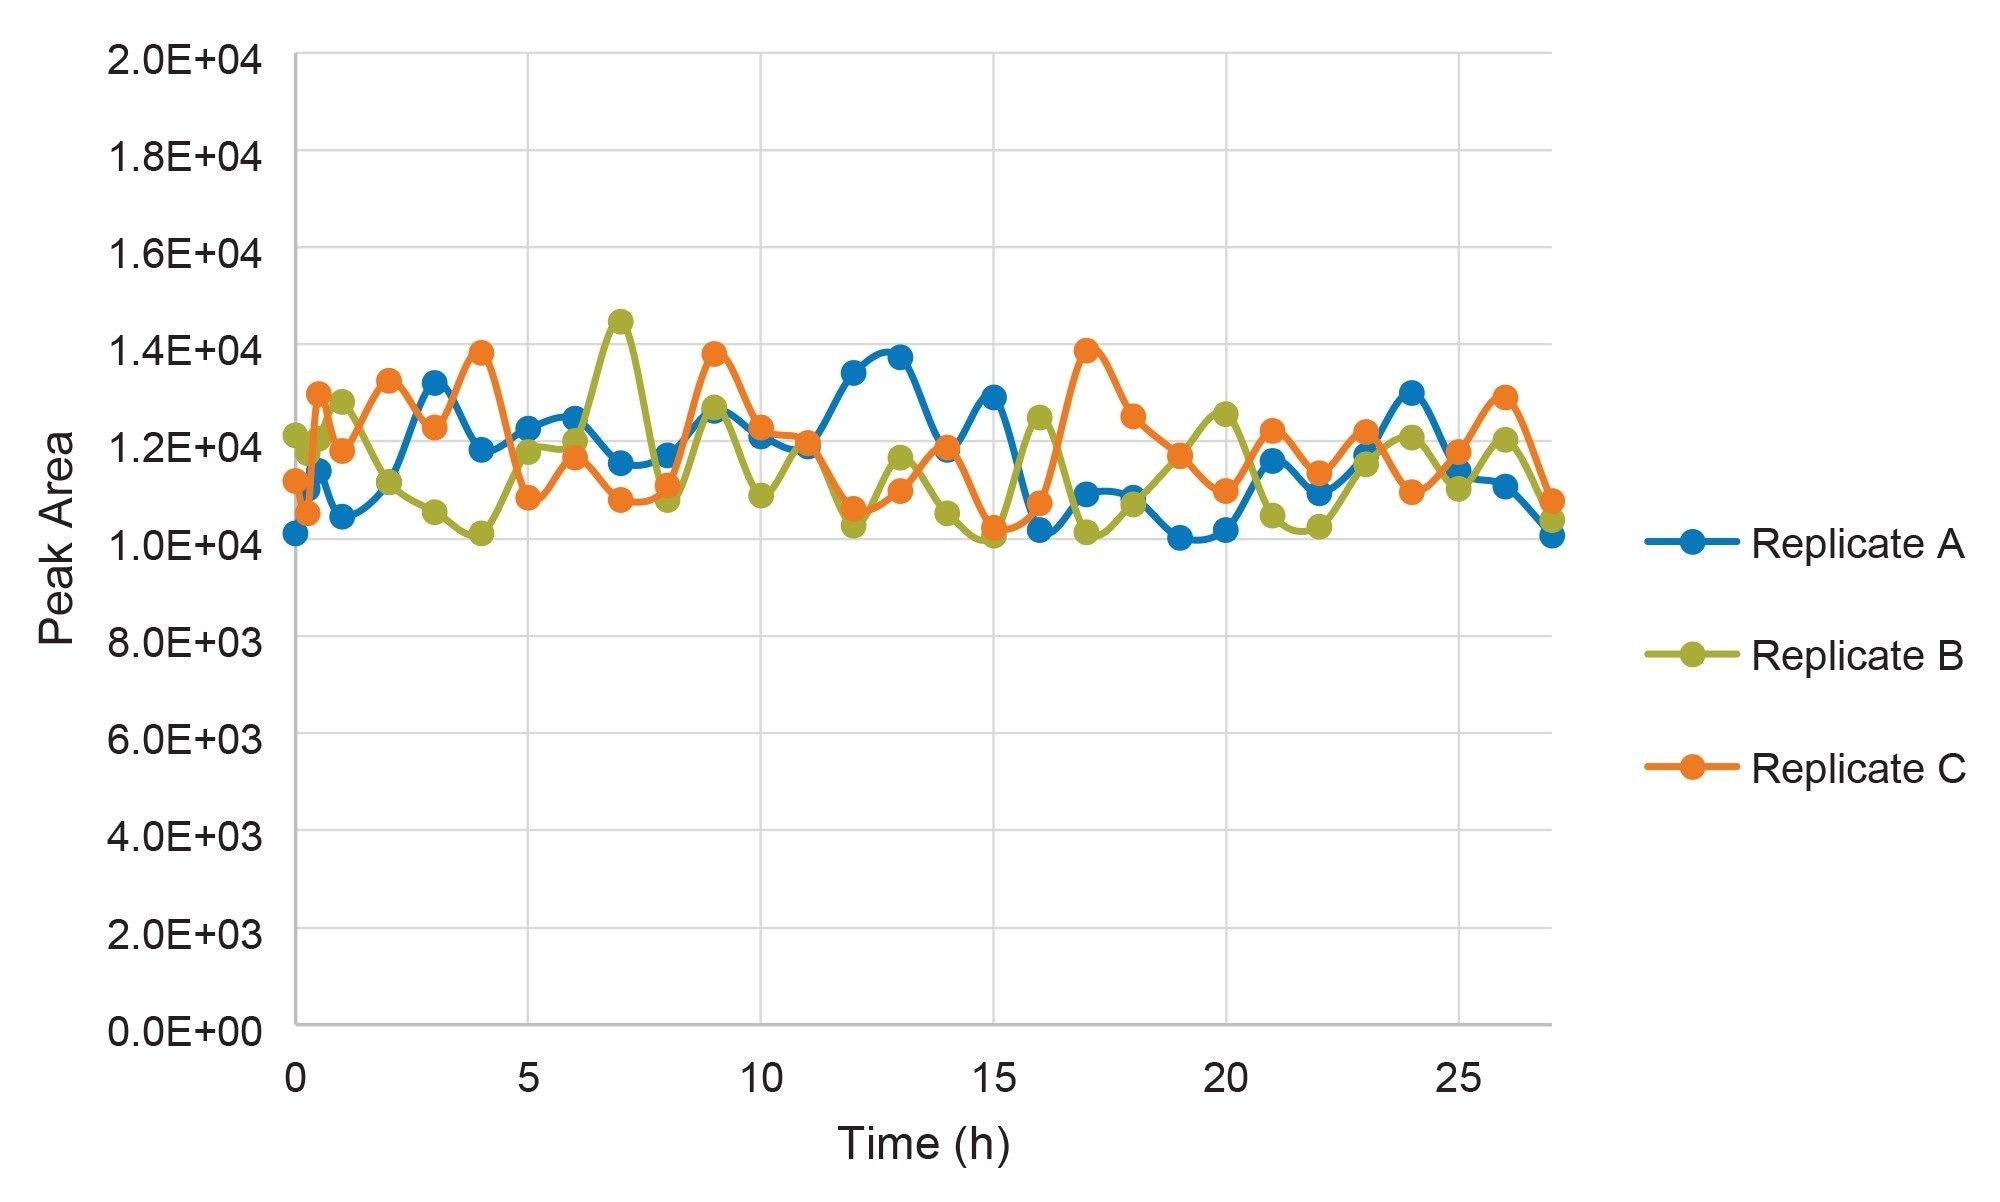
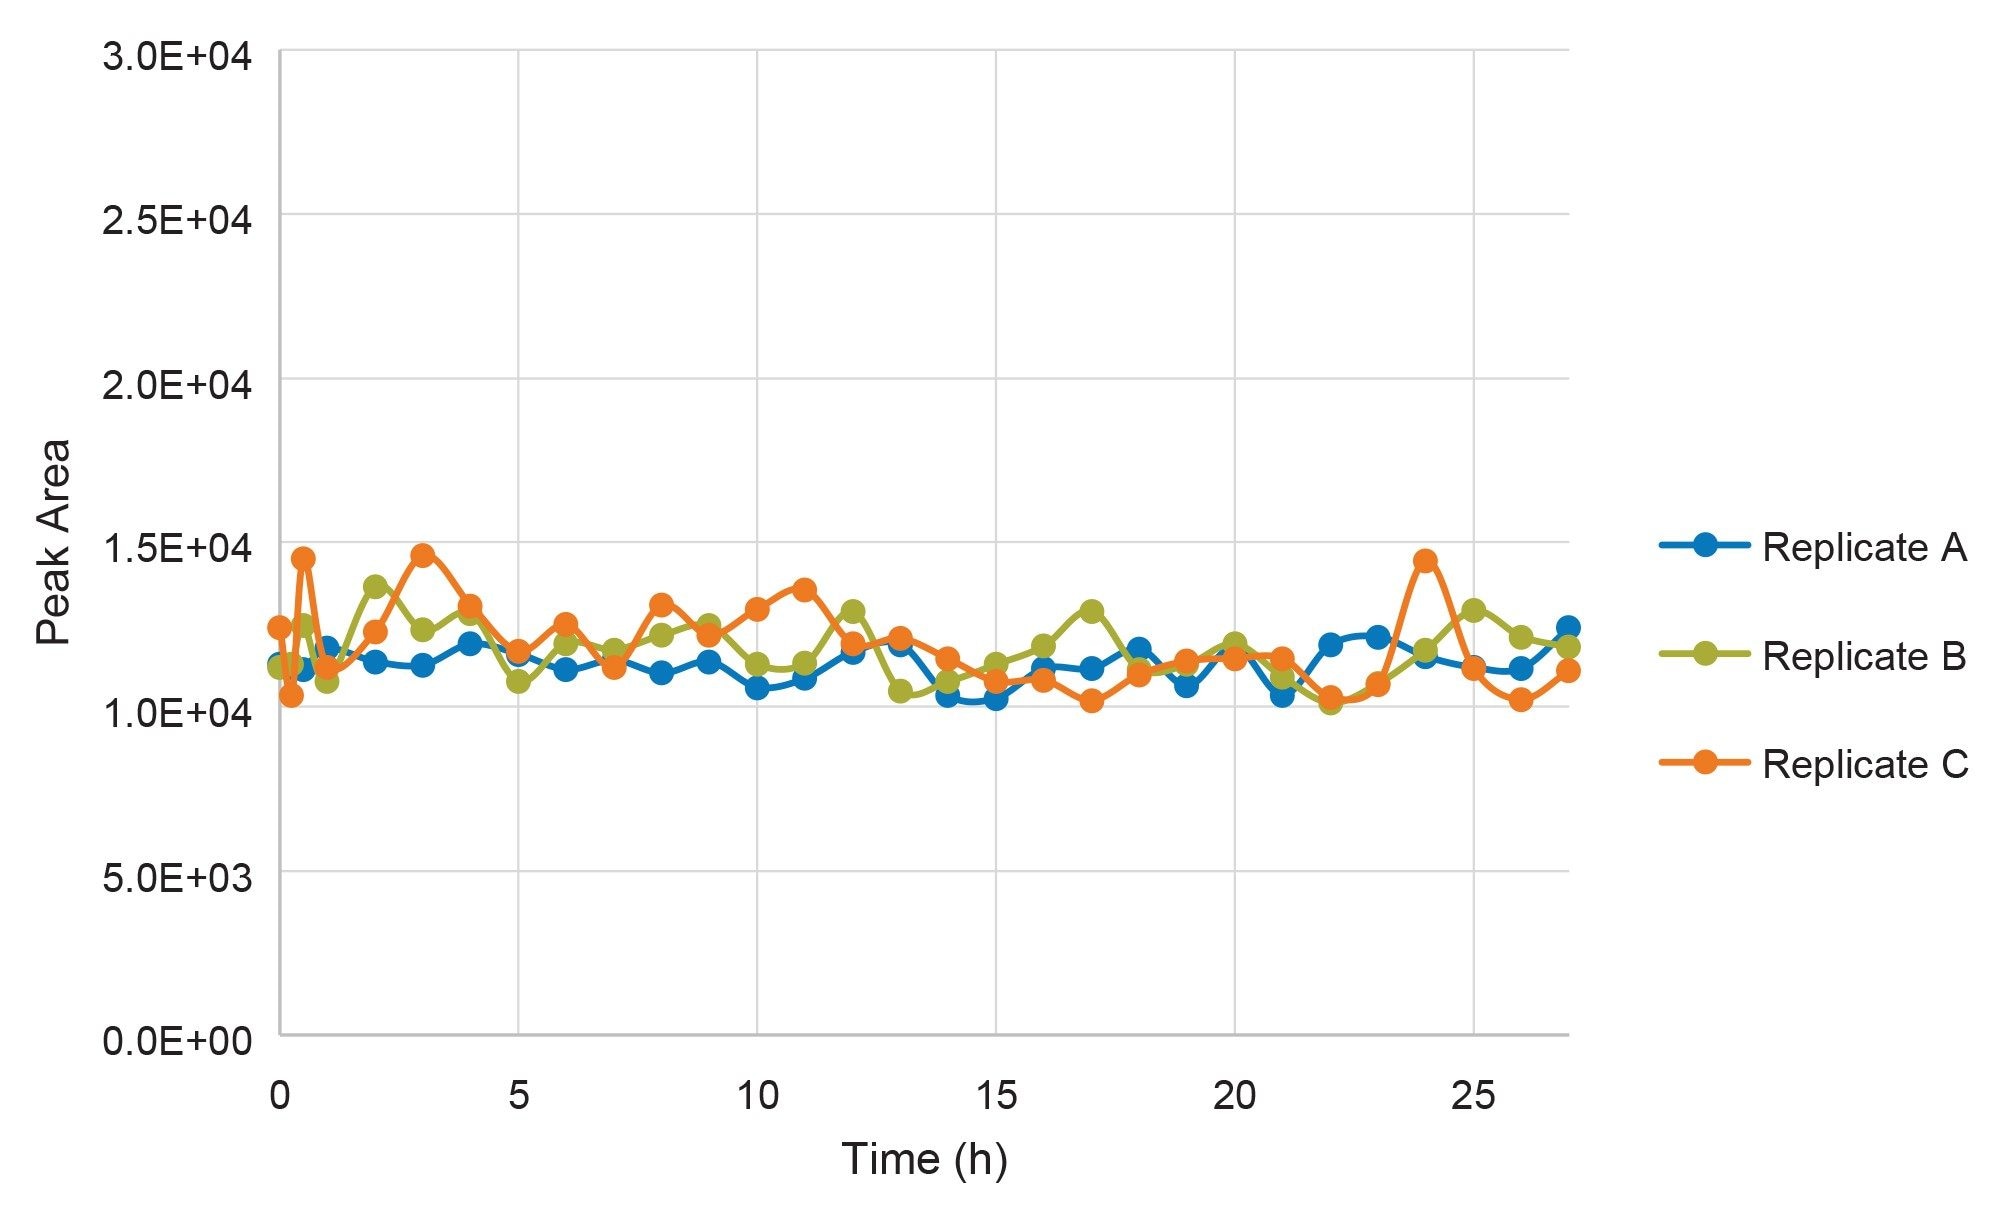
All three tests showed good stability for Daraxonrasib over 27 hours of testing. Higher peak areas were observed in the acidic solutions compared to the neutral and basic test solutions. This may be due to a few factors including adduct formation in the neutral and basic solutions, or changes in the extent of ionization of Daraxonrasib between the three solutions. While the peak areas may be lower in the neutral and basic solutions, the peak areas are stable over time, so this drug candidate can be put through a more rigorous stability or metabolic profiling experiment.
While traditionally this type of screening experiment is done with 30 mm or 50 mm columns, the use of a 10 mm column offers several benefits. The most important benefit is shorter analysis time. The method shown here used a 1.25 minute run time per injection, allowing for twelve injections every fifteen minutes, or a full 48-well sample vial holder every hour. Using a properly scaled method with a 50 mm column would result in a run time of 6.25 minutes. The shorter analysis time afforded by the 10 mm column also allows for more accurate characterization when the degradation rate is relatively fast.
Another benefit of using a 10 mm column is the solvent and energy savings that can be realized relative to the use of 30 and 50 mm columns. As one can logically conclude, using a column with shorter analytical run times means less solvent consumed, less solvent that needs to be disposed of, and less energy needed to run the instrumentation for the analysis. These benefits are documented in previous work, where 50 mm, 30 mm and 10 mm columns were compared, and the solvent and energy usage was compared. In that work, analytical method greenness scores (AMGS) were calculated and showed significant improvements in “greenness” when the 10 mm columns were used.
The ultra-short 10 mm columns are a useful addition to the laboratory, especially when separation efficiency is not the most important factor. These columns are ideally suited for gathering data quickly, especially when coupled to selective mass spectrometers like tandem quadrupoles, which can easily detect a single known peak in a complex sample.
Conclusion
An ultrashort XSelect HSS T3 2.1 x 10 mm Column was successfully used to monitor the chemical stability of two compounds at physiological temperature under three different stress conditions. Using the 10 mm analytical column yielded not only acceptable data in terms of the ability to monitor analyte degradation but also generated the data with 1.25-minute cycle times. This means that over 24 hours of instrument run time, over 1,000 injections could be performed. This speed of testing allows for either more drug candidates to be screened, or higher time resolution characterization of candidate degradation to be realized. Coupling the ultrashort 10 mm column to a tandem quadrupole MS system allowed for selective monitoring of the analytes, while avoiding interference from any potential degradants.
References
- Kerns, E. High-Throughput Physicochemical Profiling for Drug Discovery. J. Pharm. Sci. (2001) 90; 11, 1838–1858.
- Kerns, E.; Di, L. Pharmaceutical Profiling in Drug Discovery. Drug Discovery Today. (2003). 8;7, 316–323.
- Hughes, J.P.; Rees, J.P.; Kalindjian, S.B.; Philpott, K.L. Principles of Early Drug Discovery. Br. J. Pharmacol. (2010) 162, 1239–1249.
- The Role of in vitro Testing in Drug Development. Pion Blog. Accessed 30-July-2026. https://www.pion-inc.com/blog/the-role-of-in-vitro-testing-in-drug-development.
- De Nardi, C.; Bonelli, F. Moving from Fast to Ballistic Gradient in Liquid Chromatography/tandem Mass Spectrometry Pharmaceutical Bioanalysis: Matrix Effect and Chromatographic Evaluations. Rapid Commun. Mass Spec. (2006) 20;18, 2709–2716.
- Dunn-Meynell, K.; Wainhaus, S.; Korfmacher, W. Optimizing an Ultrafast Generic High-performance Liquid Chromatography/tandem Mass Spectrometry Method for Faster Discovery Pharmacokinetic Sample Throughput. Rapid Commun. Mass Spec (2005) 30, 2905–2910.
- Tanna, N.; Plummer, C.; Walter, T.H. Improved Bioanalytical Performance Using a Simplified 2-Step Oasis™ PRiME HLB Protocol with an Ultra-Short UPLC™ Column for UPLC-MS/MS. Waters Application Note. 720009018. September, 2025.
- Berthelette, K.; Collins, C.; Walter, T.H. Improving Throughput and Analytical Greenness in Pharmaceutical Discovery Using Ultrashort (2.1 x 10 mm) HPLC Columns. Waters Application Note. 720009074. October, 2025.
- Cregg, J.; et al. Discovery of Daraxonrasib (RMC-6236), A Potent and Orally Bioavailable RAS(ON) Multi-selective, Noncovalent Tri-complex Inhibitor for the Treatment of Patients with Multiple RAS-Addicted Cancers. J. Med. Chem. (2025), 68 (6), 6064–6083.
- El-Badry, M.; Taha, E.; Alanazi, F.; Alsarra, I. Study of Omeprazole Stability in Aqueous Solution: Influence of Cyclodextrins. Journal of Drug Delivery Science and Technology. (2009) 19,5 347–351.
720009598, September 2026


