
Analysis of Creatine and Creatinine in Dietary Supplements Using HILIC-MS
Kenneth Berthelette, Euan Ross, Thomas H Walter
Waters Corporation, United States
Published on August 14, 2026

Abstract
A hydrophilic interaction liquid chromatography-mass spectrometry (HILIC-MS) method was developed to quantify creatine and creatinine in dietary supplements. The method was used to verify the label claims of the creatine amount and to monitor the creatinine content.
Benefits
- Strong retention for creatine and creatinine was achieved using hydrophilic interaction liquid chromatography (HILIC) with an ACQUITY™ Premier BEH™ HILIC Column
- A linear response was obtained for creatine and creatinine over a concentration range of 1–200 µg/mL using an ACQUITY QDa™ Mass Detector
- The method provided creatine concentrations that were consistent with the label claims for three dietary supplements
Introduction
Creatine has traditionally been used as a dietary supplement to enhance workout routines by providing added energy to muscles by increasing the content of phosphocreatine, which is a critical component of adenosine triphosphate formation.1,2 More recently, the use of creatine supplements has expanded to improving cognitive function, as an added therapy for certain medical conditions, and as dietary support for vegetarians.3 Due to the increase in use cases, there is a need for tighter control over the manufacturing of creatine supplements, which are regulated in the United States as dietary supplements and not as pharmaceutical drugs. This means that safety, quality and labeling compliance – are the responsibility of the manufacturer. Regulatory requirements vary globally, with some countries requiring premarket notification, registration, or authorization for dietary supplements. While creatine monohydrate is generally regarded as safe, having good manufacturing practices and control is critical in providing a high-quality product. One important quality attribute is minimizing the formation of creatinine, a degradation product of creatine.
Creatinine is formed from creatine in muscles in a non-enzymatic cyclization and dehydration reaction.4 Creatinine can also be formed during manufacturing of creatine supplements, especially in acidic environments or at elevated temperatures.4-6 Minimizing creatinine formation is an important aspect of quality control because it helps maintain product quality and preserves the labeled creatine content. This application note focuses on the analysis of three commercially available creatine supplements using HILIC with MS detection. HILIC was used because both creatine and creatinine are highly polar, leading to poor retention in reversed-phase LC. Some published methods for analyzing creatine and creatinine use ion-pairing reversed-phase or ion chromatography.7,8 However, these often require dedicated systems and are not compatible with MS detection.
HILIC employs polar stationary phases, and high-organic, less polar starting mobile phase conditions, usually containing a high percentage of acetonitrile. Retention in HILIC is driven by partitioning of the analytes into an adsorbed aqueous layer, ionic interactions between the stationary phase and the analytes as well as hydrogen bonding interactions.9-11 In addition to retaining polar analytes, HILIC also improves MS detection compared to reversed-phase LC, as the mobile phases typically contain predominantly acetonitrile, which desolvates more readily than mostly aqueous mobile phases.12 MS provides more selective and sensitive detection than UV allowing accurate quantitation even in the presence of sample components that are incompletely separated from the analytes of interest.
Experimental
Sample Description
Neat Standard and Calibration Curve Generation
Stock solutions of creatine and creatinine were created at 2 mg/mL in water. Both stock solutions were combined in equal volumes to create a combined stock solution with 1 mg/mL of each compound. Subsequently, samples containing 1, 10, 50, 100, and 200 µg/mL were created by diluting the stock solution with 95:5 acetonitrile:water (v:v). Bracketed analyzes of these solutions were performed before and after the samples with triplicate injections. Calibration curves were generated from the combined data sets, n = 6 for each level.
Powdered Creatine Supplements
Two different powdered creatine supplements were obtained and prepared. Powder A contained only creatine monohydrate per the manufacturer’s label. Powder B contained 5 g of creatine monohydrate per 6.35 g of powder due to the presence of flavorants and other fillers. For each sample, the equivalent of 5 g of creatine was weighed and dissolved in 500 mL of water. Samples were subsequently diluted with 95:5 acetonitrile:water (v:v) to a concentration of 0.01 mg/mL (10 µg/mL) of creatine by removing 100 µL of stock sample solution and diluting to 100 mL.
Tablet Creatine Supplement
A creatine supplement tablet containing 1 g of creatine and 56.3 mg of an amino acid blend along with other non-active ingredients was obtained and crushed using a mortar and pestle. The resulting powder was transferred to a centrifuge tube and 10 mL of 90:10 acetonitrile:water (v:v) was added. The sample was vortexed for 1 minute to facilitate extraction, followed by 5 minutes of sonication. The sample was then centrifuged and the resulting supernatant was removed. A 0.2 µm nylon filter was used to remove any particulates. Lastly, the sample was diluted to a nominal concentration of 0.01 mg/mL (10 µg/mL) by taking 10 µL of filtered sample and diluting with 100 mL of 95:5 acetonitrile:water (v:v).
Method Conditions
LC conditions
|
LC system: |
ACQUITY UPLC™ H-Class Plus System with Column Manager (CM), 2 CM-Aux, ACQUITY UPLC PDA Detector and ACQUITY QDa Mass Detector |
|
Detection: |
Mass Detection |
|
Columns: |
ACQUITY Premier BEH™ Amide Column, 2.1 x 50 mm, 1.7 µm ( p/n: 186009504) ACQUITY Premier BEH HILIC Column, 2.1 x 50 mm, 1.7 µm ( p/n: 186010377) Atlantis™ Premier BEH Z-HILIC Column, 2.1 x 50 mm, 1.7 µm ( p/n: 186009978) |
|
Column temperature: |
30 °C |
|
Vials: |
QuanRecovery™ with MaxPeak™ High Performance Surfaces (HPS) Vials ( p/n: 186009186) |
|
Sample temperature: |
10 °C |
|
Injection volume: |
1.0 µL |
|
Flow rate: |
0.4 mL/min |
|
Mobile phase A: |
Water |
|
Mobile phase B: |
Acetonitrile |
|
Mobile phase D: |
200 mM ammonium formate in water pH 3.0 |
Gradient Conditions
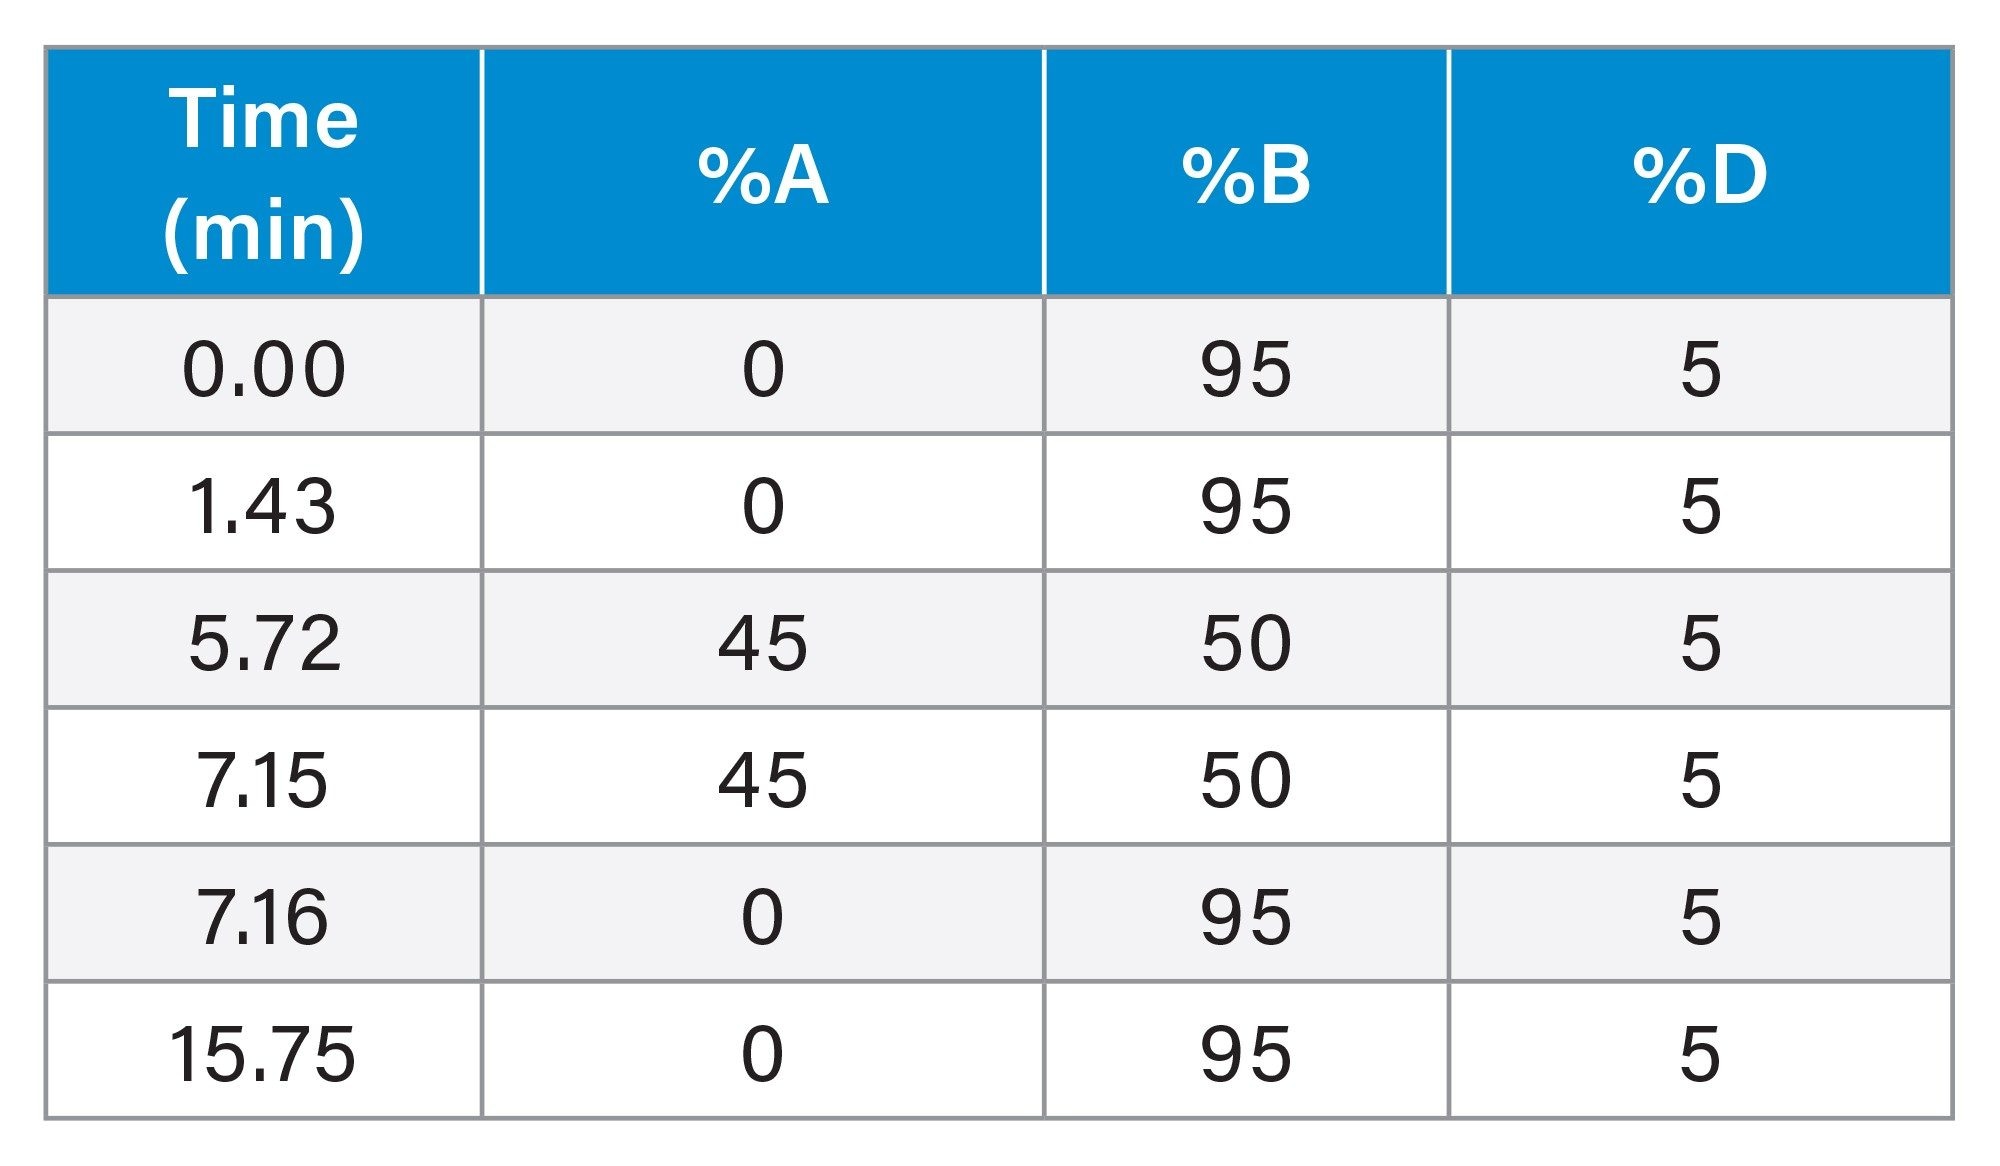
Data Management
|
Chromatography software: |
Empower™ Chromatography Data System (CDS) |
Results and Discussion
Creatine and creatinine have previously been analyzed by ion-exchange chromatography or by reversed-phase liquid chromatography using ion-pairing agents.7,8 These methods are not compatible with mass spectrometry detection due to the use of a non-volatile buffer or ion-pair reagent. HILIC-MS was determined to be an appropriate alternative for creatine analysis in various supplements as the technique can retain polar analytes like free amino acids without the need for specialized mobile phase additives.13
Prior to sample analysis, three HILIC Columns were evaluated to select the best stationary phase for this method. All three columns employ MaxPeak Premier HPS Technology, hereafter referred to as inert hardware. Additionally, all three columns are based on hybrid organic-inorganic particles, the bridged-ethyl hybrid (BEH) particle. This particle has been used in a variety of workflows both for HILIC and reversed-phase separations and is stable over a wide pH range, making it ideally suited for method development activities.14 The three stationary phases differ in the pore size of the particles, and the surface chemistry. Firstly, both the ACQUITY Premier BEH Amide Column and the ACQUITY Premier BEH HILIC Column use 130 Å BEH particles, which is the typical pore size for this particle. The Atlantis Premier BEH Z-HILIC Column, however, uses 95 Å BEH particles. The decreased pore size increases the surface area of the particle as well as the phase ratio, both of which play a role in the overall retentivity of the particle.15
The surface chemistry is also different for the three stationary phases. The BEH HILIC material is unbonded, allowing analytes that partition into the adsorbed aqueous layer to interact directly with the BEH particles and their surface silanol groups. The lack of bonded phase leads to a thinner adsorbed aqueous layer, resulting in lower retention by partitioning. However, because of the presence of ionized silanol groups, the retention is driven also by cation-exchange interactions.16 The BEH Amide stationary phase has polyamide groups bonded to the surface which leads to a thicker adsorbed aqueous layer.17 The bonded groups decrease the concentration of surface silanols, reducing cation-exchange interactions, so the primary retention mechanism of this column is partitioning.16 Lastly, the BEH Z-HILIC Column employs a sulfobetaine functional group bonded to the base particle. The zwitterionic bonded phase not only increases retention through partitioning by forming a thick adsorbed aqueous layer but also allows for weak ion-exchange retention.15
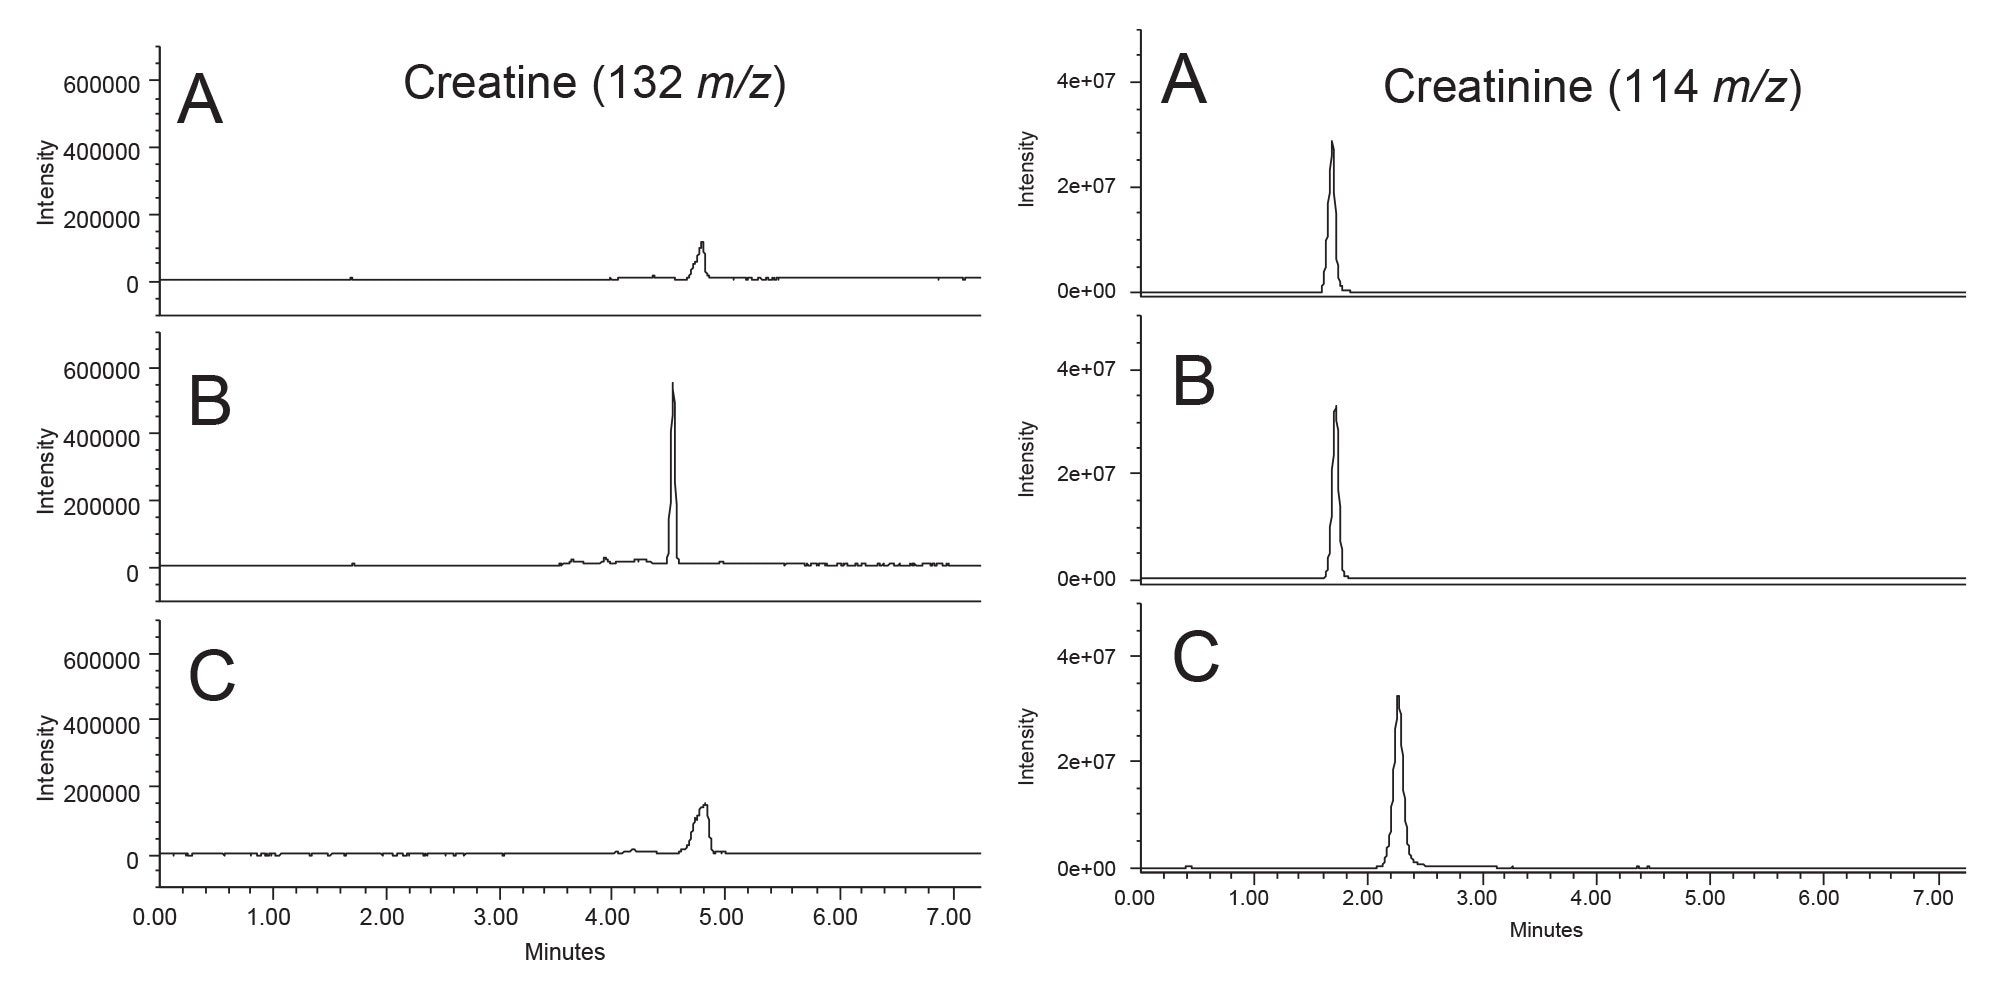
Figure 1 shows chromatograms using selected ion recording (SIR) of creatine and creatinine on the three selected HILIC columns using the generic screening gradient outlined in the experimental section. The BEH HILIC Column showed the best overall result for the two compounds of interest. While all three columns achieved good results for creatinine, the signal intensity and peak shape of creatine was poor for the BEH Amide and BEH Z-HILIC Columns. The poor peak shape and signal intensity on two of the HILIC columns could be due to the multi-modal retention mechanisms at play leading to a broader peak. Both creatine and creatinine are expected to have a net positive charge under the analysis conditions, so cation-exchange is likely an important retention mechanism. The BEH HILIC Column was selected for the sample analyzes.
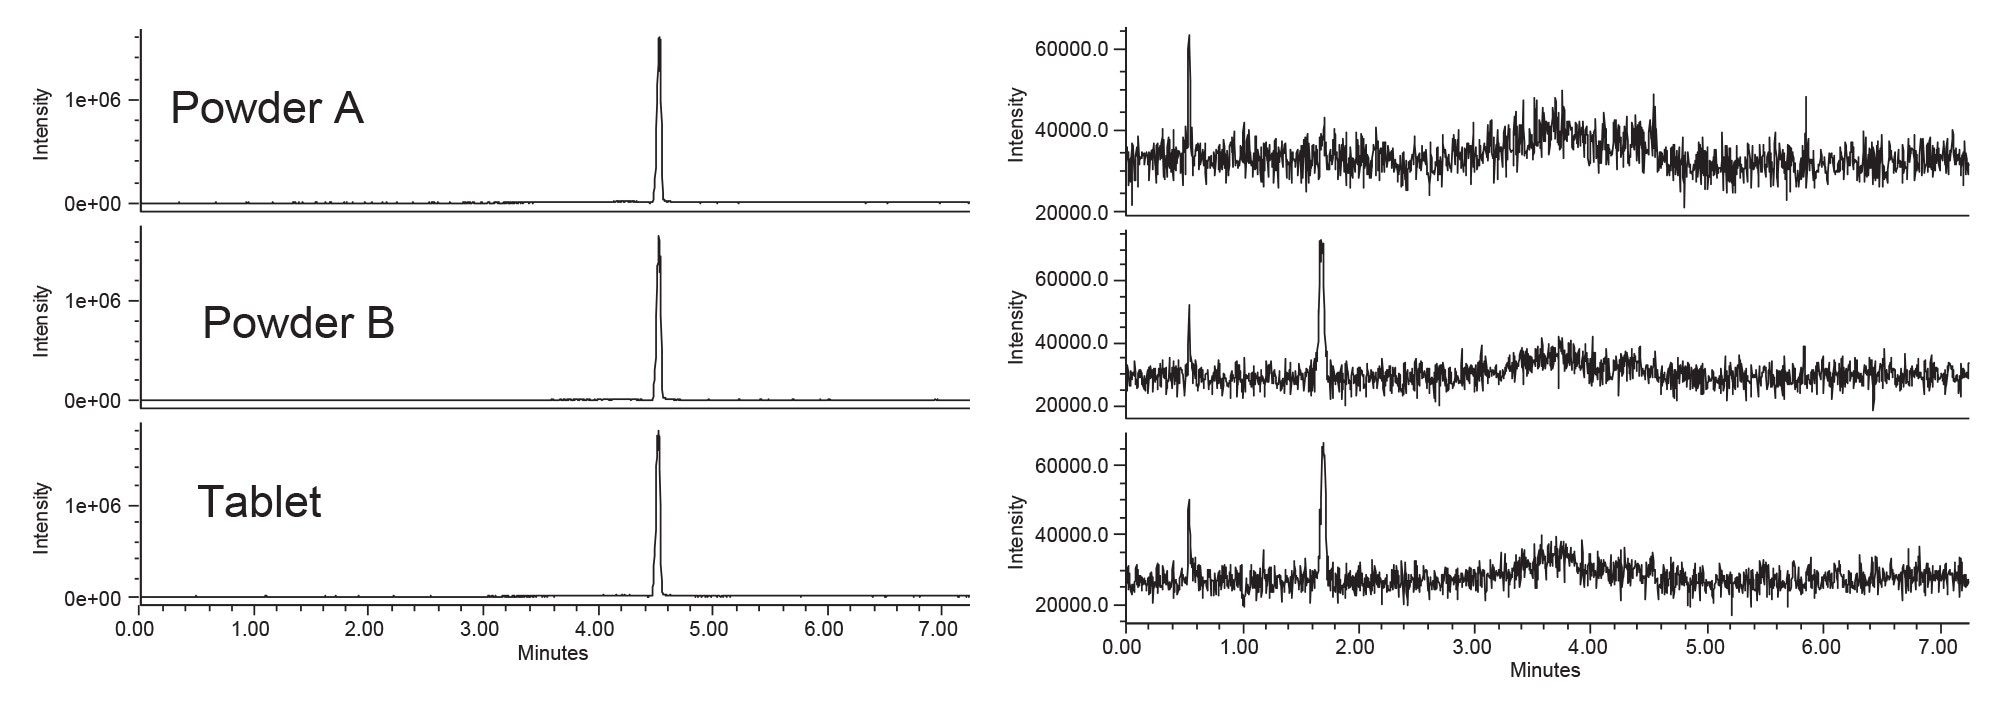
All three samples were analyzed for both creatine and creatinine. Figure 2 shows the SIR chromatograms. The three samples showed approximately the same peak area for creatine which was expected as they were prepared to the same nominal concentration of 10 µg/mL. The creatinine peak areas, however, varied for the three samples. Powder A showed no creatinine, while Powder B and the Tablet sample showed measurable creatinine peak areas. This may be due to different manufacturing processes, different storage conditions or times, or even degradation caused by other components in the samples. It should be noted that Powder A was labeled as pure creatine monohydrate powder while the other samples contain other components like amino acids or flavorants.
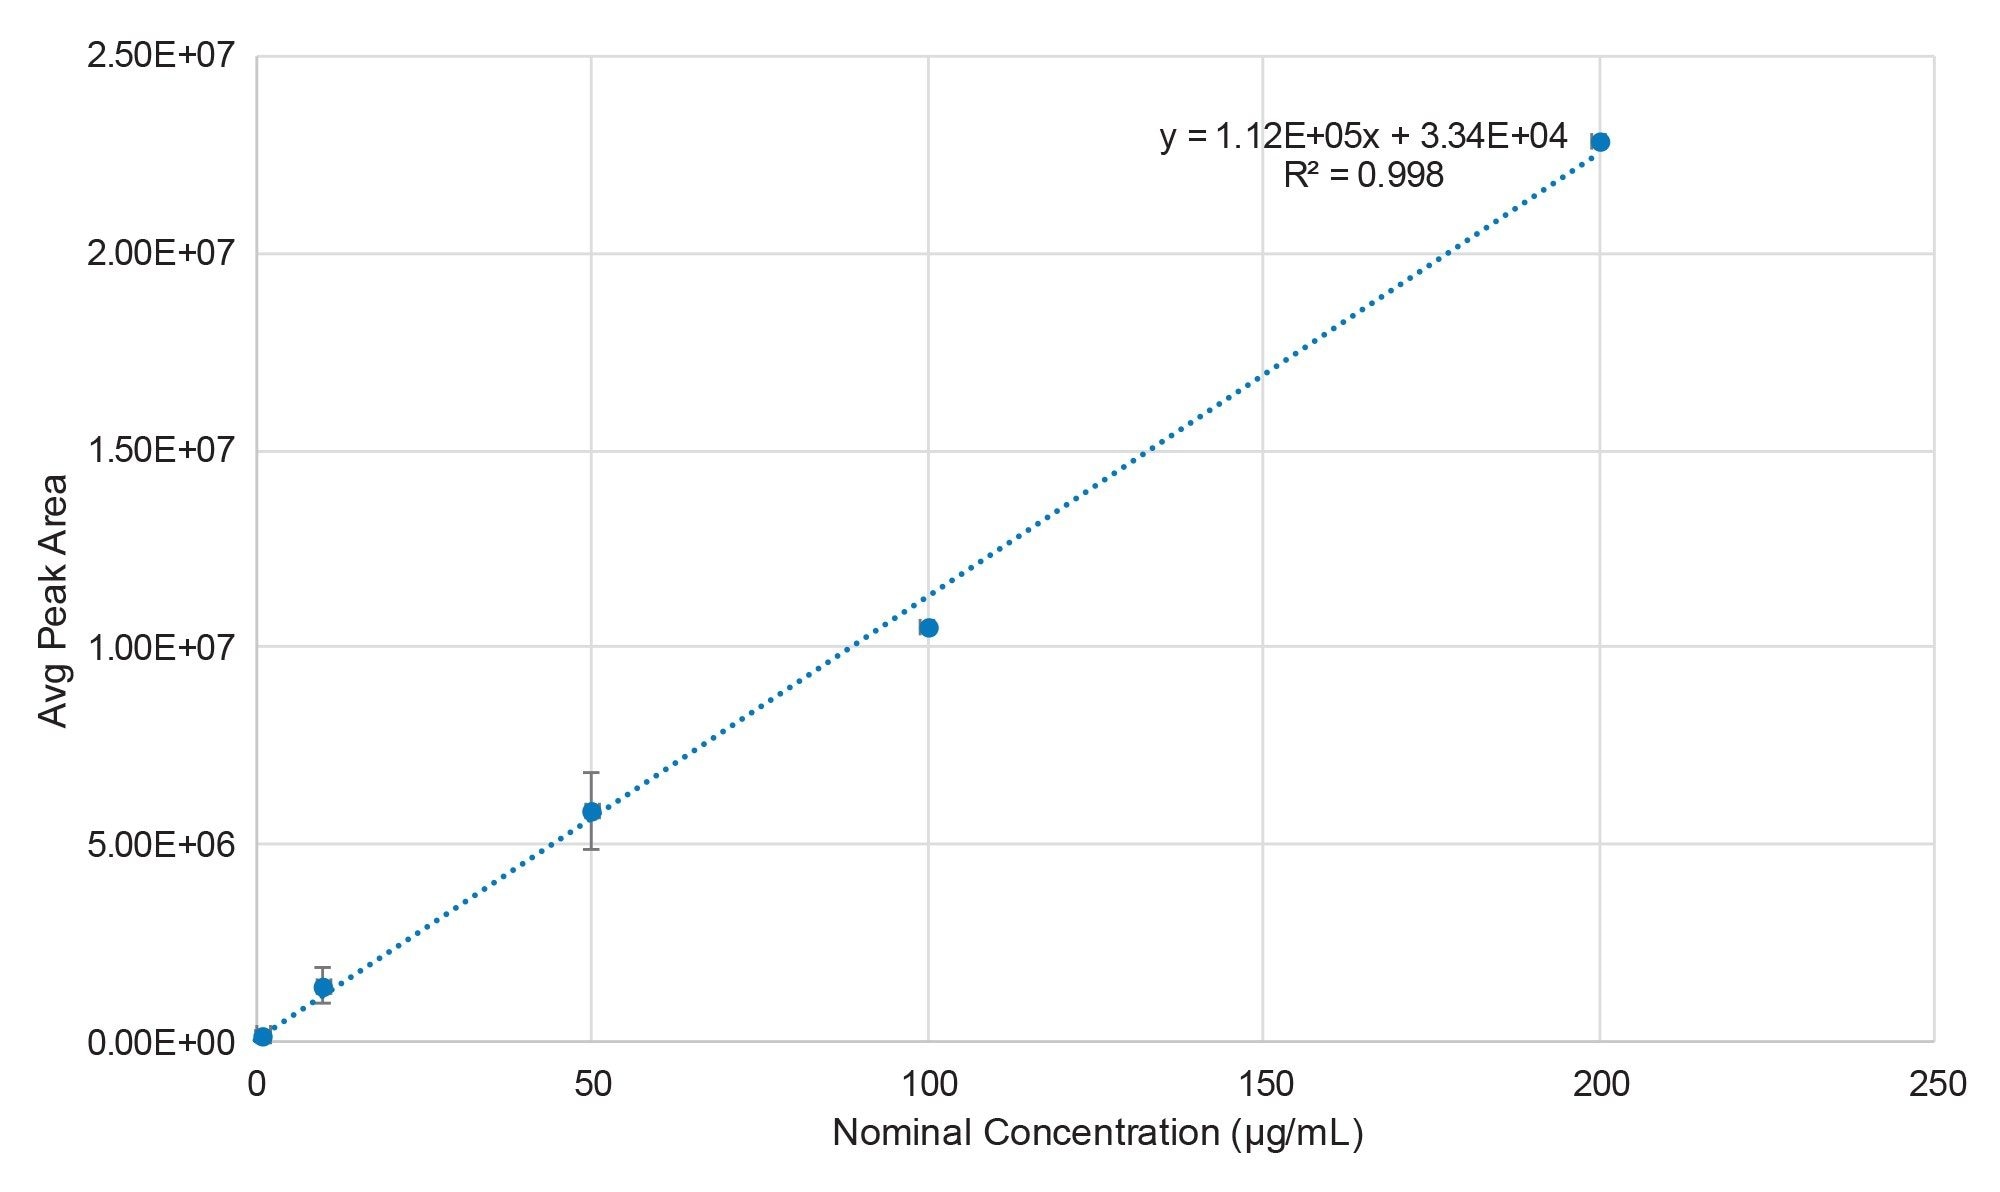
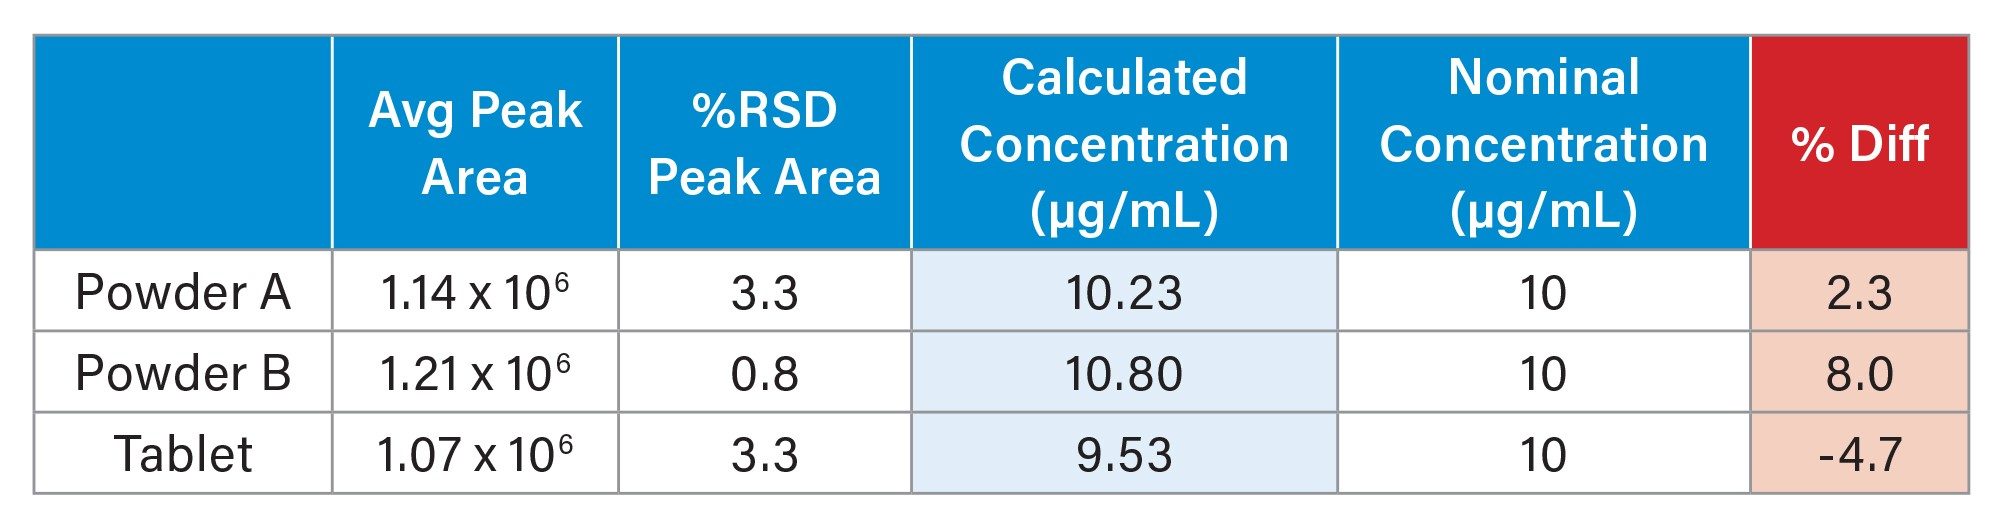
Using bracketed injections, calibration curves for both creatine (Figure 3) and creatinine (Figure 4) were created. Both show good linearity with R2 values of 0.998 and 0.995, respectively, over a concentration range of 1–200 µg/mL. Inputting the average peak areas from the sample injections (n = 3) into the trendline equation, the concentrations of creatine for each sample were calculated (Table 1). The calculated concentrations were all within 8% of the nominal concentration of 10 µg/mL. The good agreement between the calculated and nominal concentrations indicates minimal degradation during the analysis and suitability of this method for the quantification of creatine in dietary supplement samples.
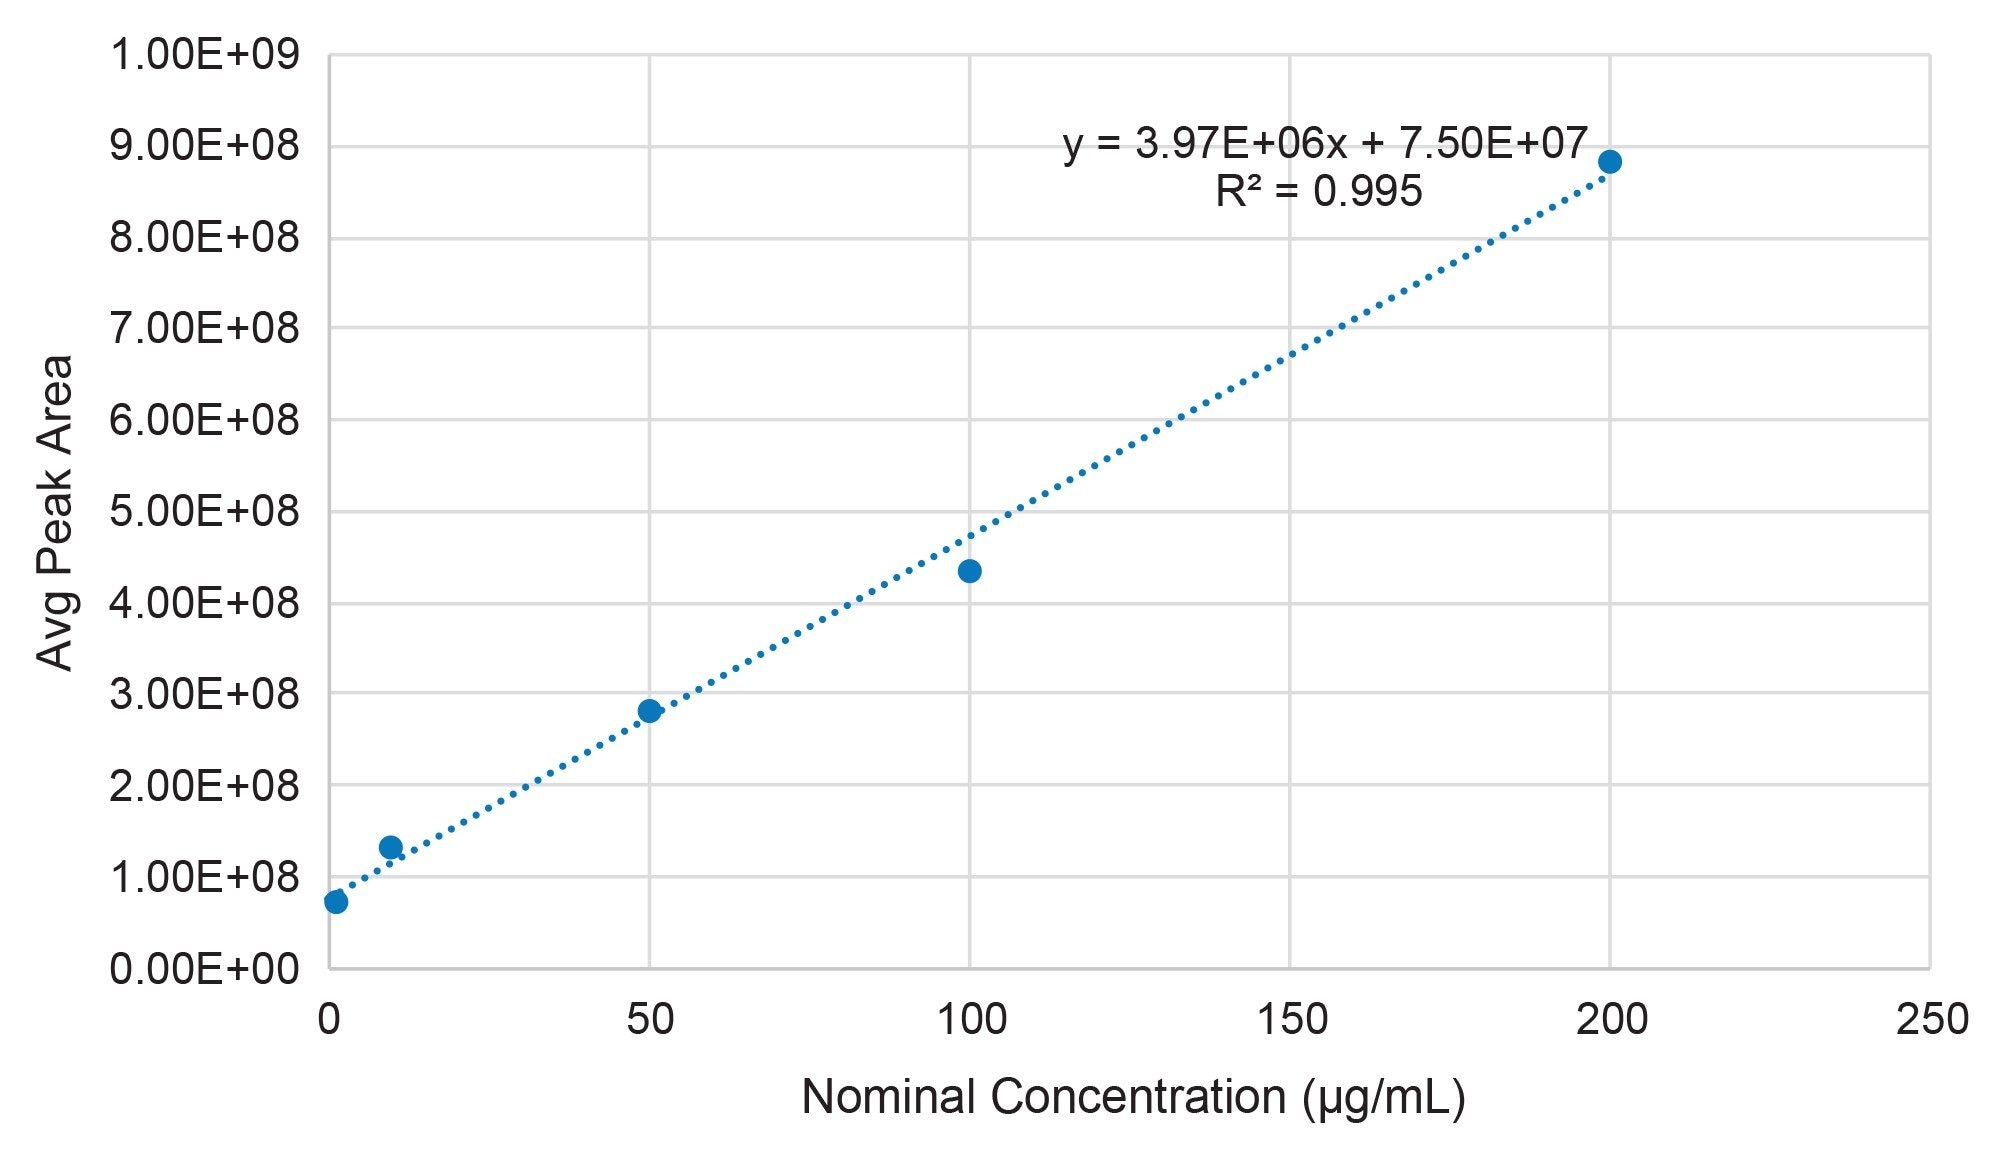
While the quantification of creatine was straightforward, the analysis of creatinine was not. As shown in Figure 2, the diluted samples have very low levels of creatinine present. For Powder A, there is none detected at all. The other samples have levels of creatinine lower than the linear calibration range, as shown in Figure 4. However, single injection analysis of the stock samples shows considerably higher levels of creatinine and are within the dynamic range of the method. Table 2 shows the calculated concentration of creatinine in the three supplement samples.
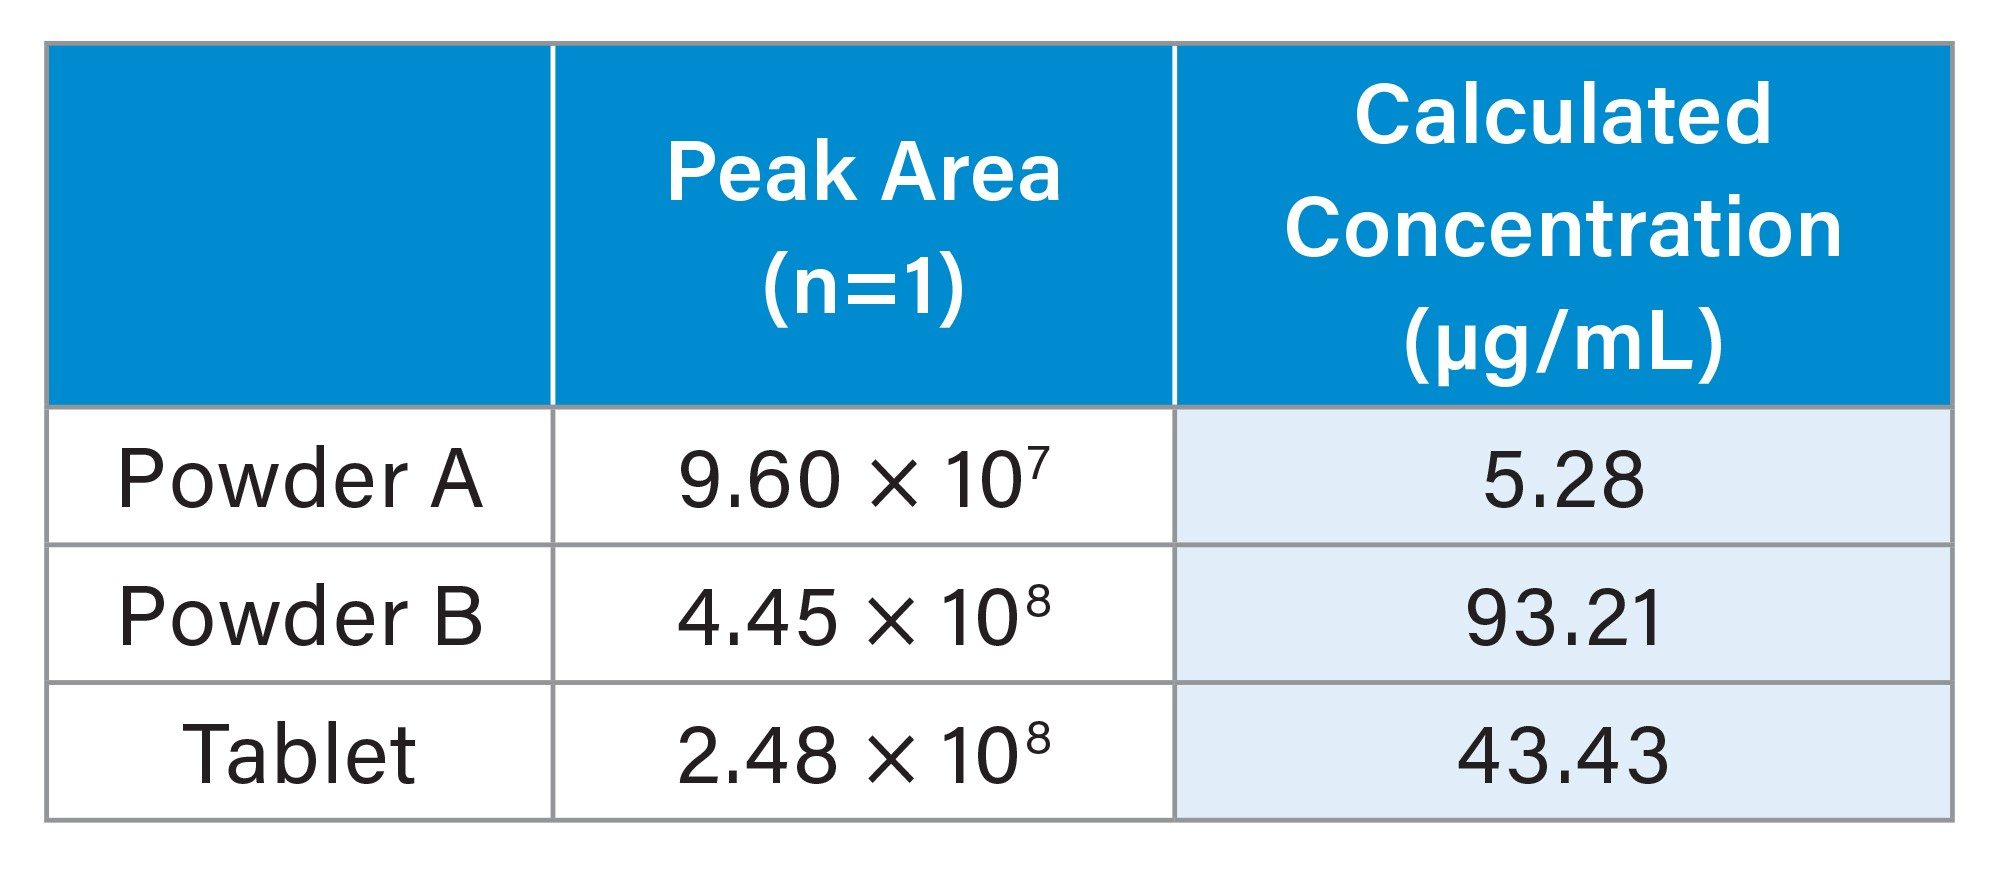
The levels of creatinine differ across the three supplement samples, which could be caused by the presence of other compounds in the sample matrices and resulting sample solutions. The presence of native acidic compounds, even weak ones like malic acid or citric acid, could contribute to creatinine formation for a given sample. It should be noted that the calculated values shown are for a single injection and not replicates.
An additional consideration for this method is potential interference from other components in the samples. Of the three samples analyzed, two have other ingredients besides creatine monohydrate. The stock solutions of each sample were analyzed to determine if the method adequately separates creatine and creatinine from the other components. Of those listed on the labels of Powder B and the Tablet sample, the structures of the additional components detected are listed in Table 3. Malic acid is only present in Powder B, while components 4–7 are only present in the Tablet sample. The ingredients which were not detected may not have ionizable groups or a chromophore, may be in such low concentrations that they are below the detection limits, or may retain beyond the gradient method employed.
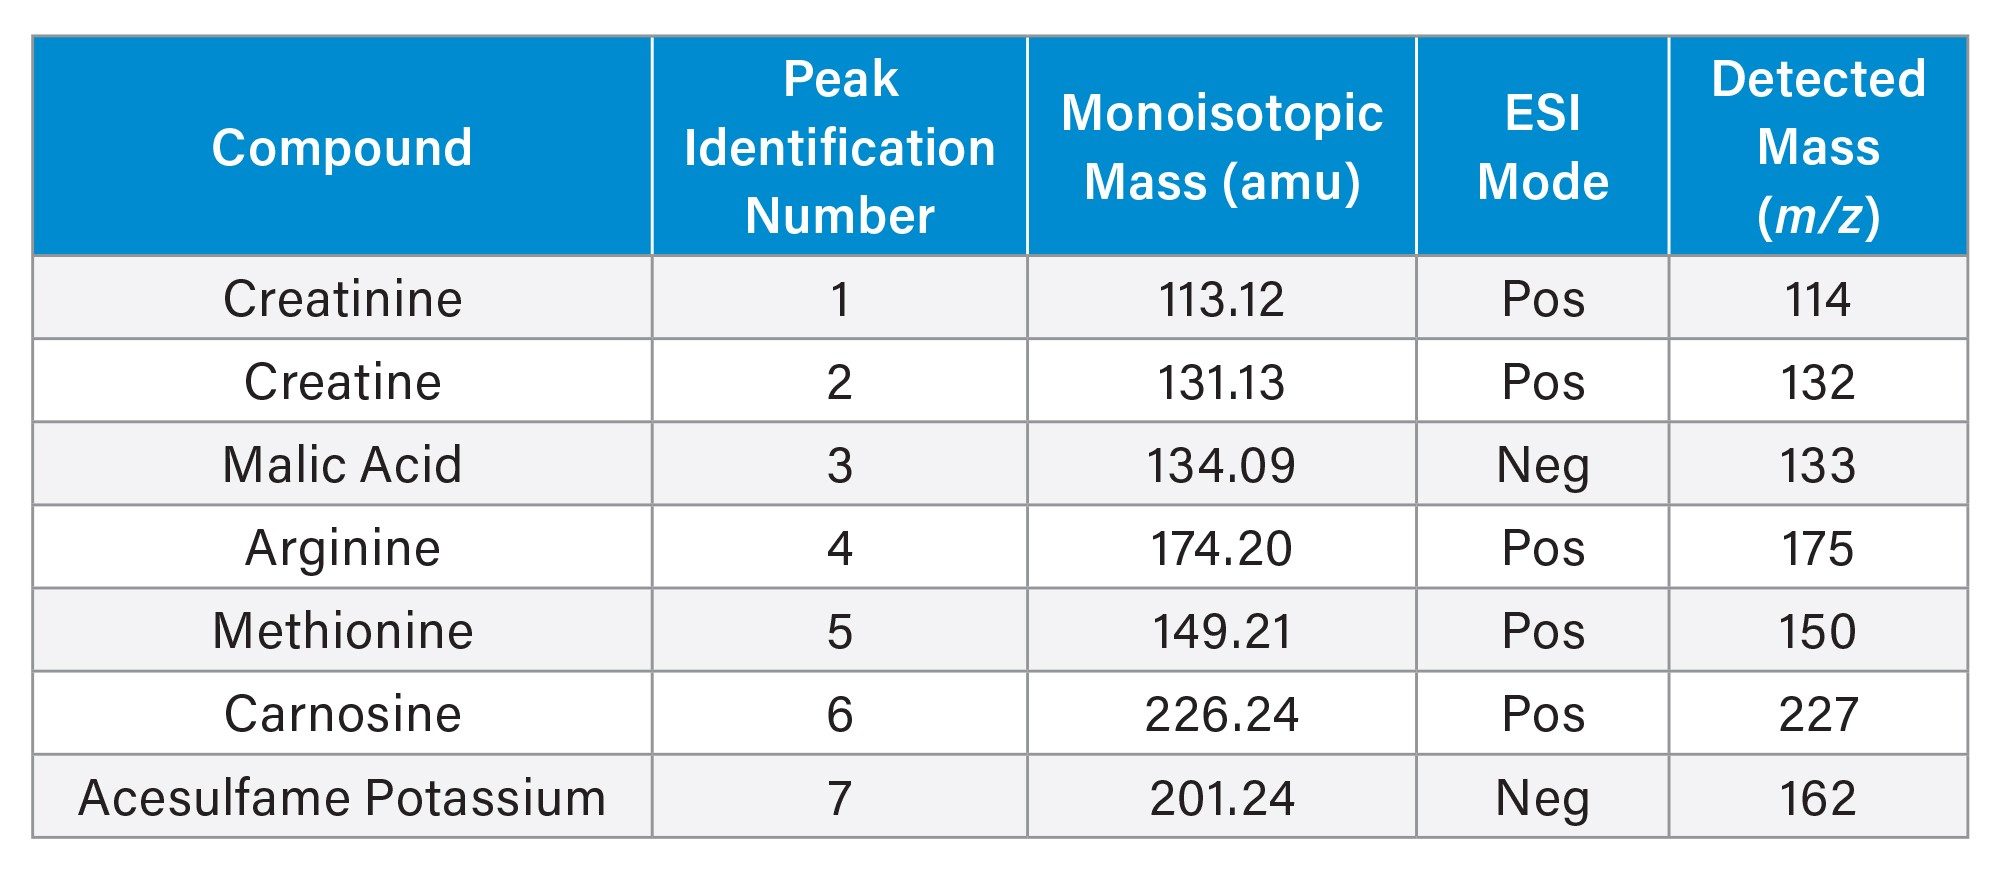
Figures 5 and 6 show extracted ion chromatograms (EICs) of the components for the Powder A and Tablet samples, respectively. All of the components are well resolved from both creatine and creatinine with the exception of malic acid (Figure 5, peak 3), which partially co-elutes with creatine. However, since malic acid only ionizes in ESI- mode, and creatine ionizes in ESI+ more readily, the two can easily be distinguished. As shown in Figure 6, the chromatograms for the Tablet sample show good resolution between creatine and the amino acids, even though creatine is severely overloaded in this high concentration sample.
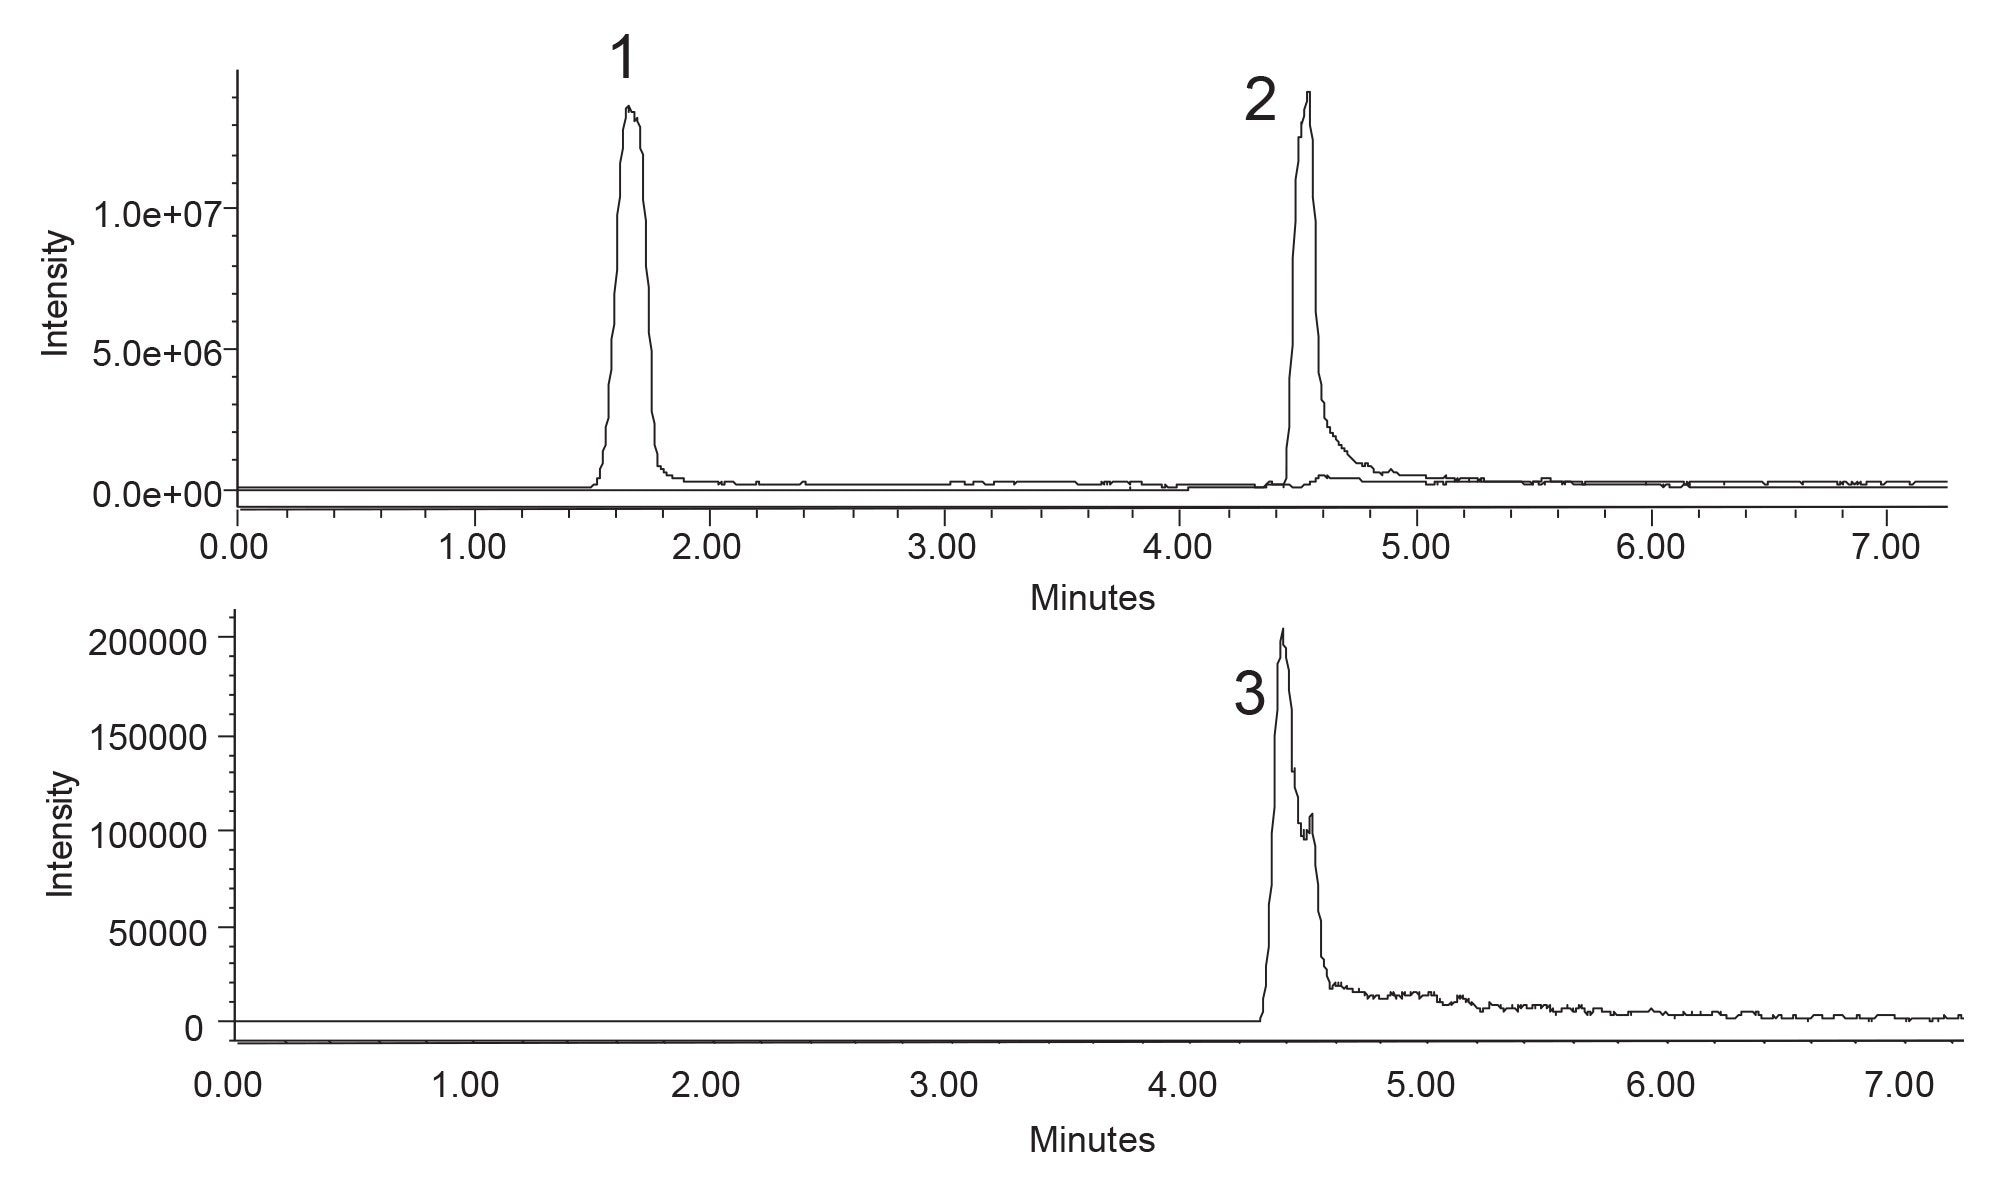
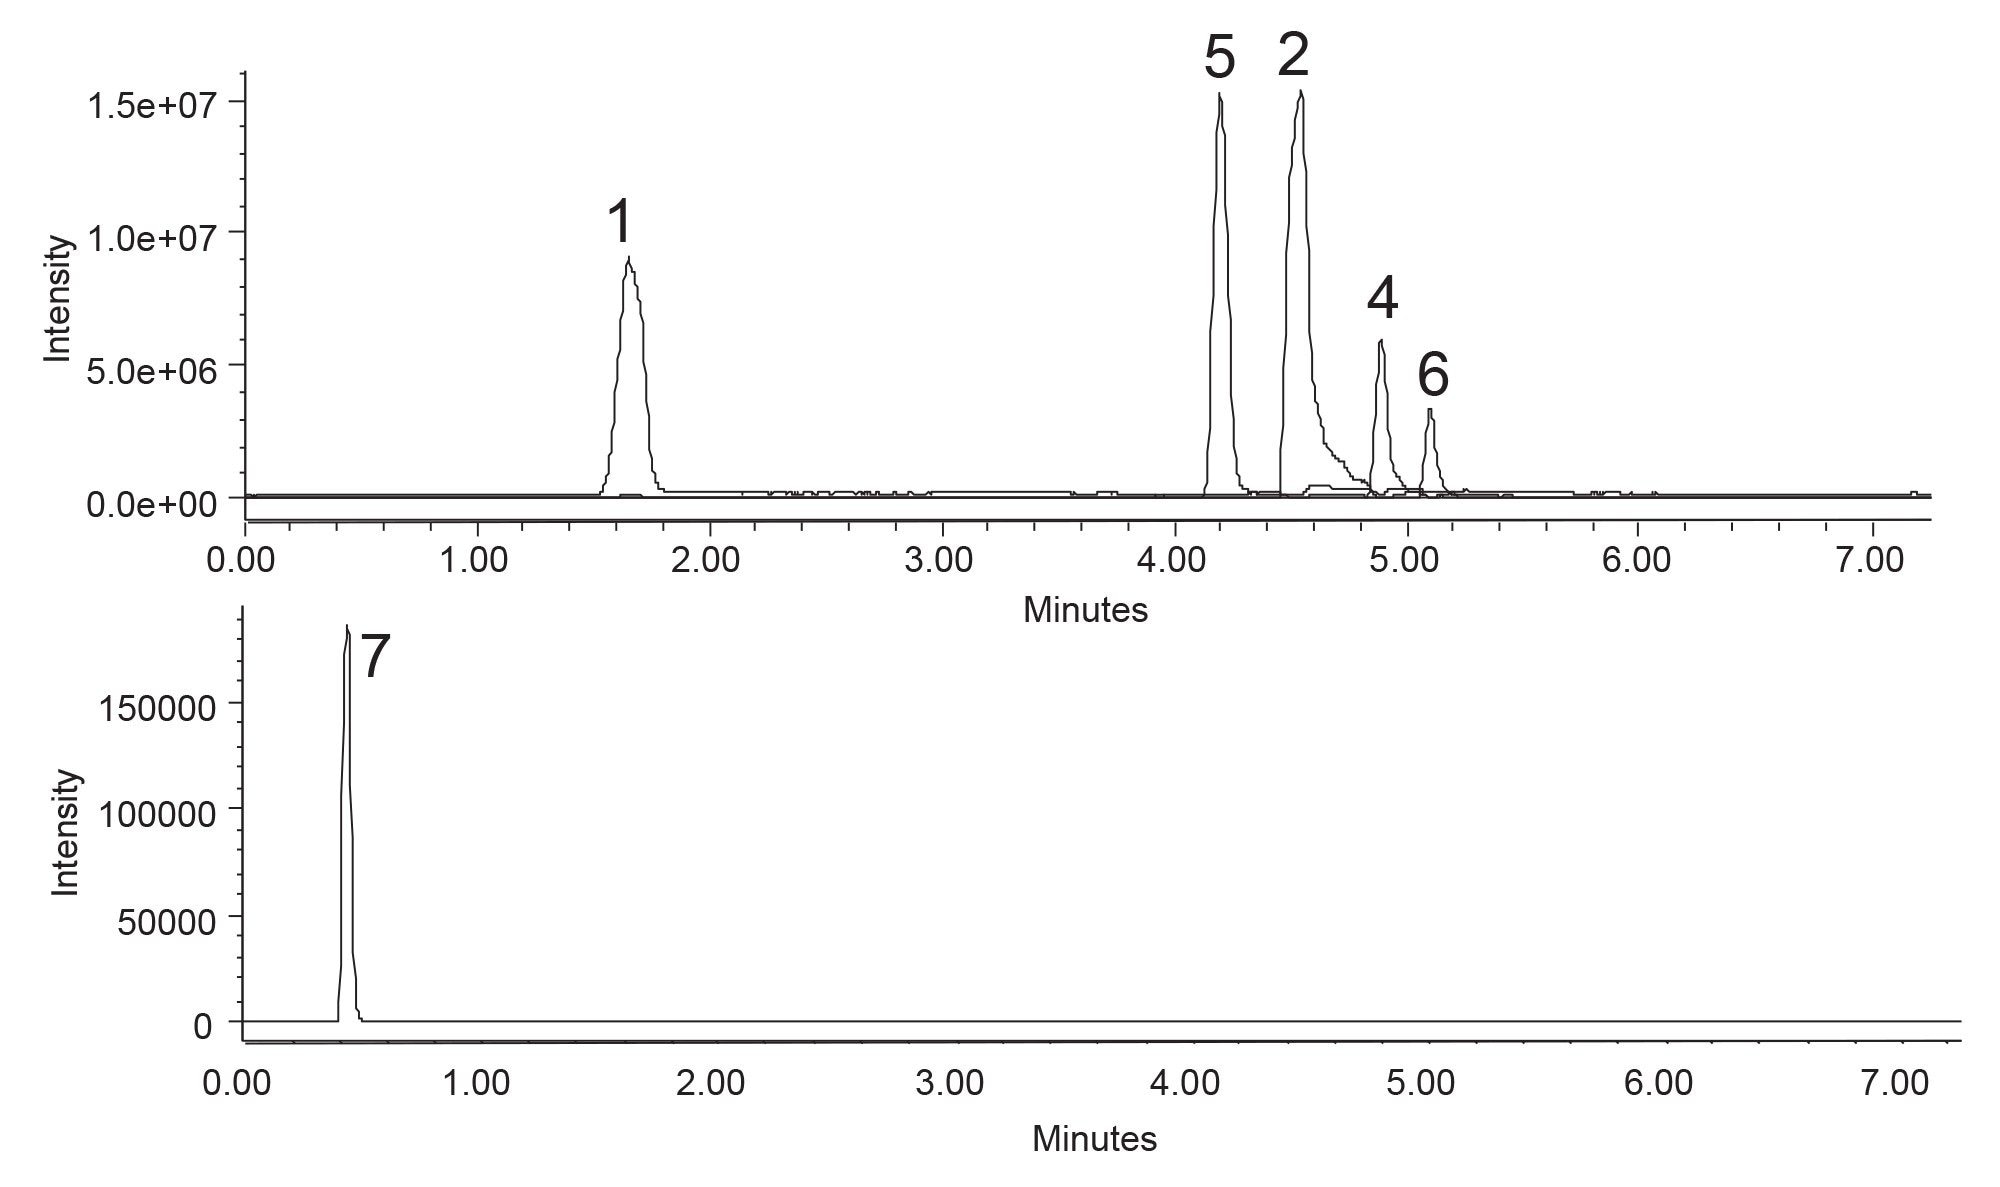
The separation achieved using the ACQUITY Premier BEH HILIC Column shows the capability of detecting and potentially quantifying additional components present in formulated samples. Additionally, by eliminating the need for non-volatile buffers or ion-pairing agents, mass spectrometry detection can be used, improving the selectivity and sensitivity of the method, thus allowing for more accurate characterization of the samples.
Conclusion
Successful quantitation of creatine was demonstrated for three dietary supplements using HILIC-MS with an ACQUITY Premier BEH HILIC Column. Good linearity was obtained for creatine and creatinine over a concentration range of 1–200 µg/mL as well as good agreement between the experimental and nominal creatine concentrations. Lastly, the method achieved adequate separation of creatine, creatinine and additional components including amino acids and flavorants.
References
- Clark, J.F. Creatine and phosphocreatine: a review of their use in exercise and sport. J. Athl. Train., (1997) 32, 45–51.
- Brosnan, J.; Brosnan, M. Creatine: Endogenous Metabolite, Dietary, and Therapeutic Supplement. Annu. Rev. Nutr. (2007) 27, 241–261.
- Beal, M.F. Neuroprotective effects of creatine. Amino Acids. (2011) 40, 1305–1313.
- Wyss, M.; Kaddurah-Daouk, R. Creatine and Creatinine Metabolism. Physiol. Rev. (2000) 80, 3, 1107–1213.
- Saiki, P.; Sales, G.M.; de Oliveira, A.; Catharino, R. Multi-analytical characterization of creatine degradation for dietary supplement safety assessment. Food Res. Int. (2025) 221, 117472.
- Kashani, K.; Rosner, M.H.; Ostermann, M. Creatinine: From physiology to clinical application. Eur. J. Intern. Med. (2020) 72, 9–14.
- Moret, S.; Prevarin, A.; Tubaro, F. Levels of creatine, organic contaminants and heavy metals in creatine dietary supplements. Food Chem. (2011) 126, 1232–1238.
- Dunnett, M.; Harris, R.C.; Orme, C.E. Reverse-phase ion-pairing high-performance liquid chromatography on phosphocreatine, creatine, and creatinine in equine muscle. Scand. J. Clin. Lab. Invest. (1991) 51, 137-141.
- Guo, Y.; Muscatiello, D. An update on the progress in fundamental understanding of hydrophilic interaction liquid chromatography. J. Chromatogr. A. (2026) 1765, 466520.
- Guo, Y.; Baran, D.; Ryan, L. Quantitative Assessment of Retention Mechanisms for Ionized Compounds in Hydrophilic Interaction Chromatography (HILIC). Anal. Chem. (2025) 97 (7) 4057–4065.
- Buszewski, B.; Noga, S. Hydrophilic interaction liquid chromatography (HILIC) – a powerful separation technique. Anal. Bioanal. Chem. (2012) 402, 231–247.
- Periat, A.; Boccard, J.; Veuthey, J.L.; Rudaz, S.; Guillarme, D. Systematic comparison of sensitivity between hydrophilic interaction liquid chromatography and reversed phase liquid chromatography coupled with mass spectrometry. J. Chromatogr. A. (2013) 1312, 49–57.
- Berthelette, K.; Kalwood, J.; Haynes, K. Development and Optimization of a HILIC-MS Separation of 17 Amino Acids Using an XBridge Premier BEH Amide Column. Waters Application Note. 720008010.
- Walter, T.H. Advances in Chromatography Vol. 60, Recent Advances in HPLC and SFC Columns Packed with Hybrid Organic/Inorganic Particles, CRC Press, 2024, 44–78.
- Walter, T.H.; et al.Characterization of a highly stable zwitterionic hydrophilic interaction chromatography stationary phase based on hybrid organic/inorganic particles. J. Sep. Sci. (2022) 45, 1389–1399.
- Gilar, M.; Berthelette, K.; Walter, T.H. Contribution of ionic interactions to stationary phase selectivity in hydrophilic interaction chromatography. J. Sep Sci. (2022) 45 (17), 3264–3275.
- Guo, Y.; Bhalodia, H.; Fattal, B.; Serris, I. Evaluating the adsorbed water layer on polar stationary phases for Hydrophilic Interaction Chromatography (HILIC). Separations (2019), 6, 19–28.
720009560, August 2026


