Chromatographic Separation and Photodiode Array Identification of Synthetic Industrial Dyes in Foods, Beverages, Over the Counter (OTC) Drugs, and Cosmetics
Catharine E. Layton, Paul D. Rainville, Amy Woodsmall
Waters Corporation, United States
Published on May 23, 2025
Abstract
In this application note, the Waters Alliance™ iS HPLC System with Waters Photodiode Array (PDA) Detector is shown to separate synthetic food dyes formulated in a variety of foods, beverages, OTC drugs, and cosmetics. Three individual wavelengths were extracted from one HPLC injection to quantify yellow, red, and blue and green synthetic dyes. The PDA software determined chromatographic peak purity by UV spectral analysis, and identified dyes according to an Empower™ Software PDA Library.
Benefits
- A single chromatographic method separated ten synthetic food dyes in a variety of consumer products and matrices
- Empower Software, when paired with the Alliance iS HPLC System with PDA Detector, can determine peak purity for chromatographic separations of food dye containing products
- Synthetic food dyes in complex matrices are spectral identified using the Empower Software PDA Library
Introduction
Food, drug, and cosmetic (FD&C) dyes are used to enhance visual appeal, reduce natural product variation, and increase overall product recognizability and desirability. Synthetic food dyes are typically are less expensive than natural dyes, relatively shelf-stable, and blend easily to create a variety of hues of intense color.1 In the US, the most popular colors are Red #40, Yellow #5, and Yellow #6.2 Food dye ingredients are often in the news due to concerns regarding neurobehavioral impacts on children, particularly hyperactivity, inattentiveness, restlessness, and other behavioral problems.3 As a result, some US states, such as California, prohibit the sale of products that contain synthetic food dyes in schools, while other states, such as West Virginia, have moved a step further by prohibiting synthetic dye containing food products throughout the state.4 In addition to neurobehavioral concerns, Red #3, also known as erythrosine, was shown in a 2022 US Food and Drug Administration (FDA) petition to cause cancer in male laboratory rats. With this data, the FDA revoked the authorization for use of Red #3 in consumer products, issuing a complete phase out of the ingredient across the US by 2028.5
In the US, FDA-regulated food products, cosmetics, and OTC drugs require that package labels include a statement of identity, net quantity of contents, nutrition information, an ingredient list, and the identity of the manufacturer, packer, or distributor.6 Synthetic food dyes are required to be listed as they appear in the Code of Federal Regulations (CFR), and the product manufacturer must use color additives that are Certificate of Analysis (CoA) batch-certified, which includes content and purity analysis.7 The FDA works to continuously monitor adulterated or misbranded products, and, notably, color additive violations are a common reason for import refusals of food and cosmetic products offered for entry to the US.8
In this application note, a variety of common off-the-shelf snacks, drinks, OTC drugs, and cosmetics were analyzed using the Alliance iS HPLC System with PDA Detector. The Alliance iS HPLC System was used to chromatographically separate, quantify, and identify ten synthetic food dyes, including Red #3, recently banned in the US. The PDA Detector, in combination with Empower Software, provided chromatographic purity analysis and identified synthetic food dye extracted from matrix using a PDA Library.
Experimental
LC Conditions
|
LC system: |
Alliance iS HPLC System with PDA Detector, Software version 1.4.0 |
|
|
Column: |
XBridge™ Premier BEH™ C18 2.5 µm, 4.6 x 150 mm, p/n: 186009849 |
|
|
Column temperature: |
40 °C |
|
|
Sample temperature: |
20 °C |
|
|
Injection volume: |
30 µL |
|
|
Flow rate: |
1.6 mL/min |
|
|
Mobile phase A: |
10 mM Ammonium acetate pH 7.0 |
|
|
Mobile phase B: |
Methanol |
|
|
Mobile phase C: |
Acetonitrile |
|
|
Sample filter: |
0.2 µm PTFE CE Acrodisk Minispike Filter, p/n: WAT200556 |
|
|
Needle wash: |
50/50 Methanol/Water |
|
|
3D Wavelengths: |
200–800 nm |
|
|
Resolution: |
1 nm |
|
|
Data rate: |
10 Hz |
|
|
Extracted channels: |
455 nm (Yellows), 520 nm (Reds), 628 nm (Blues and Greens) |
|
|
CDS: |
Empower Software, Version 3.8.0 |
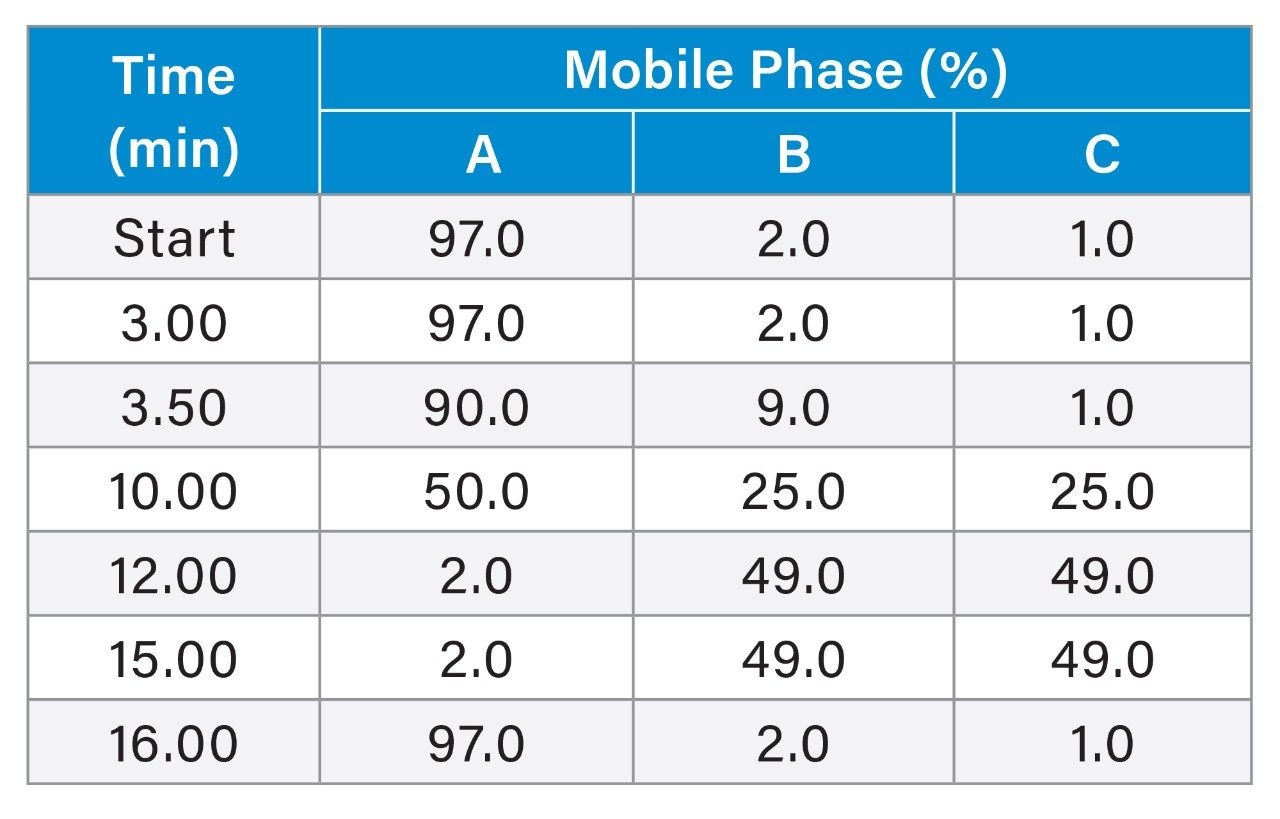
Gradient Table
Sample Preparation
Yellow #5, Yellow #6, Blue #2, Red #40, Green S, Carmoisine, Green #3, Blue #1, Red #3, and Patent Blue V food dye certified reference standards were obtained from Sigma-Aldrich®. Standards were solubilized in water to equal a concentration of 1.0 mg/mL. A standard stock mixture was prepared to contain each dye at 0.1 mg/mL. From the mixture, serial dilutions were prepared in dye-free sports drink to equal HPLC column sample loads between 0.003 ug to 0.375 ug of each dye. From the linearity injections, a PDA Library was created in the Empower Software (Table 1). For solid samples, one serving was dissolved in a respective volume of water (i.e. 10–200 mL). Each extraction was sonicated or stirred until the matrices were dissolved. The extractions were centrifuged for 10 minutes at 15,000 RPM to separate insoluble material, and the supernatant used for analysis. For analysis of sports drinks, each beverage was diluted 1:10 in water prior to HPLC injection.


Results and Discussion
The HPLC method provided baseline separation of all reference standards in the dye mixture. Using the Empower Software Method Set (Figure 1), chromatograms at various wavelengths were visualized, and peaks quantified from the 3-D, 200-800 nm chromatogram. Yellow dyes were visualized by extracting a UV channel at 455 nm, while 520 nm was utilized for red dyes, and 628 nm utilized for both green and blue dyes (Figure 2). A PDA Library was created from the reference standard mixture injections after wavelength extraction. The chromatographic separation method showed linearity between 0.003 ug and 0.750 ug (Figure 3), mass on column.


Peak purity analysis was performed for each dye peak in sample solutions using the Empower Software Processing Method. As a representative example, dyes in fruit flavored candy were visualized at the respective wavelengths, as shown in Figure 4. Peak purity for dye peaks was determined by the software through automated PDA spectral Purity Angle and Purity Threshold comparison (Figure 5). In the fruit flavored candy, the Purity Angle was below the spectral Purity Threshold of a selected matrix-only region of the baseline, therefore chromatographic peaks were spectrally pure and absent of co-eluting constituents. Dye peaks in the fruit flavored candy were identified as Yellow #5, Yellow #6, Red #40, Blue #1, and Blue #2 using the Match Angle of reference spectra stored in the PDA Library (Figure 6).


Samples were ranked according to the total quantity of synthetic food dye per serving (Table 3). The highest amount was found in the spicy hot snack sticks. The product contained primarily Yellow #6, combined with a relatively low quantity of Red #40. The visual appearance, a deep yellow, flour derived product heavily coated in red powder, correlated with the dye ratio reflected by the chromatographic results. Additionally, upon extraction, the product showed the most intense color by visual inspection when compared with other samples.
The second highest dye content per serving was observed in beverages. The single serving size of sports drinks was 360 mL. As a result, the mass of dye per serving was relatively high compared to small serving size products. Chewy fruit candy, coated chocolate, and jellybeans, packaged in approximately 2 oz bags per serving, showed the highest combination of different dyes (i.e. Red #40, Blue #1, Blue #2, Yellow #5, and Yellow #6) when compared to other samples. The dye content in the candy ranged between 4.8 mg and 18.6 mg per serving.
The quantity of dye per serving in individually wrapped, single flavor, sour hard candy ranged between 0.1 mg and 0.6 mg per serving. Each individually wrapped, sour hard candy weighed approximately 3.0 g, and was 1.0 cm2 in diameter, which is a relatively small serving size. OTC drugs and cosmetics were the lowest of the samples tested, again due to the relatively small serving size. Over the counter syrup, gelcaps and tablets, contained 0.5 mg of dye or less per serving, which was equivalent to mouthwashes and toothpastes, which are not intended for ingestion by the consumer.

Conclusion
In the work presented here, we showed a single chromatographic method for separation of ten synthetic food dyes in a variety of consumer products. Empower Software peak purity analysis confirmed that the Alliance iS HPLC System with PDA Detector successfully resolved dyes from matrix constituents. Detector linearity and peak purity analysis provided accurate dye quantification, while PDA Matching identified dyes against reference spectra stored in the PDA Library. With the method presented, synthetic dyes in a variety of food matrices can be quantified and identified.
References
- Color Additives - Information for Consumers | FDA, Accessed April 4, 2025.
- https://www.healthline.com/nutrition/food-dyes#:~:text=The%20most%20popular%20food%20dyes,in%20the%20US%20(%203%20), Accessed April 4, 2025.
- Synthetic food dyes: Health risks, history, and policy | Center for Science in the Public Interest, Accessed April 4, 2025.
- https://governor.wv.gov/article/governor-patri15ck-morrisey-signs-food-dye-legislation-law, Accessed April 4, 2025.
- https://www.fda.gov/industry/color-additives/fdc-red-no-3, Accessed April 4, 2025.
- https://www.fda.gov/industry/color-certification/color-certification-faqs, Accessed April 8, 2025.
- https://www.federalregister.gov/documents/2016/05/27/2016-11867/food-labeling-revision-of-the-nutrition-and-supplement-facts-labels, Accessed April 8, 2025.
- https://www.fda.gov/industry/color-certification/color-certification-faqs#:~:text=the%20United%20States.-,How%20to%20Make%20Sure%20Certifiable%20Color%20Additives%20Are%20From%20a,has%20in%20fact%20requested%20certification, Accessed April 8, 2025.
- https://pubchem.ncbi.nlm.nih.gov, Accessed April 7, 2025.
Featured Products
720008806, May 2025