Characterization with Relative Quantitation of Adeno-Associated Viruses (AAVs) using Xevo Charge Detection Mass Spectrometry (CDMS)
Anisha Haris, Emily Christofi, David Eatough, Rebecca J. D’Esposito, David Bruton, Keith Richardson, Jakub Ujma, Ying Qing Yu, Kevin Giles
Waters Corporation, United States
Published on October 13, 2025
Abstract
Recombinant adeno-associated virus (AAV) vectors have emerged as a critical delivery vehicle for gene therapy. With AAV-based gene therapy continuing to evolve, there is an increasing need to provide advanced analytical tools to better characterize the therapeutics and to facilitate their production. Analytical focus is placed on full, partial, and empty capsid characterization and impurities due to the potential impacts that they may have on clinical efficacy, safety, and immunogenicity. Charge detection mass spectrometry (CDMS), using an electrostatic linear ion trap (ELIT), is an ultra-high mass technique, which provides direct mass measurement of individual ions through simultaneous determination of their mass-to-charge ratio (m/z) and charge (z). Here, Xevo™ CDMS is employed to analyze AAVs and their product-related impurities including the detection of empty and partially filled capsids. The empty, partial, and full particles in six manufactured AAV formulations were readily achieved, including the relative quantification of empty and full particles based on the peak area ratios of the average masses detected. Characterization of additional critical quality attributes (CQAs) of AAVs are also provided, including the presence of low molecular-weight impurities.
Benefits
- Direct mass measurement of individual AAV particles enables precise differentiation of empty, partial, full, and overfull capsids.
- Eliminates need for isotopic resolution or complex deconvolution, streamlining analysis of high-mass, heterogeneous samples.
- High sensitivity and reproducibility across serotypes, supporting robust quality control and regulatory confidence.
- Minimal sample prep and broad applicability, making Xevo CDMS ideal for real-time monitoring throughout AAV manufacturing.
Introduction
With the therapeutic landscape shifting from -kilo to -megadalton (MDa) scale, the need to better characterize these new modalities has pushed the boundaries of mass spectrometry. While electrospray ionization mass spectrometry (ESI MS) is the gold standard method to characterize biomacromolecules through intact mass measurements, it is limited in its resolution capabilities for large, highly complex and heterogeneous biomacromolecules. CDMS, which is a single particle approach, helps bridge that gap by direct measurement of the ion mass through simultaneous measurement of the m/z and z, which are independent parameters. Unlike conventional mass spectrometry techniques, the Xevo CDMS platform generates mass spectra for high-mass analytes without requiring isotopic resolution or time-consuming deconvolution post-processing.1,2
AAVs are gene therapy vectors, which encapsulate a single stranded DNA and are nonpathogenic, do not self-replicate, and are available in a range of serotypes. However, not all capsids contain the required genetic material; a small fraction may contain truncated DNA or non-functional DNA. Variability in AAV capsid content may necessitate higher dosing, which in turn can elevate the risk of eliciting an immune response against the vector. Process conditions during manufacturing can influence the ratio of empty, partial, and full AAV capsids, making it essential to quantify these species to guide product and process development and to assess the purity of clinical and commercial materials. 3,4 Orthogonal techniques for analyzing AAV capsid content each offer unique advantages and limitations. Analytical ultracentrifugation (AUC) is an established workflow but suffers from low throughput, complicated data interpretation, and indirect measurement of identity. Mass photometry (MP) is an emerging technique but lacks the resolving power to distinguish partially filled AAVs in many cases and exhibits reduced precision in mass assignment. Size-exclusion chromatography with multi-angle light scattering (SEC-MALS) offers valuable quantitative insights into AAV molecular weight, empty/full ratios, and aggregation. However, its ability to distinguish closely related capsid subpopulations can be limited due to co-elution effects.
This study demonstrates that Xevo CDMS leverages the speed and sensitivity of conventional mass spectrometry with the ability to directly measure the masses of empty, partially filled, full, and overfull AAV particles in manufactured formulations. Xevo CDMS enables clear differentiation and relative quantification of empty and full capsids through peak area ratios derived from their average masses, streamlining analysis without the need for isotopic resolution or complex post-processing.
Experimental
Sample Description and Preparation
AAV empty and full (with CMV promoter-driven expression of GFP) capsid samples of various serotypes (AAV1, AAV2, AAV5, AAV6, AAV8 and AAV9) were purchased from third party commercial vendors. The viral titer of the capsids ranged from 1 × 10¹² to 1 × 10¹³ vg/mL, as determined by qPCR or ELISA assays provided by the supplier. The samples were buffer exchanged into 200 mM aqueous ammonium acetate solution with 0.001 % Pluronic F-68 (Gibco) using Bio-Spin® P-6 size-exclusion columns (Bio-Rad Laboratories).
Data Acquisition, Processing and Visualization
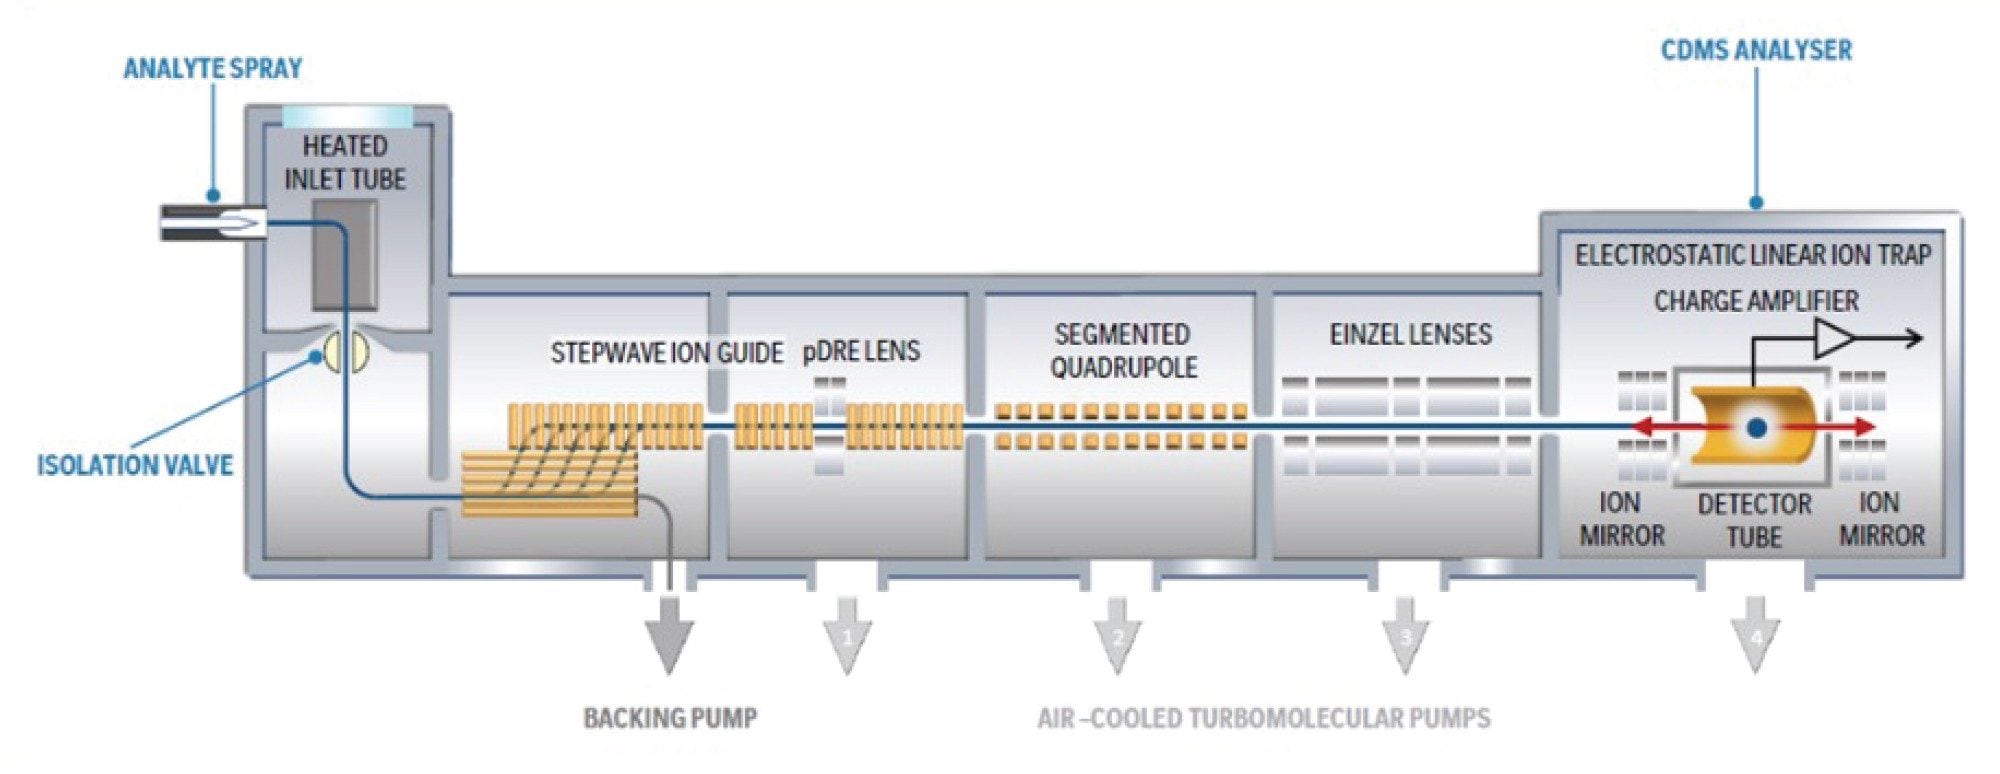
Ions were generated in positive ion mode using nano-electrospray ionization (nESI) and mass analysis was performed using the ELIT-based Xevo CDMS Instrument (Figure 1).5 Signal processing and data visualization was performed using software developed in-house. Ions were trapped for 100 ms, and total acquisitions times were between 10 and 15 minutes. Detected time-domain signals were Fourier transformed; the measured frequency and the magnitude correspond to an individual ion’s m/z and z respectively, enabling direct calculation of mass values. Data were binned to produce m/z, charge, and mass histograms, along with two-dimensional heat maps for enhanced visualization.
The Xevo CDMS Instrument was controlled by waters_connect™ Informatics Software; data processing was done using waters_connect CDMS Toolkit.
Results and Discussion
AAV capsids consist of 60 copies of three viral proteins: VP1, VP2, and VP3. These proteins self-assemble in a range of stoichiometries (nominally 1:1:10 respectively) with an average mass of around 3.7 MDa. The average mass of a full capsid (empty capsid plus genome) is typically in the 4-6 MDa range, depending on the gene of interest (GOI). Characterizing AAVs and their serotypes requires a platform that will confidently characterize and relatively quantify the AAV capsids subpopulations which is fundamental for the products safety and efficacy.
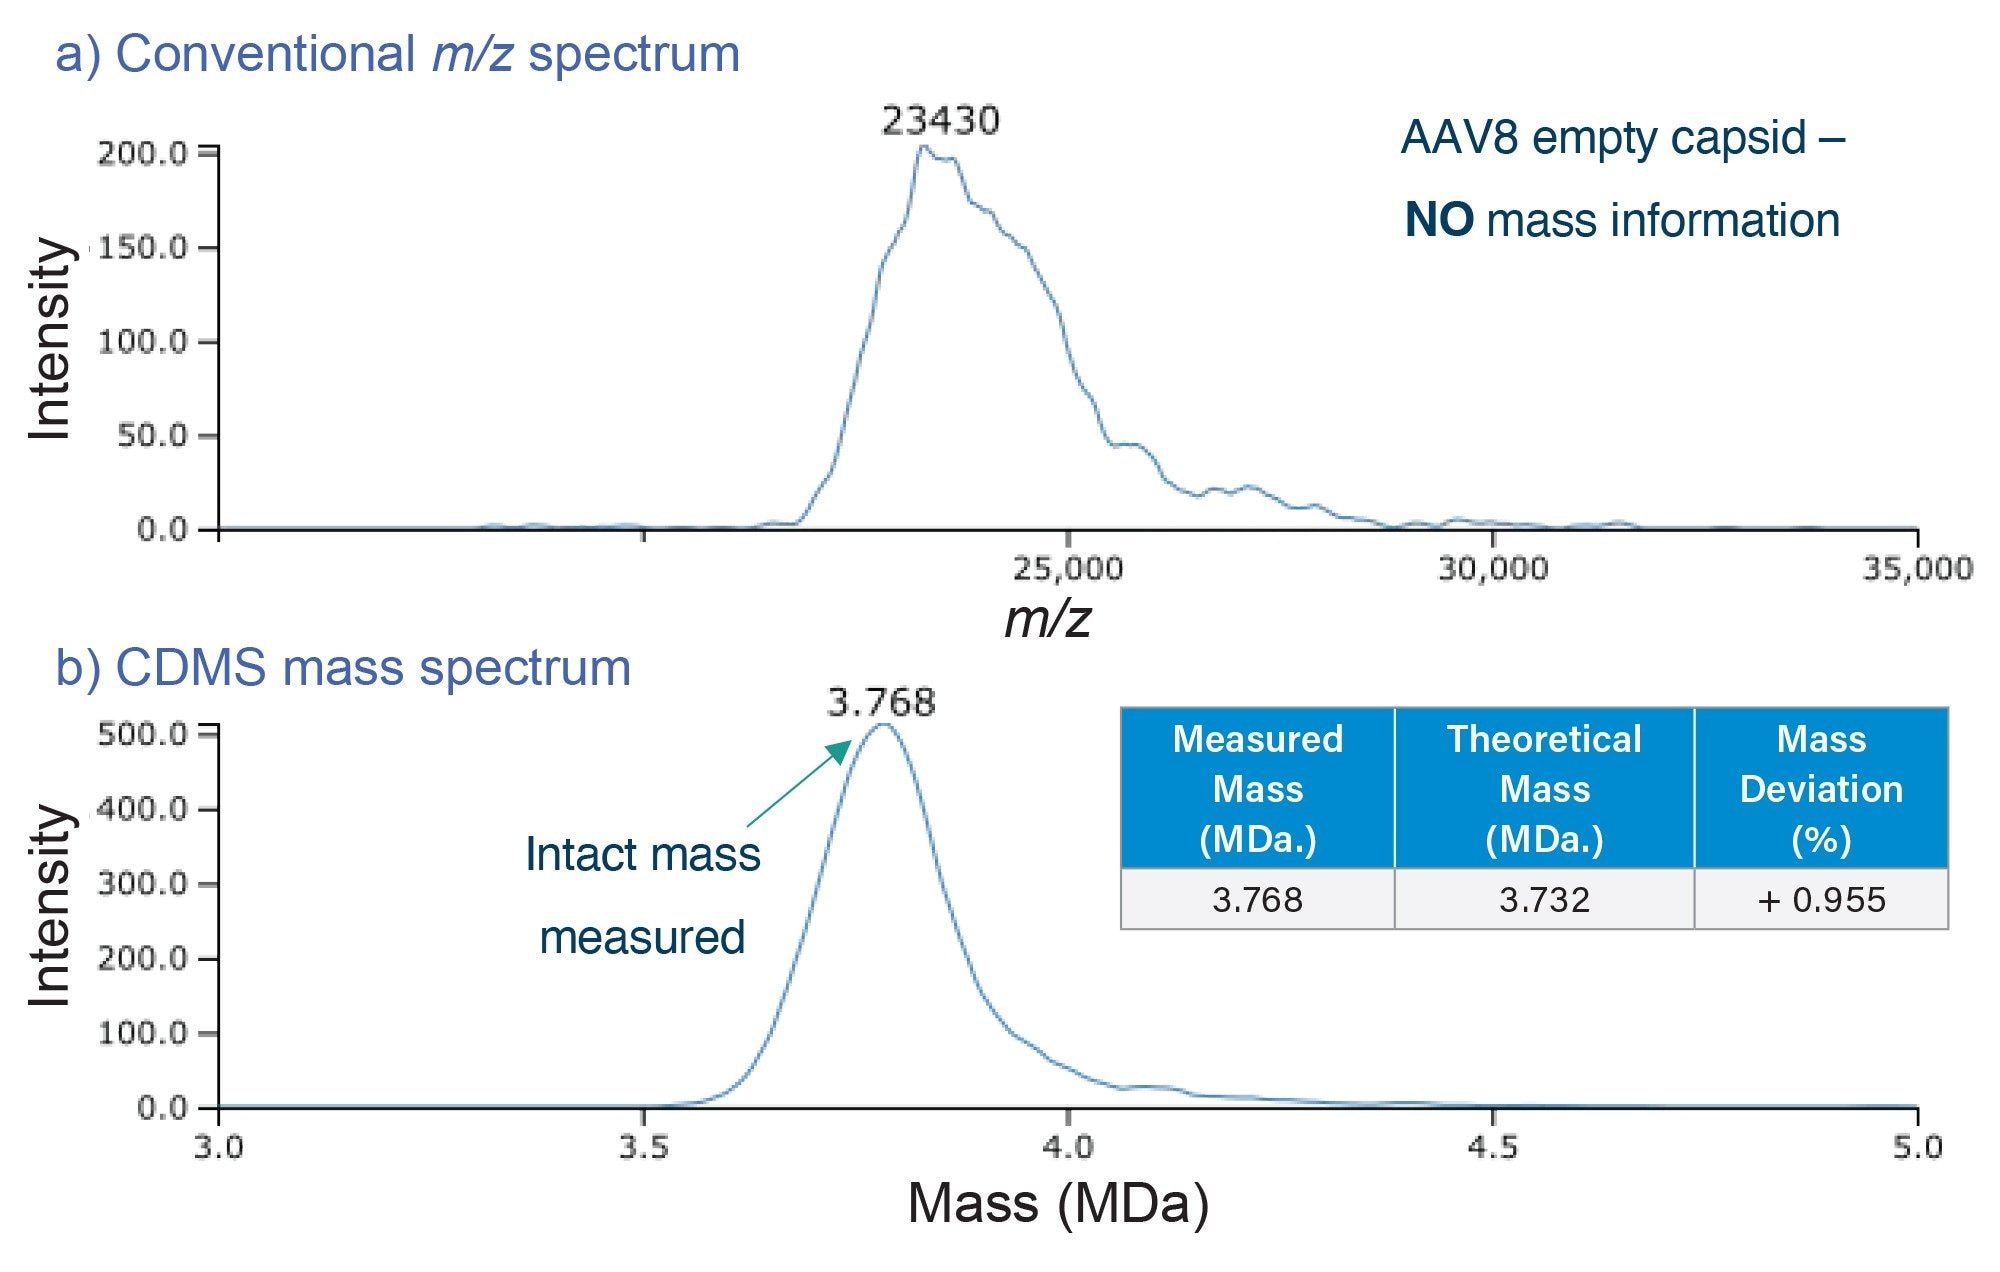
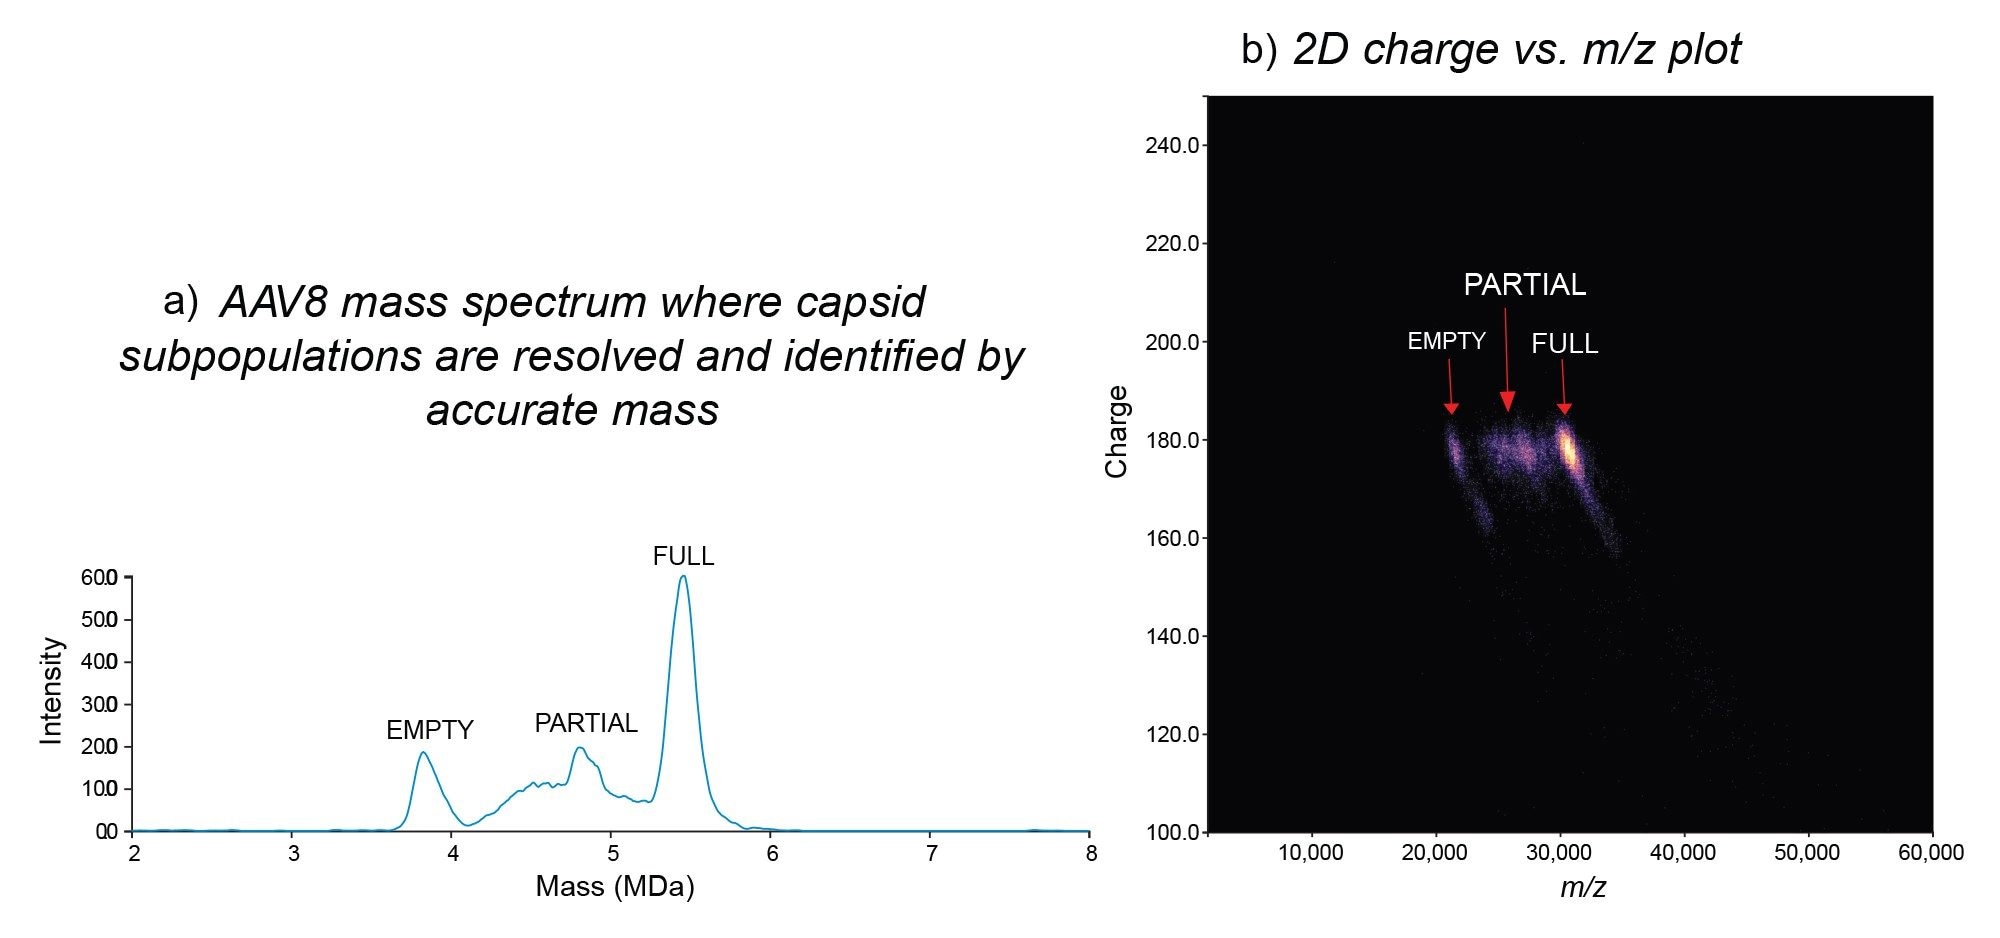
On a conventional mass spectrometer, a m/z spectrum would be obtained such as that in Figure 2a, where it would be difficult to observe resolved charge states for AAVs due to the heterogeneity of the capsids. This in turn would make it impossible to apply deconvolution algorithms to deduce the charge and obtain the mass information. By comparison, Xevo CDMS can directly measure the mass (Figure 2b) for each of the capsid species via the observed m/z and z collected for each ion. Figure 3 demonstrates the ability of Xevo CDMS to characterize an AAV8-CMV-GFP full capsid sample. While the full capsid species is most intense, the empty and partially filled capsid species are also observed. Except for accurate mass information, Xevo CDMS also generates m/z vs z density plots (Figure 3b), which can provide additional information on the charge heterogeneity of the capsids and therefore provide some insights into their structure. The density plot demonstrates a similar number of charges observed for capsids that are empty, partially filled, and full as only the surface of the capsids is charged during the electrospray process. Therefore, shifts in the charge profile may provide some insights into the structural integrity of the capsids.
CDMS data were also obtained for the empty and full capsid samples across various AAV serotypes as shown in Figure 5. The measured average masses were in good agreement with the expected masses of the empty (3.73 MDa) and full (5.08 MDa) with a measured mass excess of < 1.1 % for both empty and full capsids of all AAV serotypes analyzed. AAV capsids1, with only slight variations in mass measurements for each serotype, are shown by the dotted red line of Figure 4. Some low molecular weight species with distinct ion populations (< 1 MDa) were observed for all the empty AAV capsids, except for AAV5. These product-related impurities, below 20,000 m/z, possibly include capsid protein oligomers, degraded capsid fragments, or free or aggregated viral proteins generated during vector product storage.
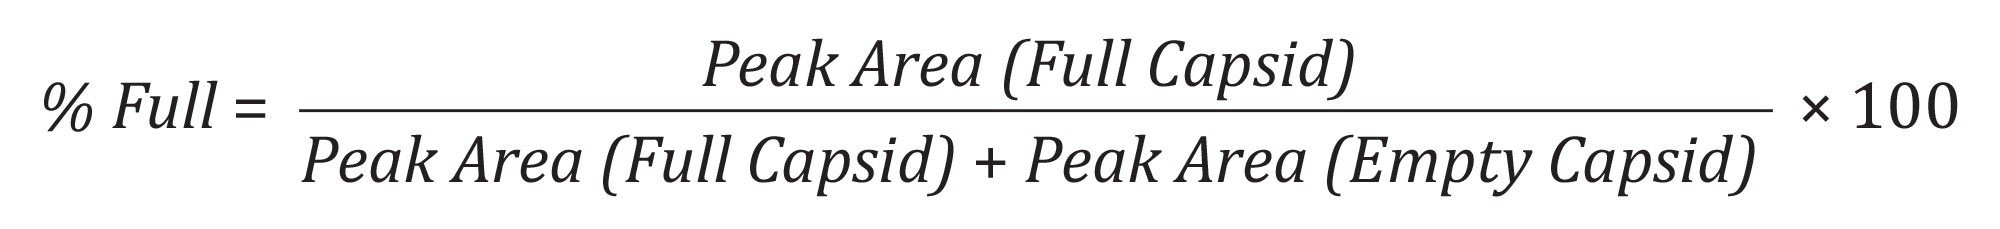
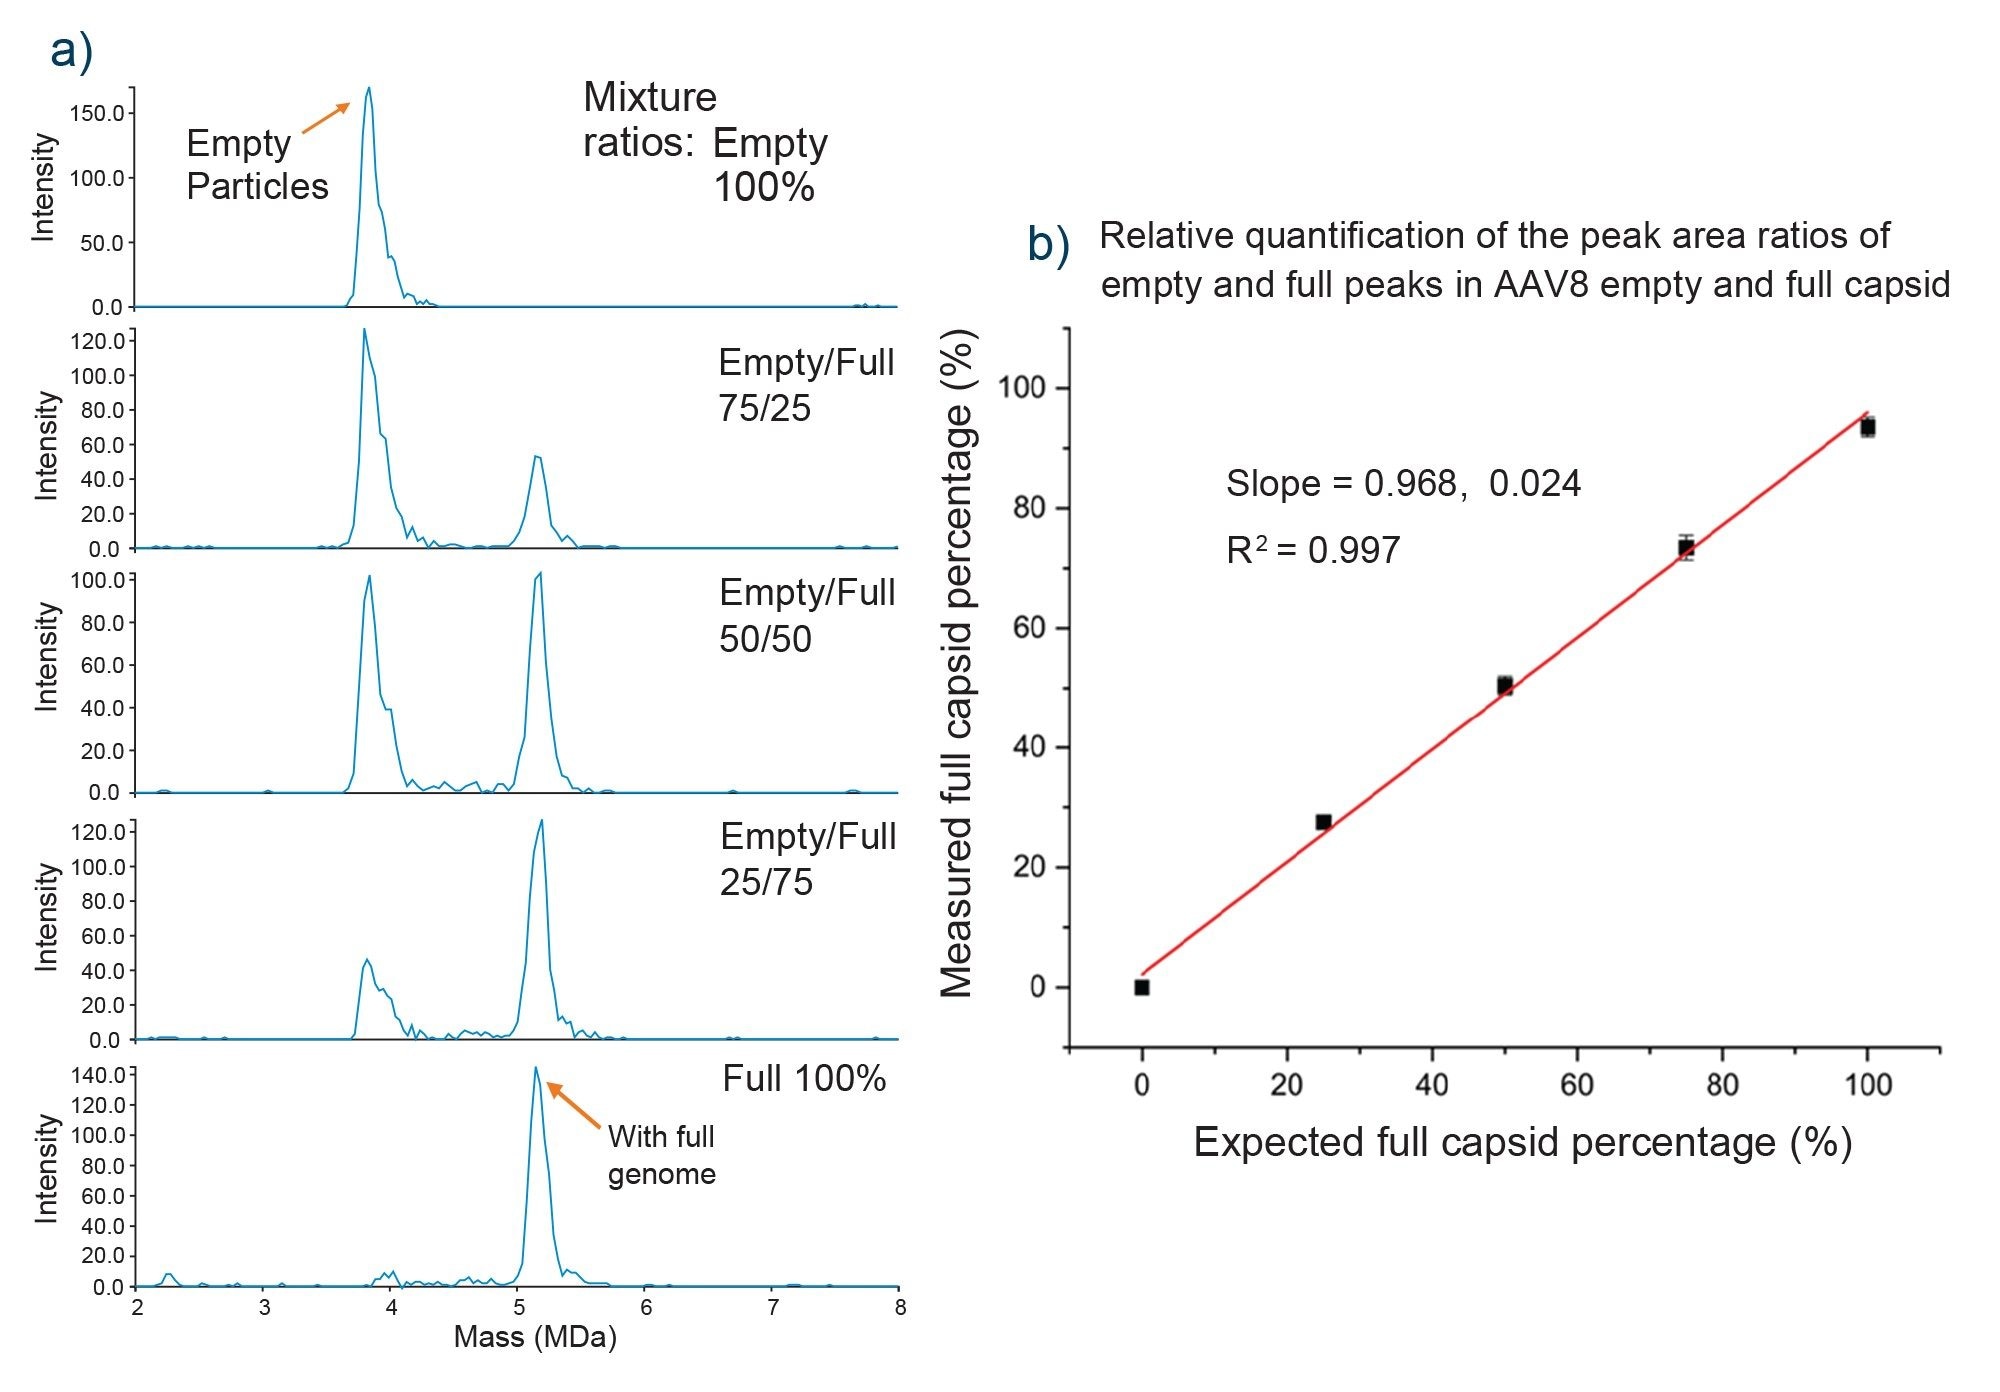
Relative quantification of empty and full AAV8 capsids was investigated by preparing volumetric mixtures ranging from 100% empty to 100% full, in increments of 25%, as shown in Figure 6. CDMS data for each mixture were acquired in triplicate (1000-1500 ions) in the AAV mass range with a 10-minute acquisition time. The data were then plotted as mass peak area vs. % full capsids and a linear response and correlation were observed (R2> 0.99) as shown by Figure 6, highlighting the utility of CDMS for this type of work. The percentages of empty and full capsids can be calculated using Equation 1, or from using the ion population under each peak, which should give the same information as using peak areas. This information is useful for samples where mass distributions aren't as gaussian.
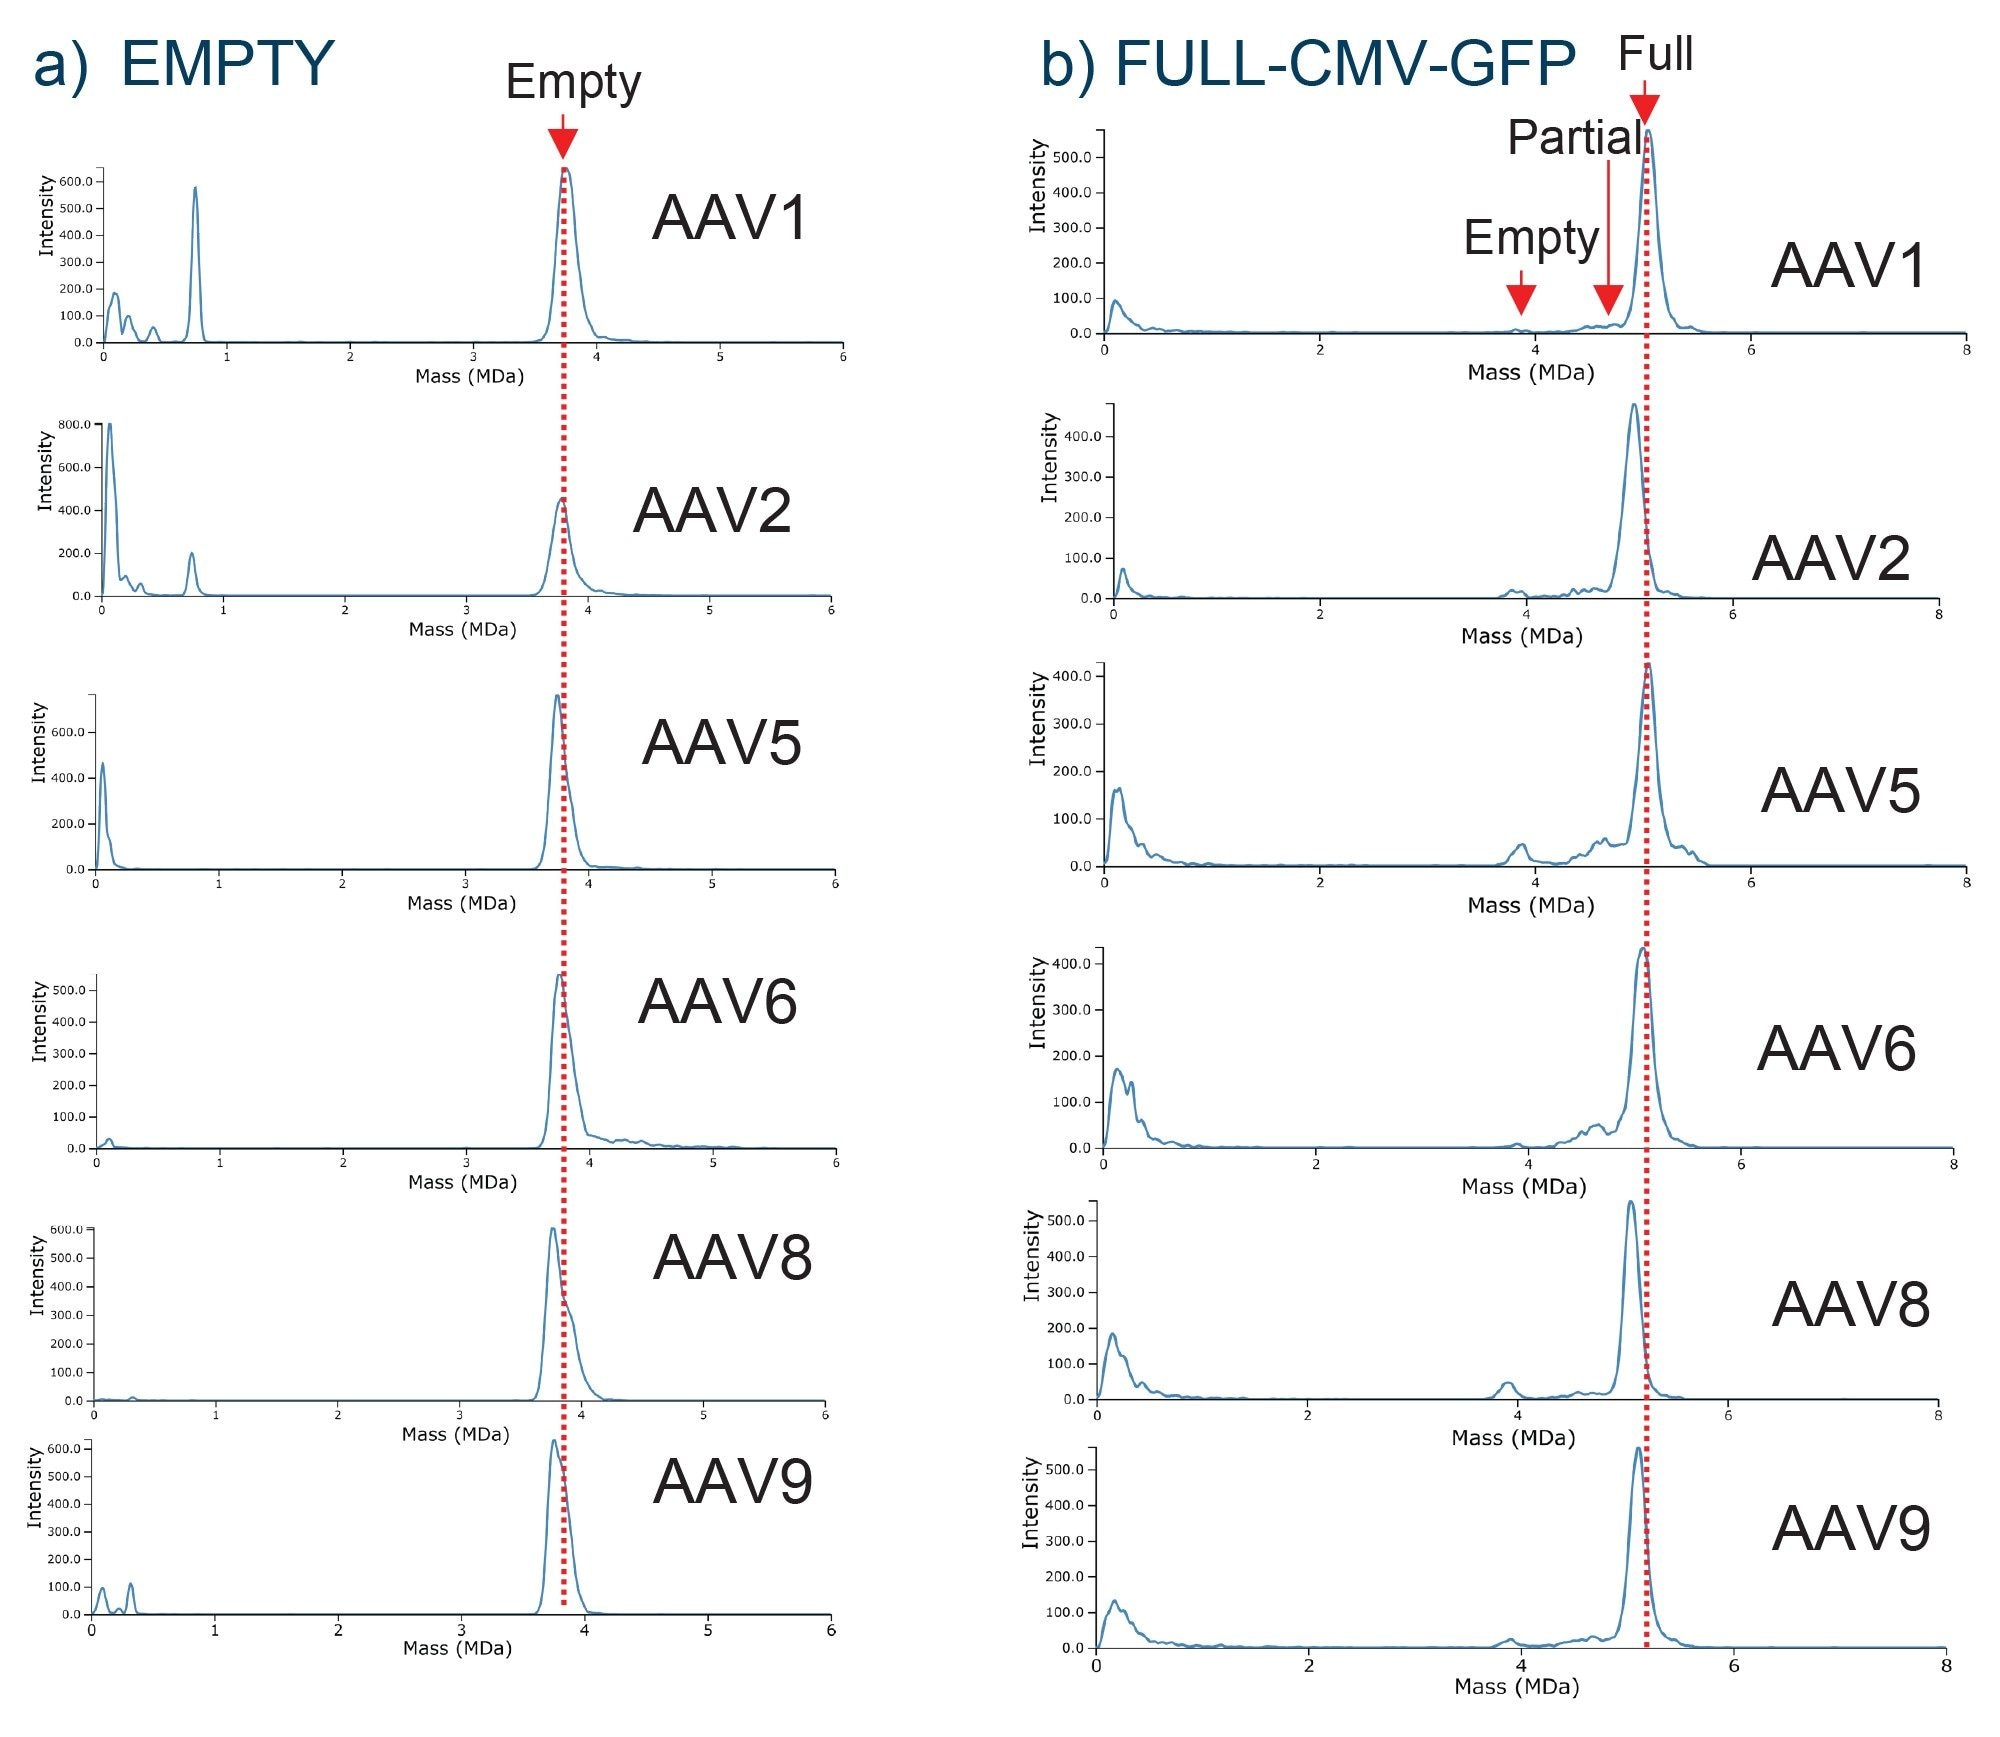
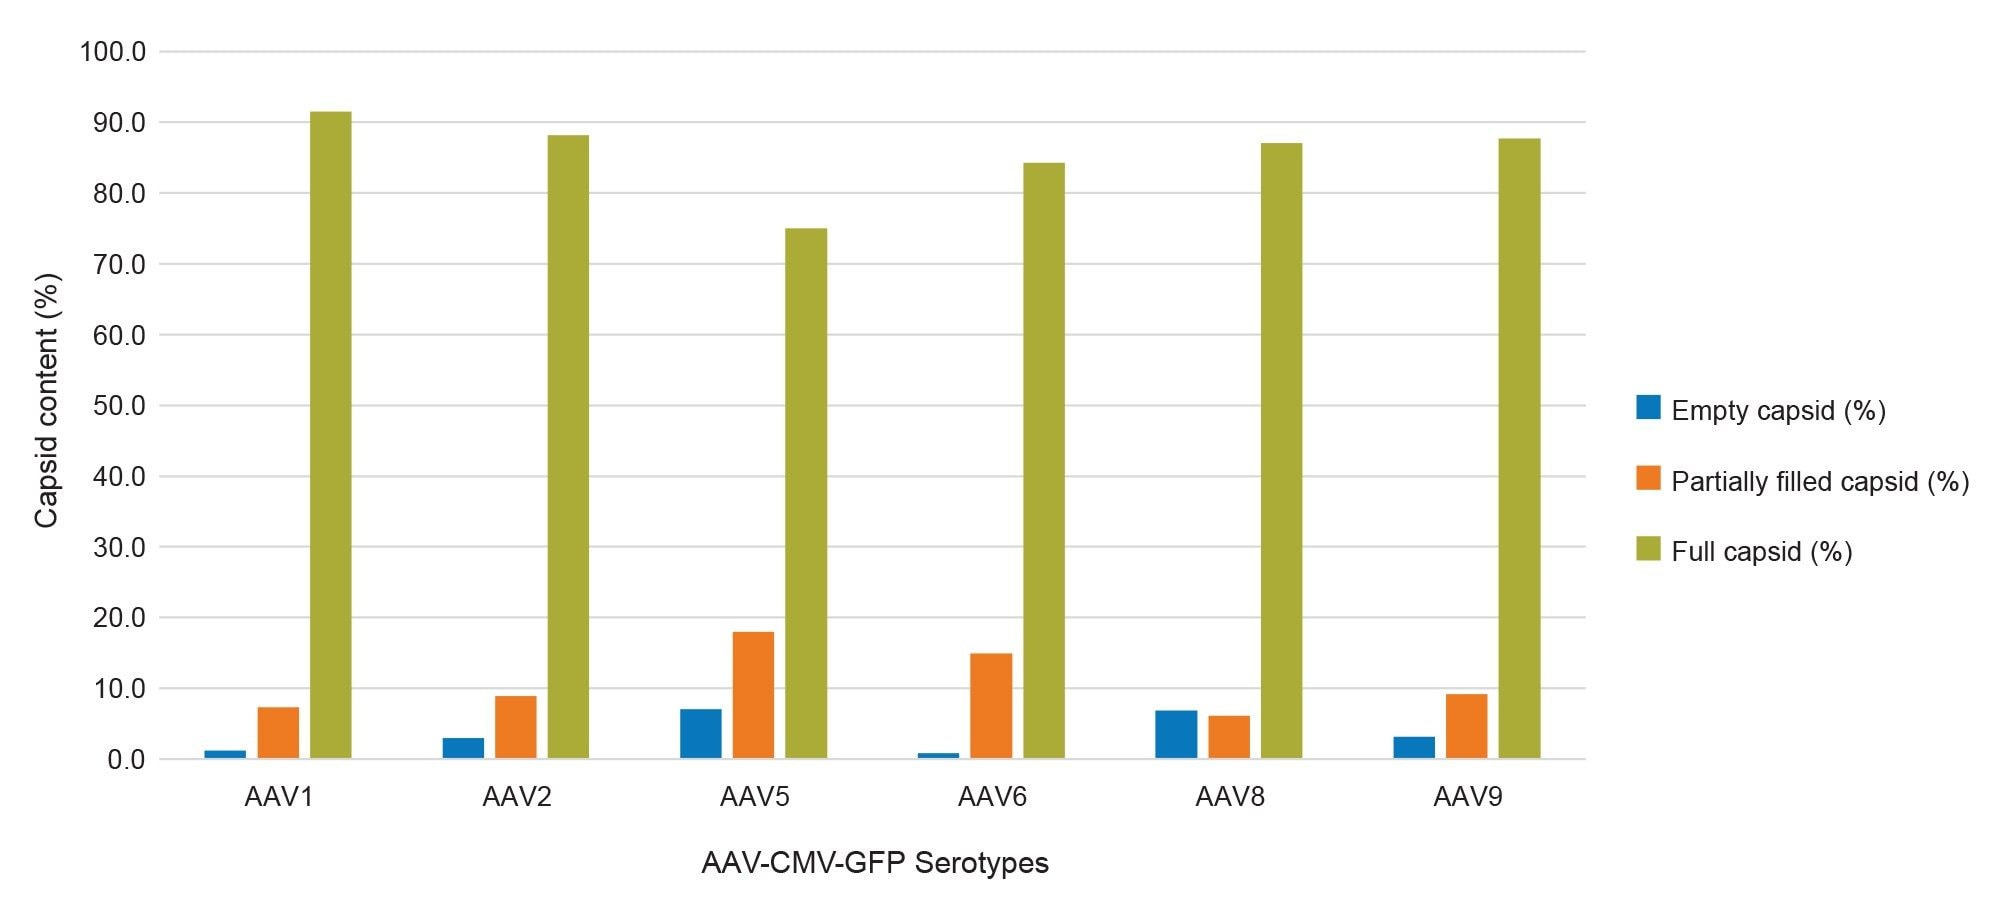
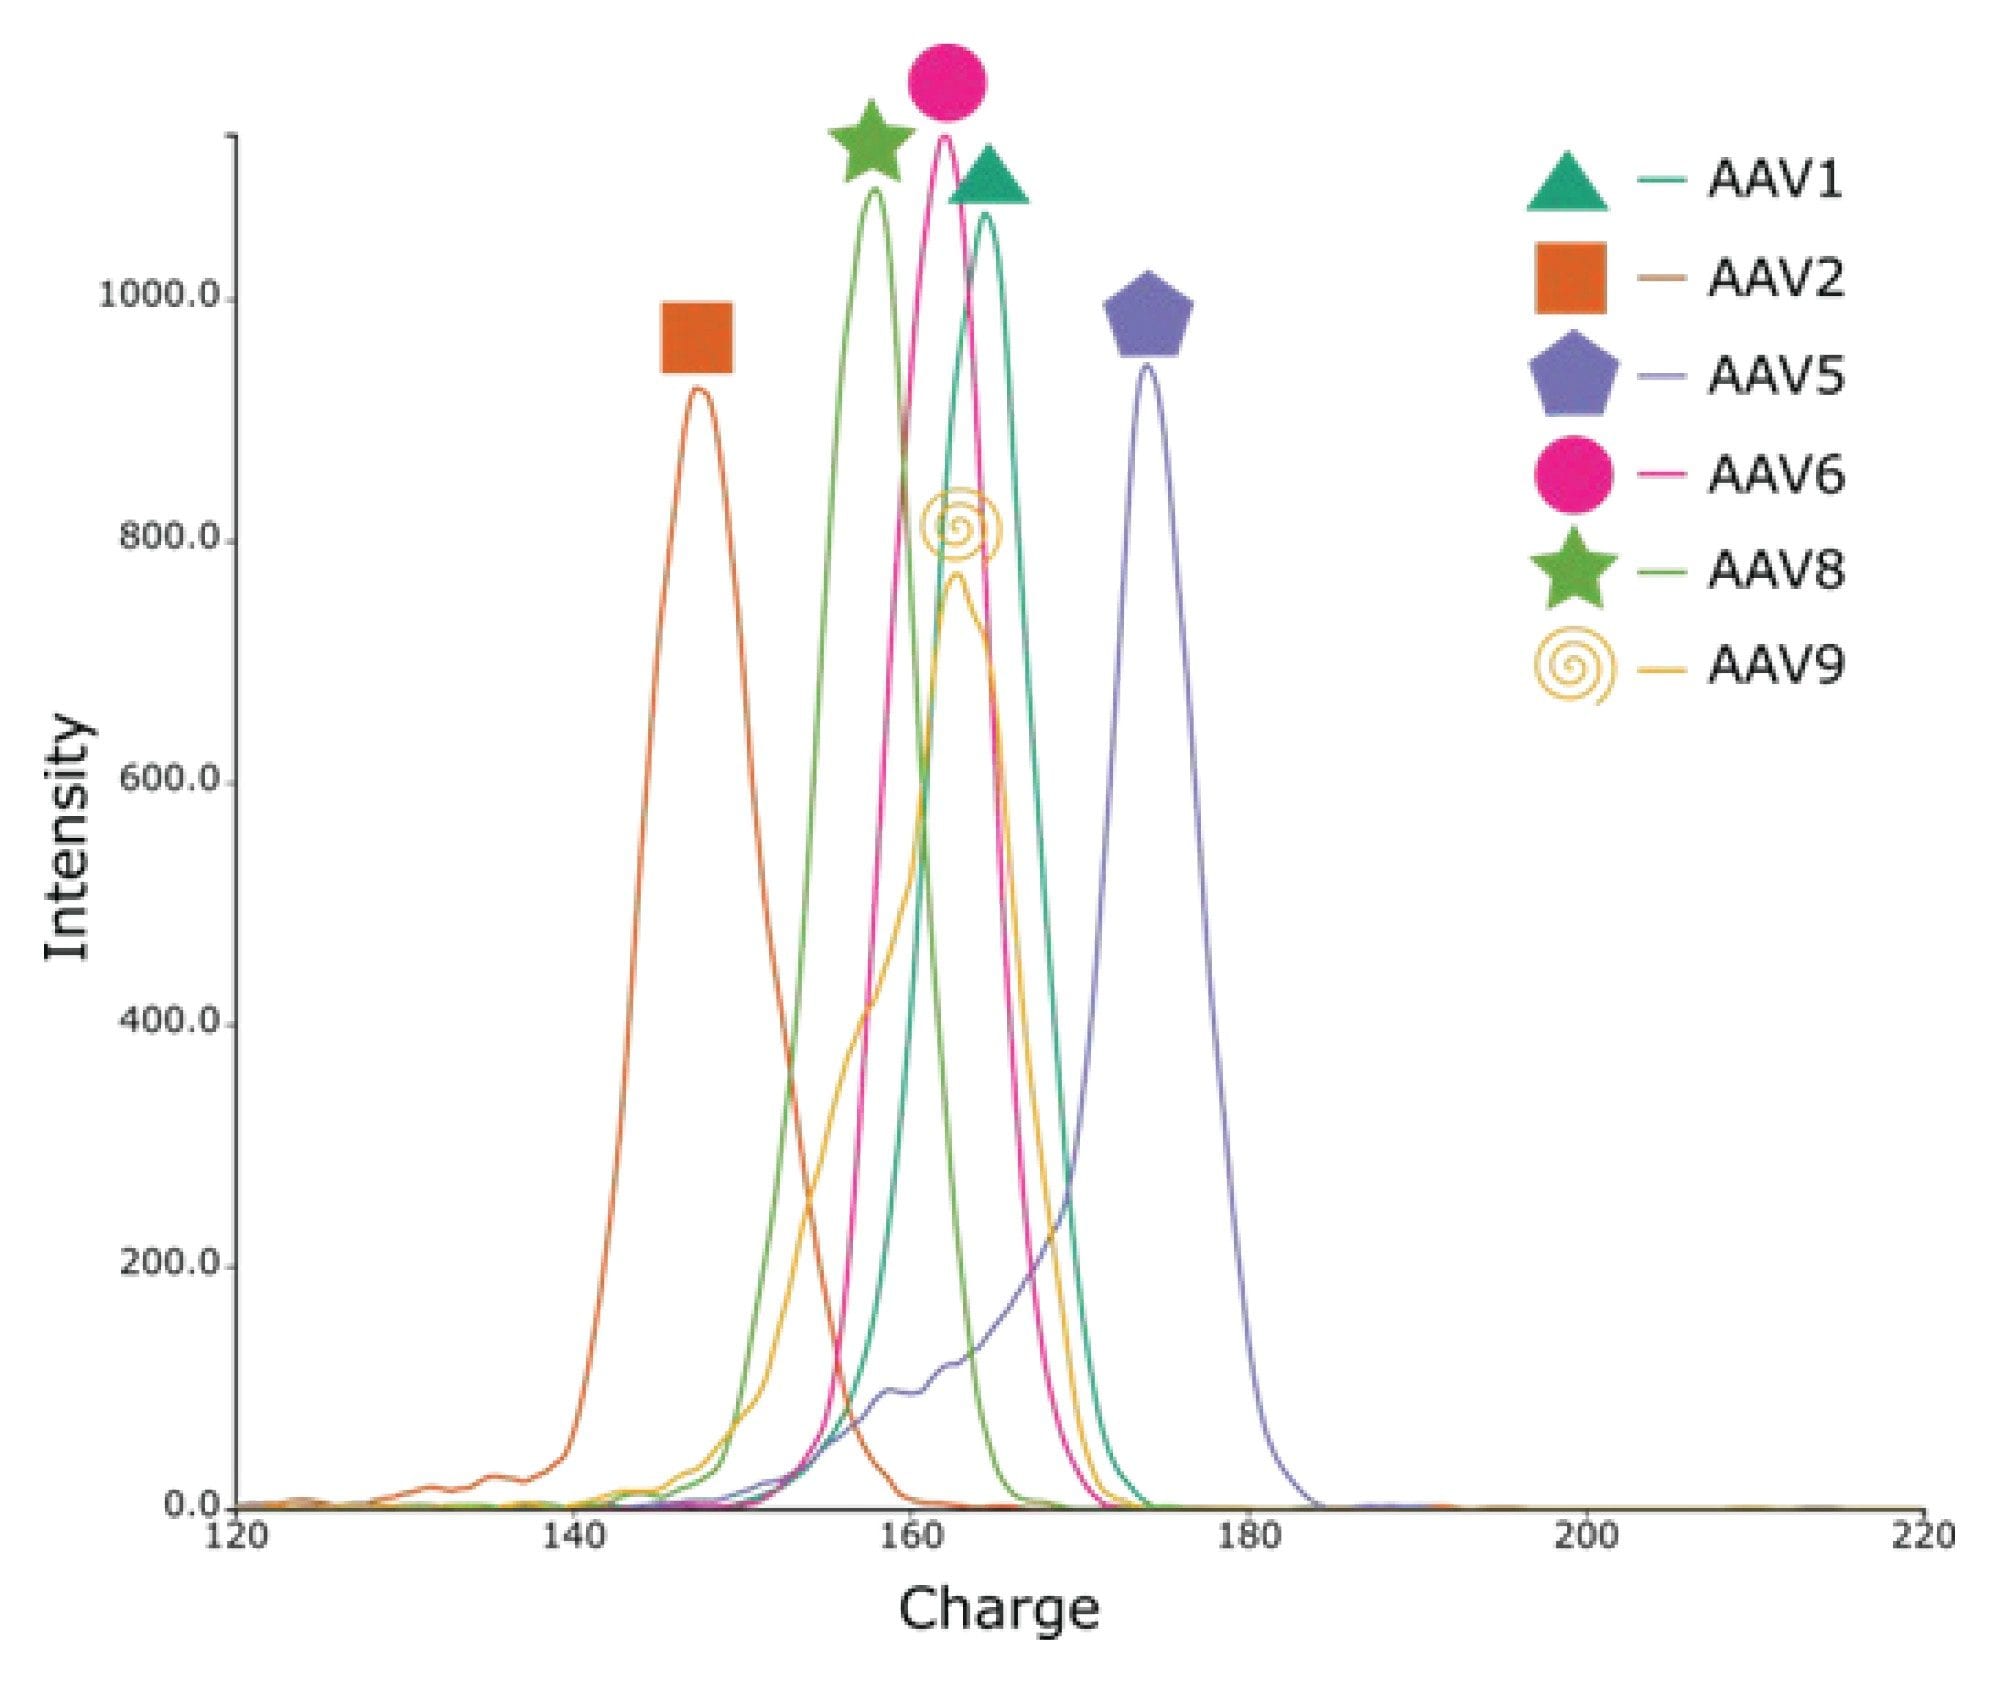
For the full AAV samples, empty particles were detected in AAV1, 2, 5, 8, and 9 with partial/intermediate particles detected in AAV1, 5, 6, and 9 as shown in Figure 5. Over 10% of empty particles were detected in the AAV5 and AAV8 samples. Interestingly, the lot for the AAV5 and AAV8 was produced in 2016 compared to 2019, and later for the remaining AAV serotypes. This indicates that storage conditions of AAVs can have a significant impact on their stability and ultimately affect the potency of the product, as a higher percentage of empty capsids were detected in the AAV samples with the oldest manufacturing date. For the AAV serotype panel analysis, approximately 70-87% full particles were detected across the different serotypes, with varying abundances of empty particles and intermediate/partially filled capsids, as shown in Figure 5. Additionally, the CDMS data showed that each serotype charges differently when submitted to nESI, possibly due to the differences in viral protein content within the capsid structure (Figure 7).
Conclusion
Accurate characterization and relative quantitation of AAV capsids (full, partial, empty) is essential to ensuring product safety and efficacy. The Xevo CDMS Instrument has emerged as an advanced technology for AAV analysis, providing direct mass measurements that enable precise relative quantitation of large and complex biotherapeutic agents—overcoming the limitations of conventional charge-based mass spectrometry. By measuring individual ions without requiring spectral deconvolution, Xevo CDMS achieves precise discrimination of capsid populations even within highly heterogeneous samples. This study demonstrates the capability of the Xevo CDMS platform to readily distinguish between empty, full, and partially filled/intermediate capsids across six AAV serotypes, assess their storage stability, and characterize CQAs, such as the detection of low molecular-weight impurities that may impact therapeutic performance. The consistent quantitation of full and empty capsids across serotypes further validates the reproducibility and robustness of CDMS. Additionally, its minimal sample preparation and broad serotype applicability position Xevo CDMS as a transformative tool for real-time monitoring and control of key quality parameters throughout the AAV manufacturing process—ultimately supporting enhanced product consistency, regulatory confidence, and therapeutic success.
References
- Zoratto, S.; Weiss, V. U.; van der Horst, J.; Commandeur, J.; Buengener, C.; Foettinger‐Vacha, A.; Pletzenauer, R.; Graninger, M.; Allmaier, G. Molecular Weight Determination of Adeno‐Associate Virus Serotype 8 Virus‐like Particle Either Carrying or Lacking Genome via Native NES Gas‐Phase Electrophoretic Molecular Mobility Analysis and NESI QRTOF Mass Spectrometry. Journal of Mass Spectrometry 2021, 56 (11), e4786. https://doi.org/10.1002/jms.4686.
- Kaddis, C. S.; Lomeli, S. H.; Yin, S.; Berhane, B.; Apostol, M. I.; Kickhoefer, V. A.; Rome, L. H.; Loo, J. A. Sizing Large Proteins and Protein Complexes by Electrospray Ionization Mass Spectrometry and Ion Mobility. Journal of the American Society for Mass Spectrometry 2007, 18 (7), 1206–1216. https://doi.org/10.1016/j.jasms.2007.02.015.
- Destro, F.; Wu, W.; Srinivasan, P.; Joseph, J.; Bal, V.; Neufeld, C.; Wolfrum, J. M.; Manalis, S. R.; Sinskey, A. J.; Springs, S. L.; Barone, P. W.; Braatz, R. D. The State of Technological Advancement to Address Challenges in the Manufacture of RAAV Gene Therapies. Biotechnology Advances 2024, 76, 108433–108433. https://doi.org/10.1016/j.biotechadv.2024.108433.
- Sripada, S. A.; Hosseini, M.; Ramesh, S.; Wang, J.; Ritola, K.; Stefano Menegatti; Daniele, M. A. Advances and Opportunities in Process Analytical Technologies for Viral Vector Manufacturing. Biotechnology Advances 2024, 74, 108391–108391. https://doi.org/10.1016/j.biotechadv.2024.108391.
- Todd, A. R.; Barnes, L. F.; Young, K.; Zlotnick, A.; Jarrold, M. F. Higher Resolution Charge Detection Mass Spectrometry. Analytical Chemistry 2020, 92 (16), 11357–11364. https://doi.org/10.1021/acs.analchem.0c02133.
Featured Products
720009059, October 2025