Application Brief
This is an Application Brief and does not contain a detailed Experimental section.
Robert Plumb, Nikunj Tanna
Waters Corporation, United States
Published on November 10, 2025
This is an Application Brief and does not contain a detailed Experimental section.
Multiple reaction monitoring (MRM) based LC-MS/MS is the primary platform for high sensitivity quantification of drugs, metabolites and biomarkers in support of pharmaceutical R&D. The development of MRM methods can be a time-consuming and complex process, entailing selection of the optimal precursor m/z → product ion pairs and associated CE values. The MS Optimization tool in the waters_connect™ for Quantitation Software automates and streamlines the process of MRM method development. The results are displayed in an interactive graphical interface with selected transition values being directly transferred to the LC-MS method mitigating transcription errors.
MRM mass spectrometry (MS) is the platform of choice for LC-MS/MS based quantification of drugs and metabolites in biofluids due to its sensitivity, specificity, and reproducibility. The development of these MRM methods requires the careful evaluation of source polarity, voltages, temperatures, precursor ion, product ion, cone voltages, and collision energies. This can be a time-consuming, laborious process requiring multiple combinations of conditions to be evaluated and compared before being transferred to the MS acquisition method for final evaluation with matrix extracted samples under LC-MS/MS conditions.
Here, a fully automated MRM optimization tool is described with the waters_connect for Quantitation Software to acquire and review multiple MRM signal combinations. The optimization tool uses an iterative process of precursor ion detection, cone voltage optimization, product ion generation, and detection and collision energy evaluation. The resulting data is displayed in both tabular and interactive graphical format allowing the bioanalytical scientist to review the data and select the most promising MRM transitions to evaluate for matrix interference. Transcription errors are eliminated via the direct transfer of the optimized MRM transitions to the LC-MS method tool.
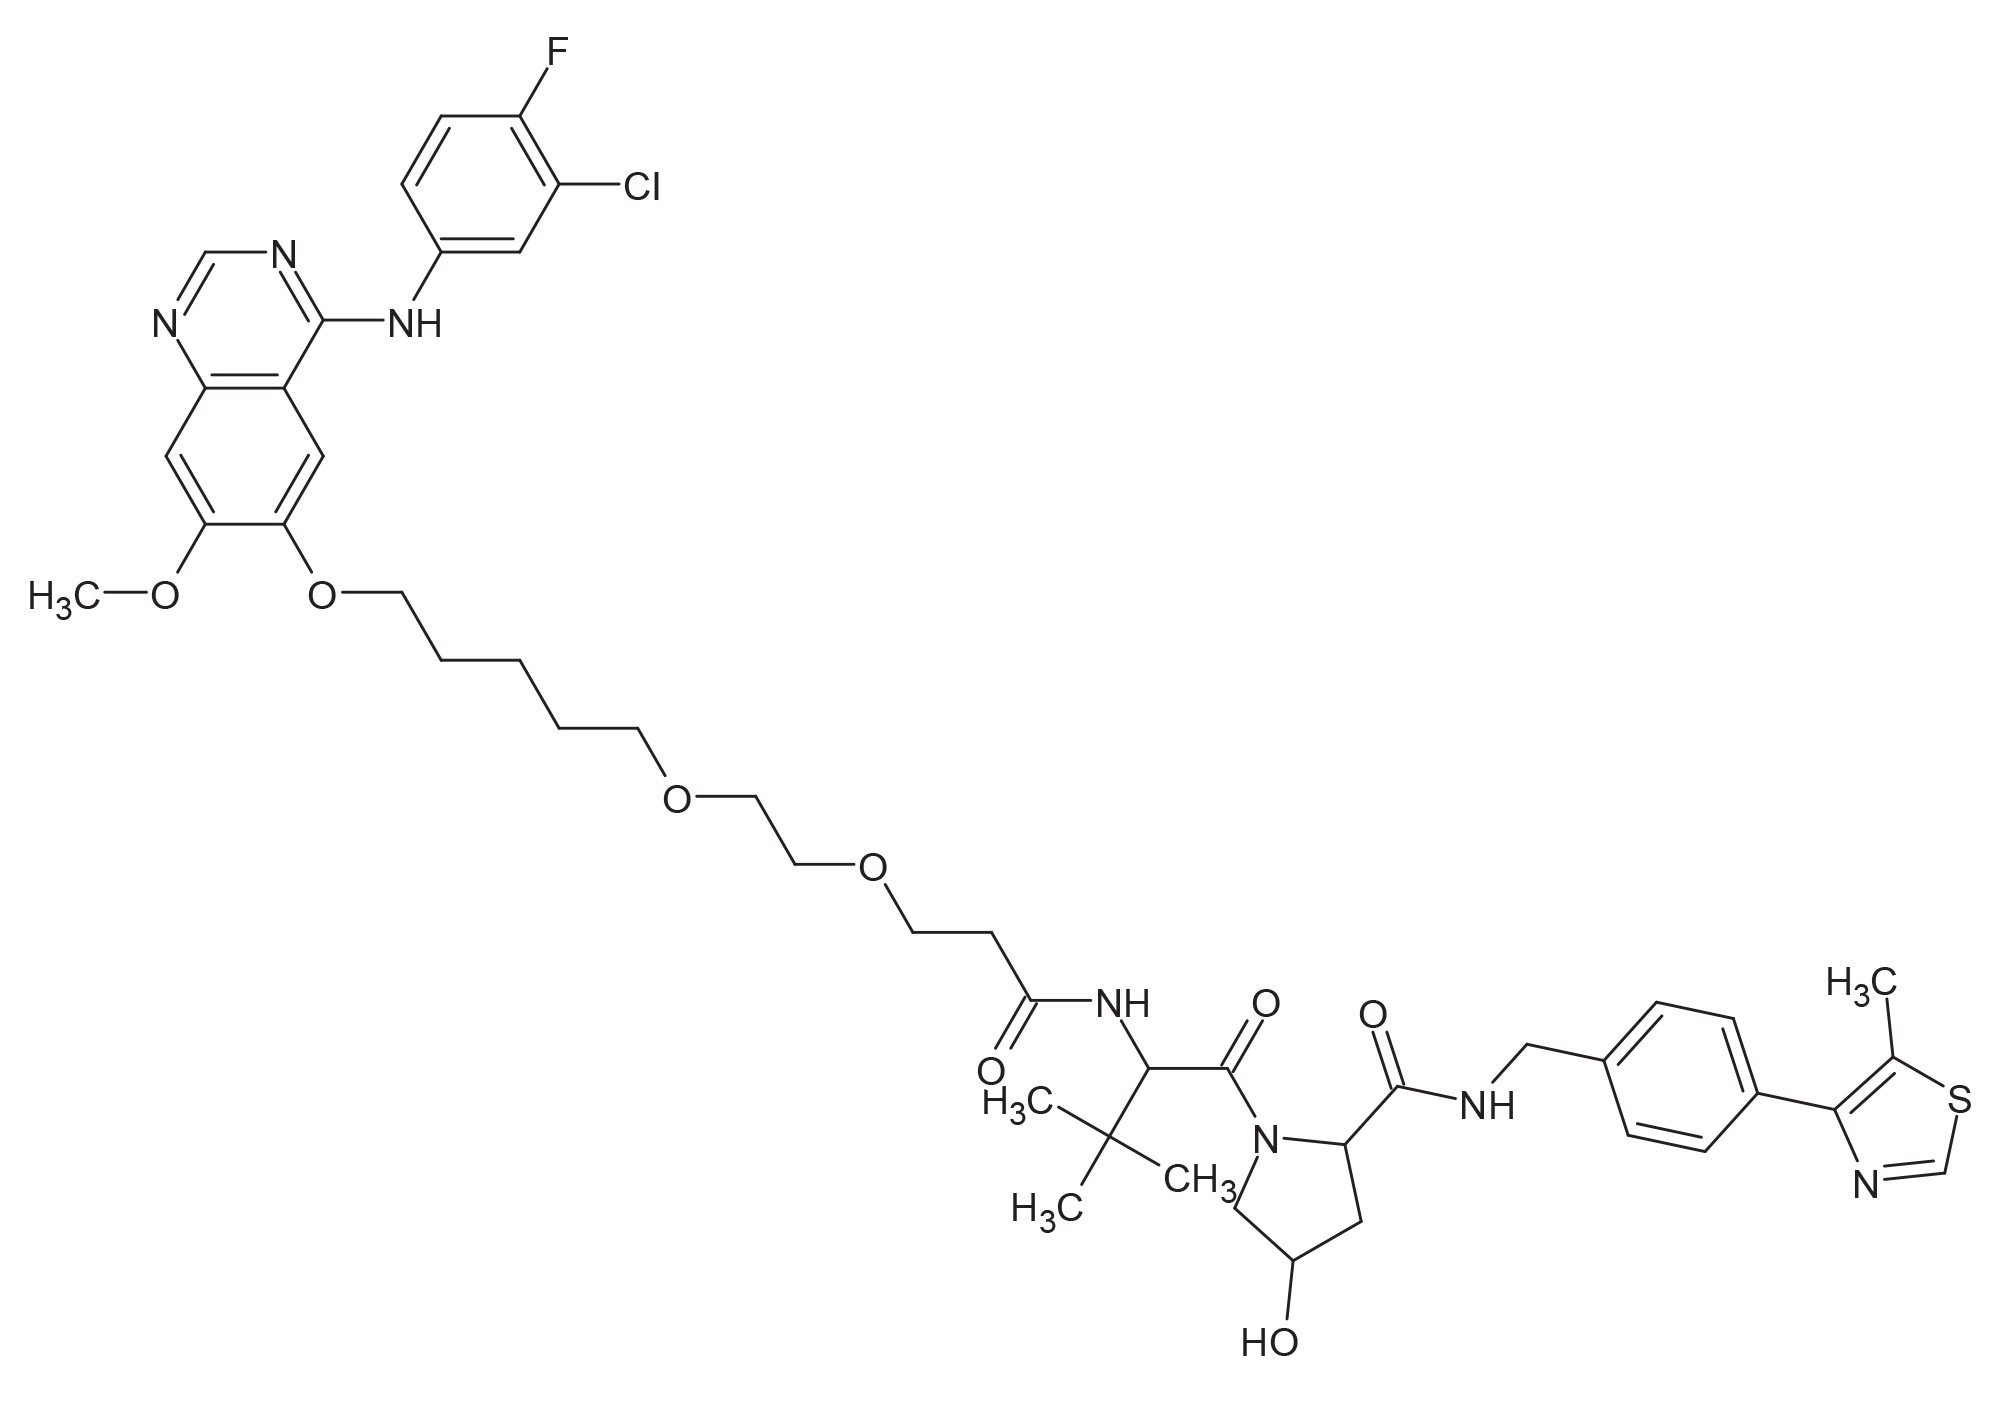
Gefitinib-based PROTAC® 3 (Figure 1) was purchased from Tocris Bioscience (Minneapolis, MN) and dissolved in methanol to yield a 1 mg/mL solution and further diluted in 50:50 methanol:0.1% aqueous acid to 100 ng/mL.
Mass spectrometry was performed on a Waters Xevo™ TQ Absolute XR Mass Spectrometer, operated in positive ion electrospray ionization mode (ESI). Nitrogen was used as the nebulizer gas and argon as the collision gas. The cone voltage, collision energy, and MS-MS transitions were adjusted and evaluated using the waters_connect Optimization tool.
The mass spectrometer was controlled and resulting data was evaluated using waters_connect for Quantitation Application Manager version 1.9.
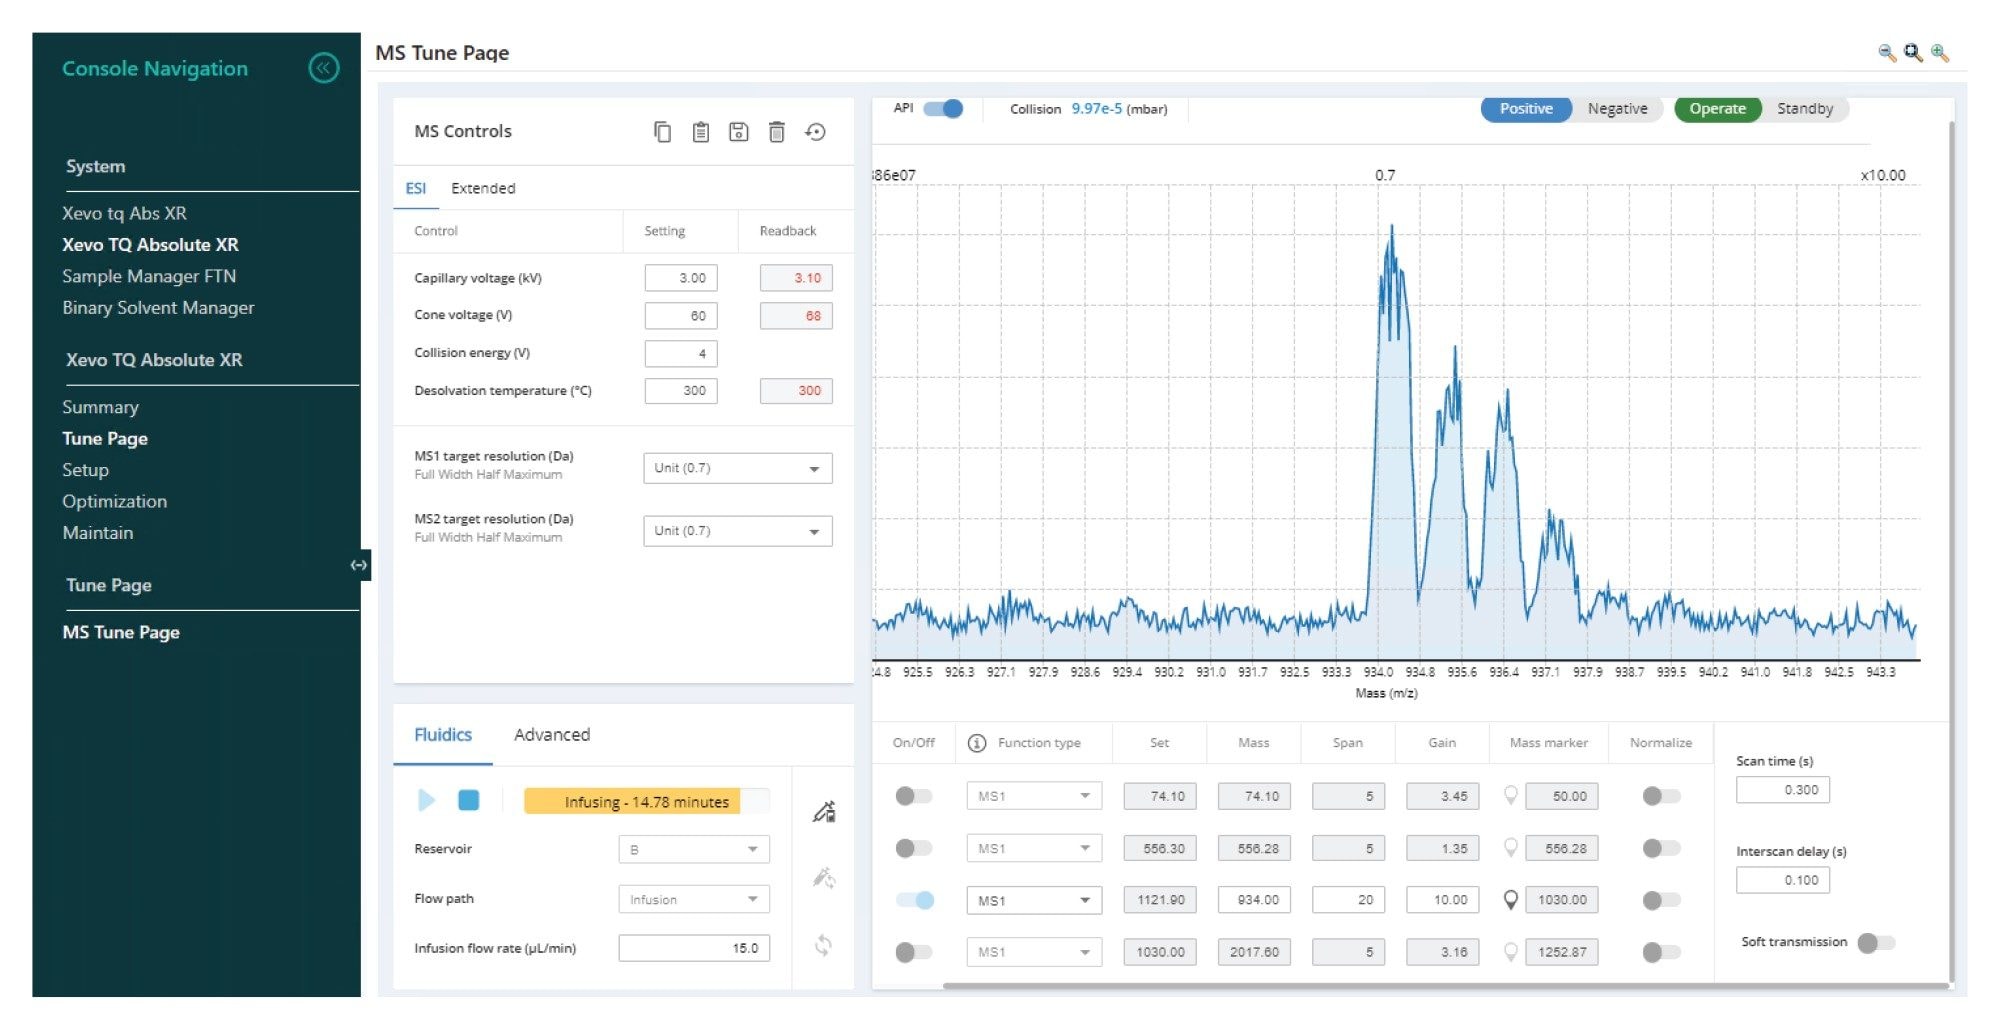
Prior to MRM condition optimization, Gefitinib-based PROTAC 3 was infused into the MS source and the source temperature, gas flows, and capillary voltage evaluated, and the best conditions selected. This was achieved by introducing the sample into the MS source, either via infusion from the on-board syringe pump fluidics or via combining the syringe pump infusion with the LC mobile phase flow. In this case, the infusion approach was used. The data in Figure 2 illustrates the signal obtained for the infusion of Gefitinib-based PROTAC 3. Three distinct ions were observed for the analyte in positive ion mode at m/z = 934.5, 935.5 and 936.4 Da consistent with the expected chlorine isotope signature. The optimal capillary voltage was determined to be 3 KV and the source temperature 400 ˚C.
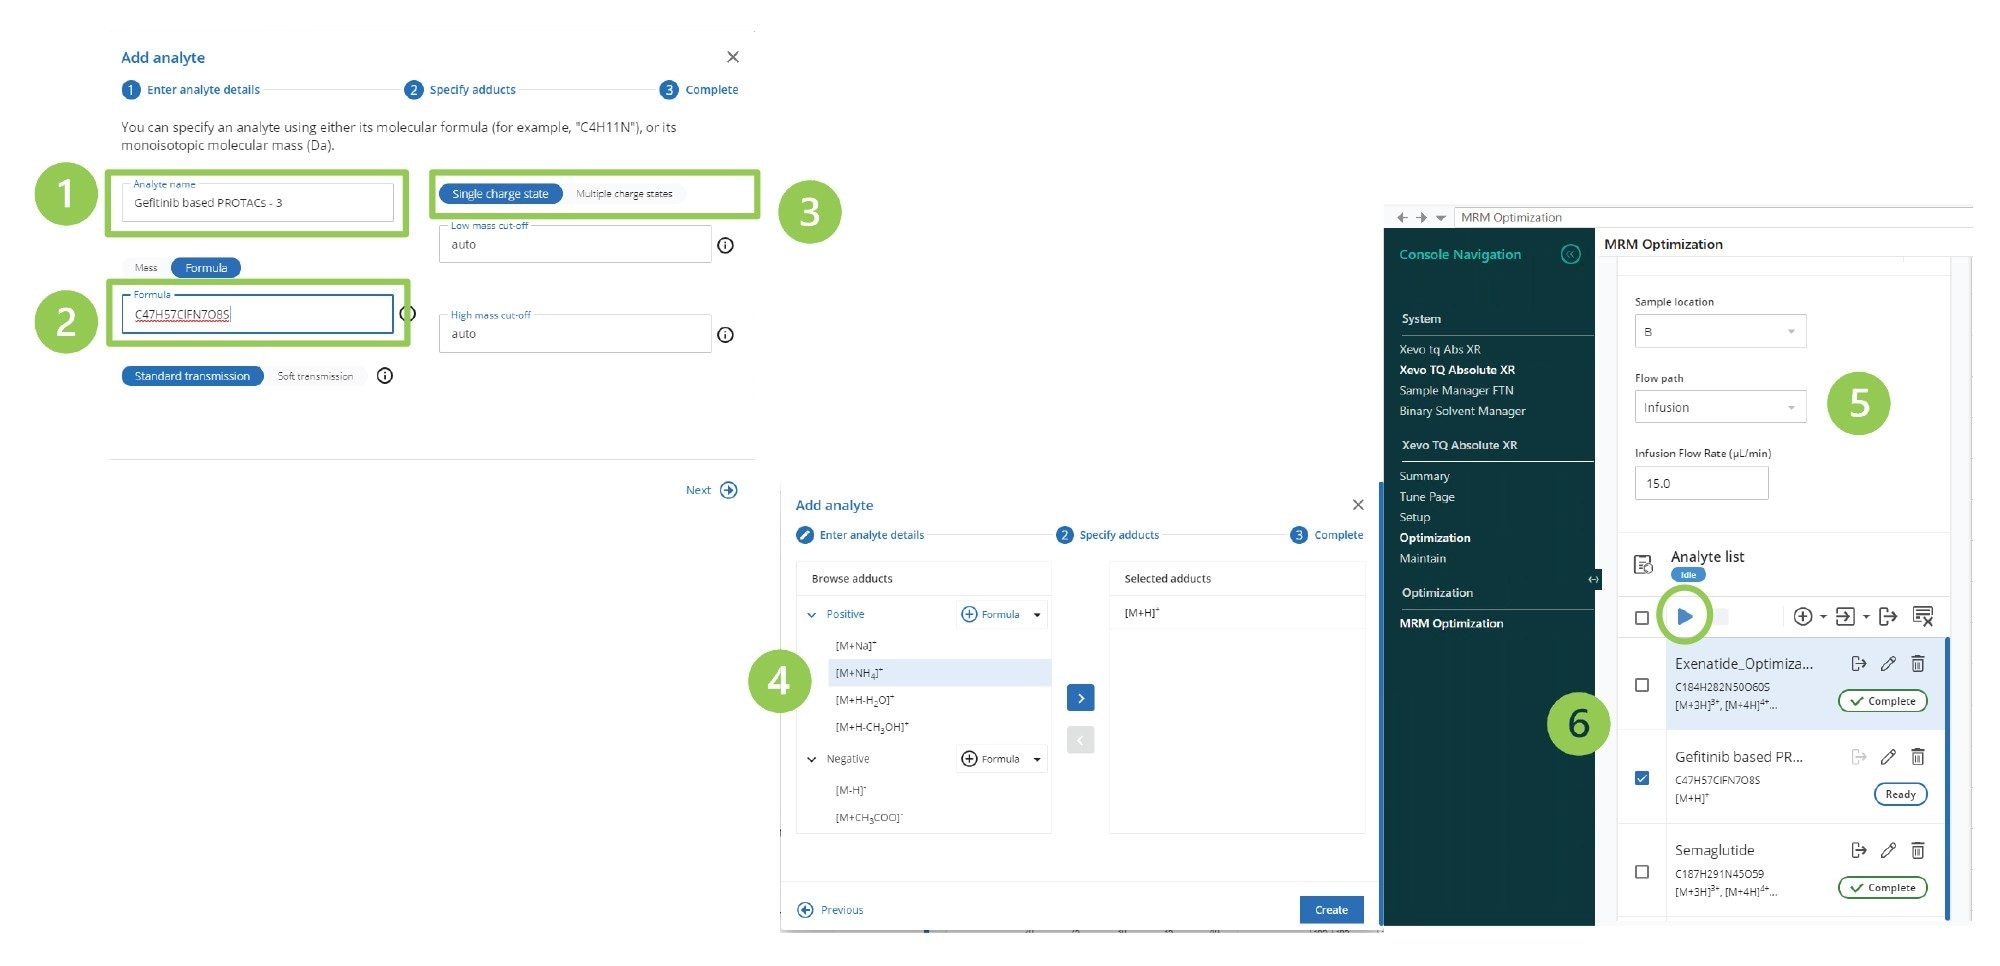
MRM optimization was performed by selecting the Optimization function from the tune page Console Navigation side panel. The first step in the process was to add a new analyte by selecting the plus (+) function in the analyte list. This created a new dialogue box in which the analyte name (1), the analyte formula, or mass (2) was input, also single or multiple charged species detection can be selected (3). In this case, the singly charged option was employed. In the next pane of the Optimization tool, the polarity to be evaluated and adducts to be considered were selected (4). Finally, the mode of sample introduction, e.g., infusion, was chosen (5), the compound(s) to be tested were selected using check box (6), and the start arrow was selected (Figure 3). The MS system then proceeded through the process of precursor ion selection, cone voltage optimization, product ion screening, and collision energy optimization for each precursor–product ion combination.
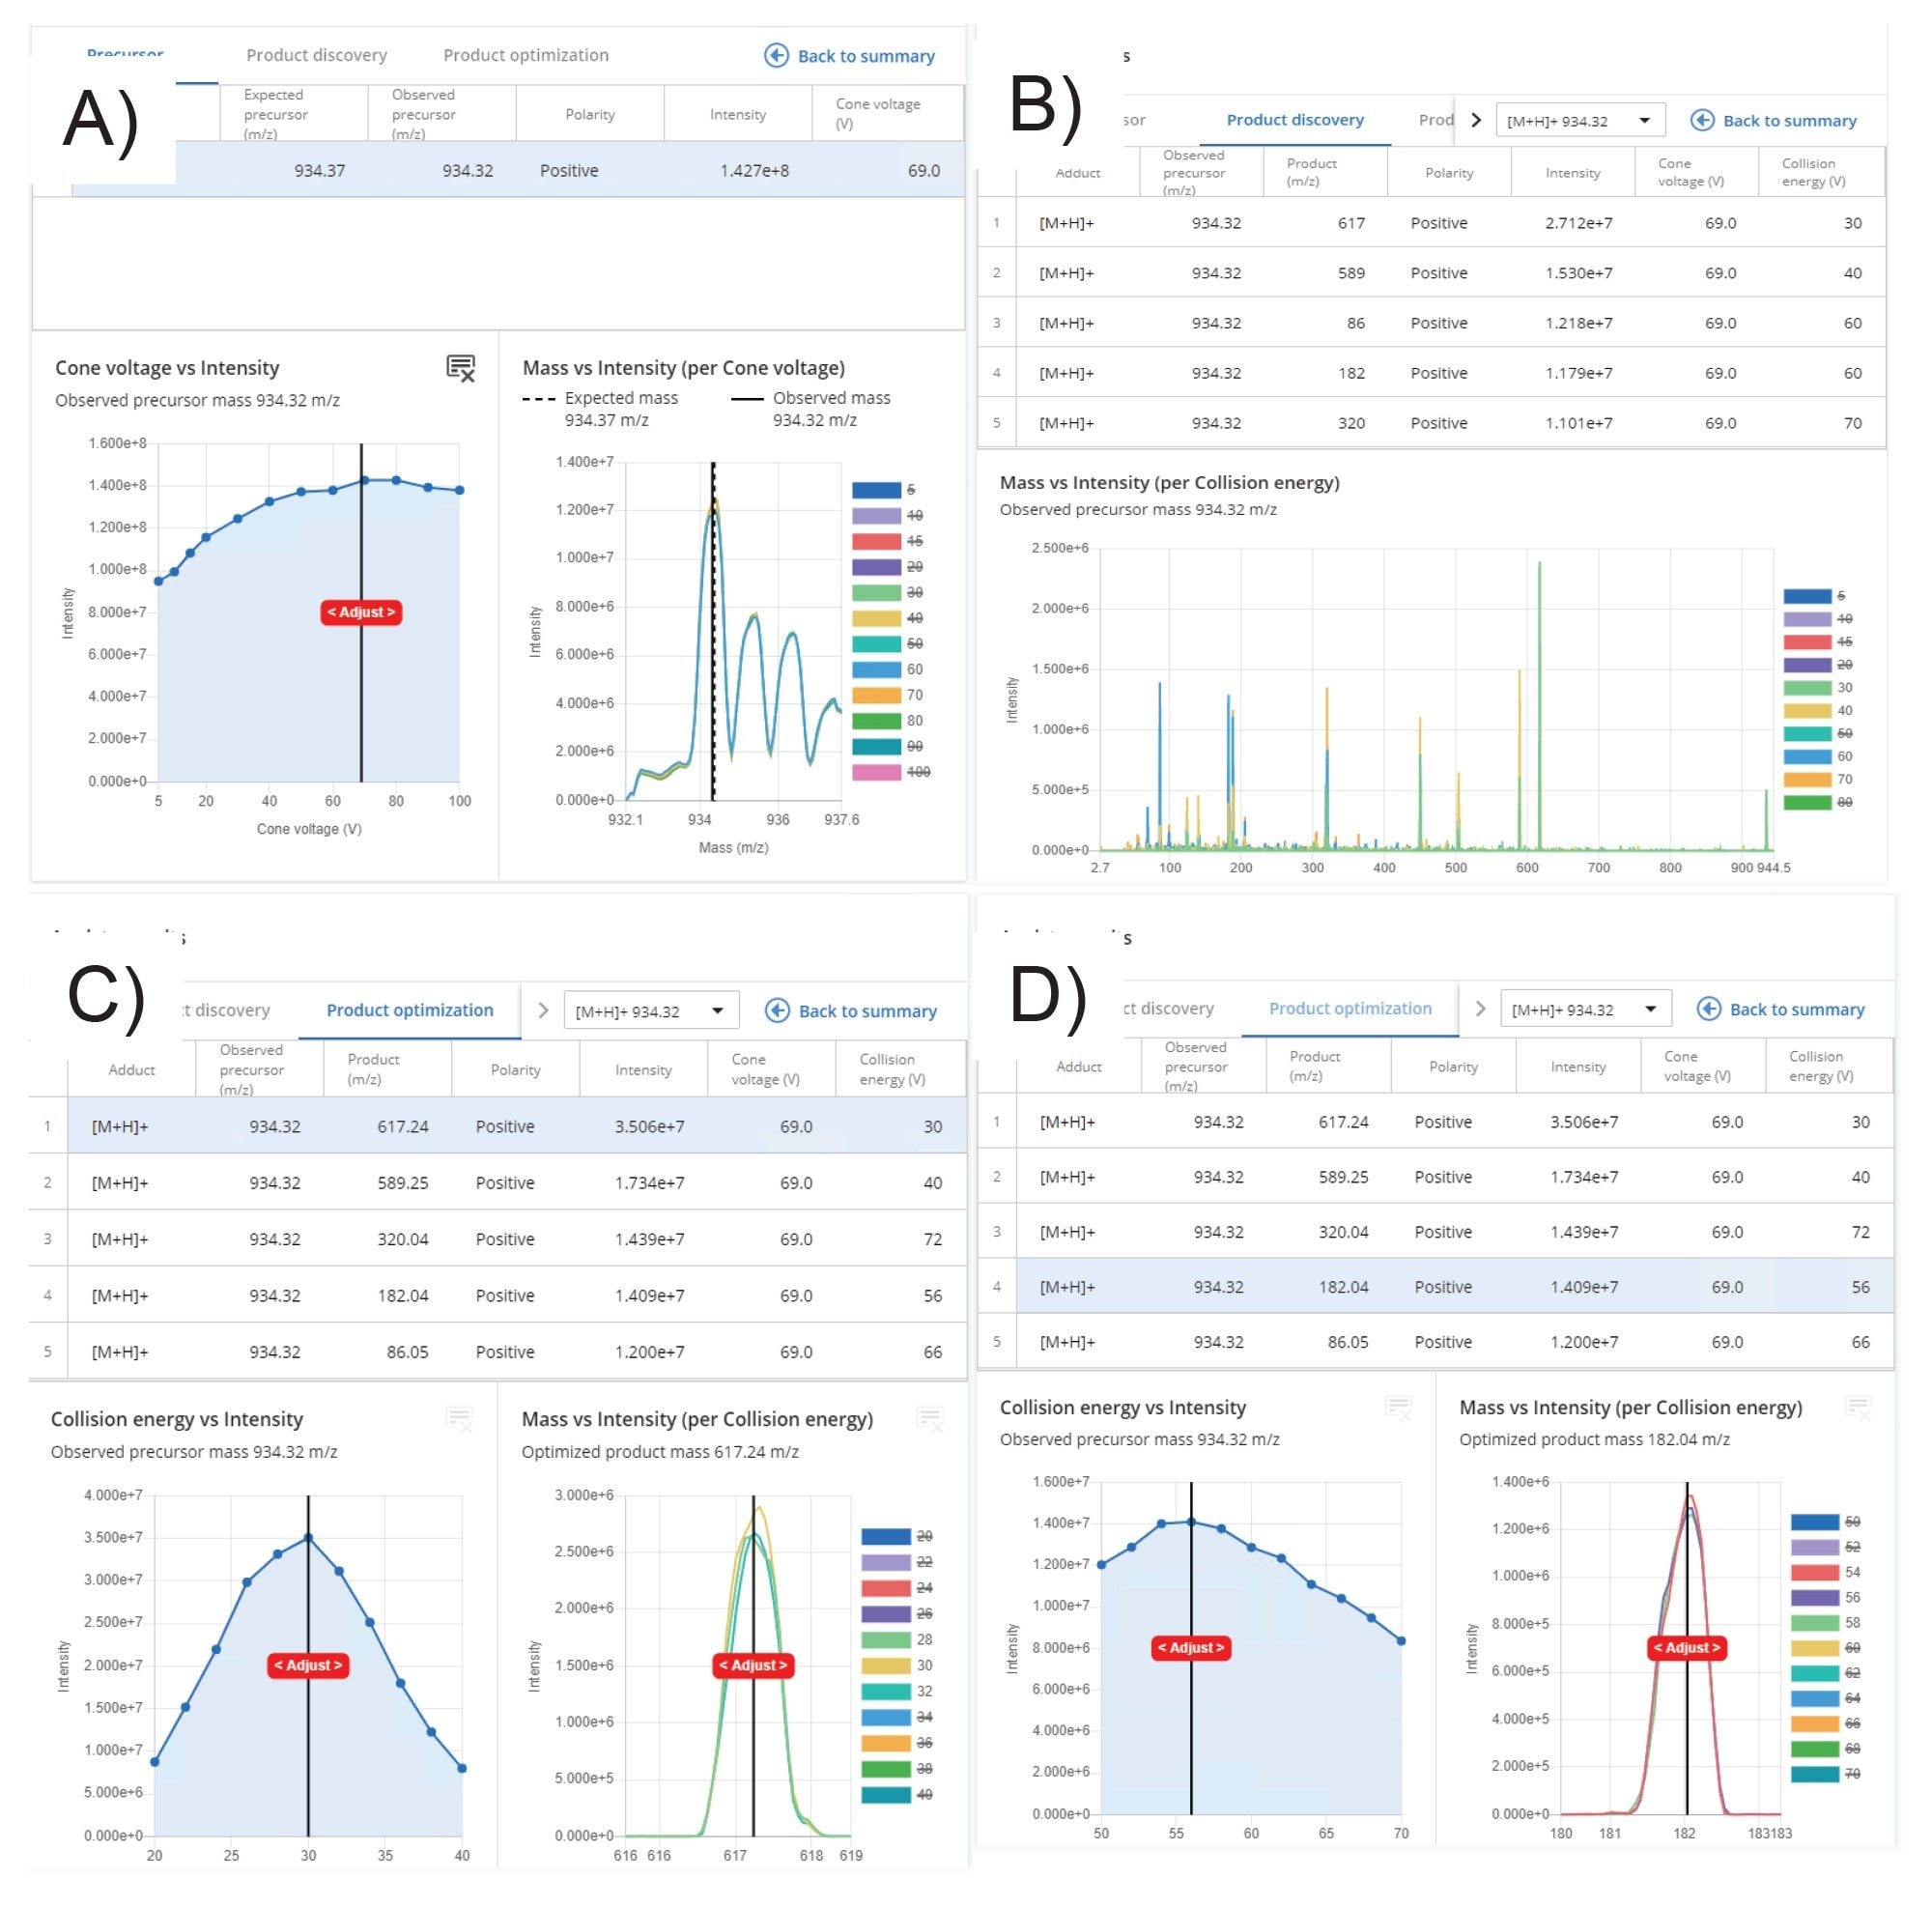
Once the data had been acquired, user review was performed by selecting the compound of interest from the analyte results summary list, as shown in Figure 4. A more thorough assessment of the MRM results was obtained by selecting the “view detailed results” tab. From this view, the detected precursor ions were reviewed and impact of cone voltage visualized. The data in Figure 5A shows that the precursor ion signal cone voltage profile is broad and flat with an optimum value at 70 V. Product ion information was reviewed by selecting the “product discovery” tab. This interactive window allowed the impact of collision energy on the resulting MS spectrum to be reviewed by selecting and deselecting the various values. The resulting data showed that the five product ions were detected, m/z = 617.2, 589.3, 320.0, 182.0, and 86.1, as shown in Figure 5B. The product optimization tab provided an overview of the MS signal dependency on collision energy for the generated product ions. The data in Figures 5C and 5D illustrates how the signal intensity for the MS transitions m/z 934.3 → 617.2 and m/z 934.3 → 182.0 Da varied with MS collision energy. The MS transitions m/z 934.3 → 617.2 Da show a maximum signal intensity at 30 eV whereas the and m/z 934.3 → 182.0 Da exhibits a maximum at 56 eV.
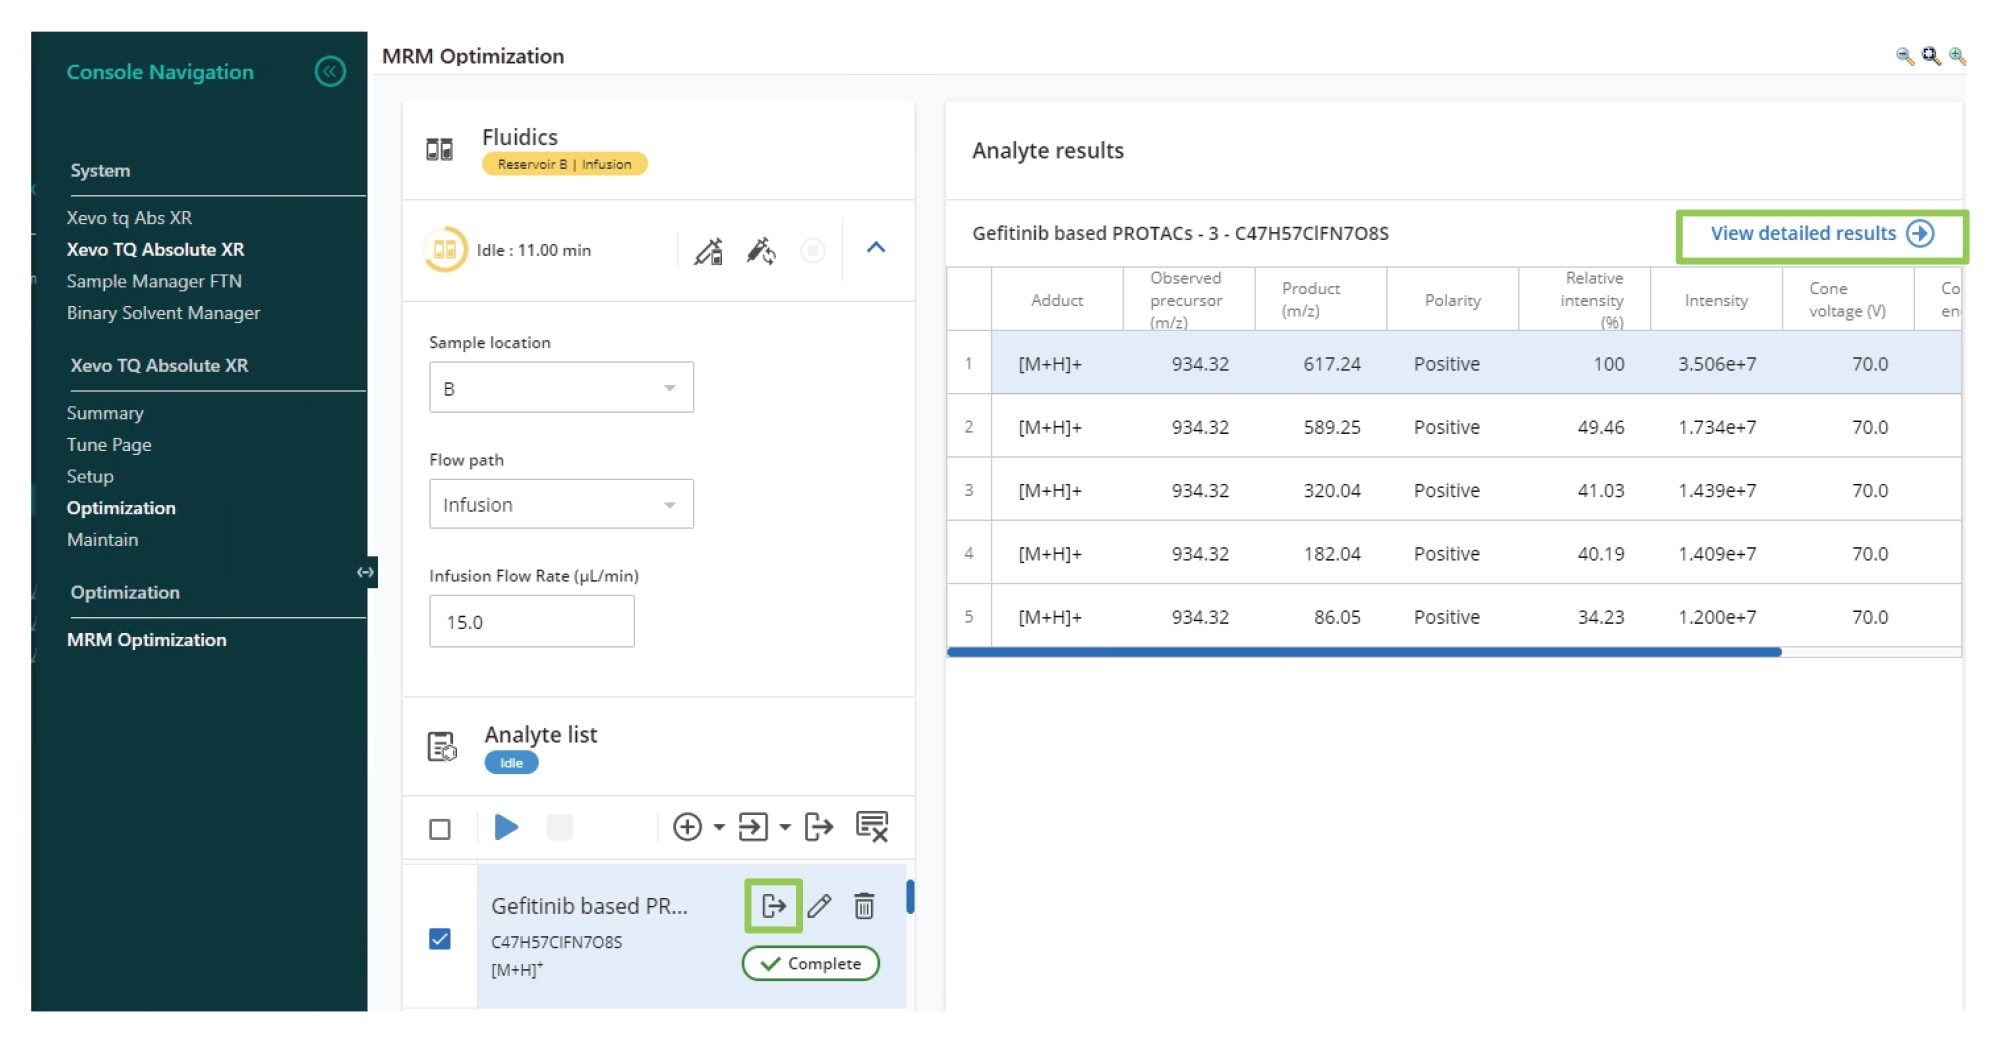
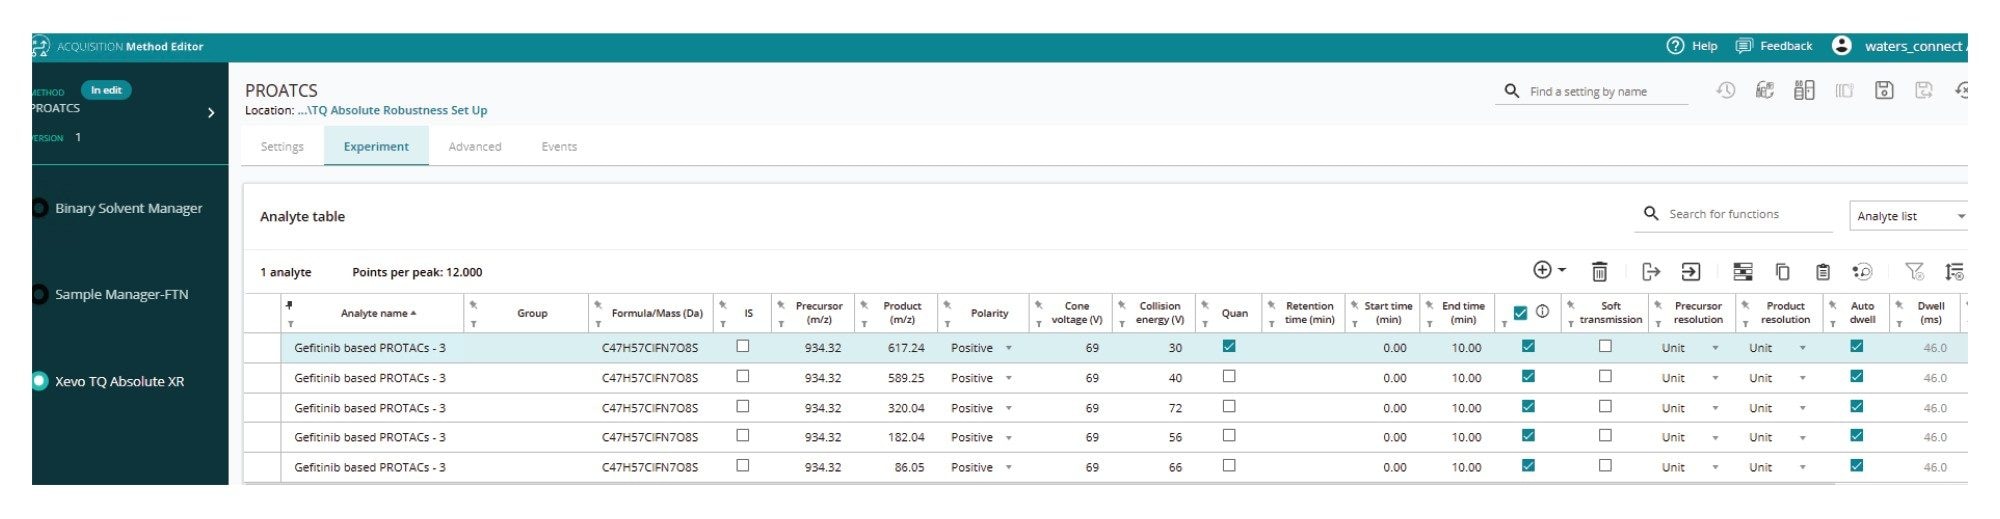
Although the transition m/z 934.3 → 617.2 Da showed a signal response of almost twice that of the next most sensitive transition m/z 934.3 → 589.3 Da and three times that of m/z 934.3 → 182.0 Da, it may not necessarily be the most specific transition when operated with extracted plasma matrix. To evaluate each of these transitions and to optimize the chromatography conditions, the parameters for each of the transitions needed to be transferred to the LC-MS method. This process was simplified and transcription errors mitigated by selecting the Transfer Analytes button in the results summary view (Figure 6). The exported transitions were then imported into a new LC-MS method in waters_connect Acquisitions Method Editor for further analysis and optimization, as shown in Figure 6.
Multiple reaction monitoring combined with liquid chromatography is the bioanalytical methodology of choice to support discovery, preclinical, and human DMPK drug evaluation studies. However, developing these MRM methods can be a time-consuming, laborious process requiring data acquisition and review. The MS Optimization tool within waters_connect for Quantitation Software simplifies the process of data generation and review via a powerful, guided, step-by-step automated process. Once acquired, the various precursor, product ions, cone and collision voltage combinations can be interrogated using a graphical interface. The derived MS-MS transitions can be quickly and seamlessly exported to the LC-MS Acquisition Method Editor for further evaluation and LC method development, thus saving time and improving data quality.
720009125, October 2025