Mass-Directed Isolation of Synthetic Peptides Using the Waters SQ Detector 2
Abstract
This application note illustrates the feasibility of configuring the SQ Detector 2 in the Waters AutoPurification System for the analysis and purification of peptides with mass-to-charge ratios that are within the 2 to 3072 Da mass range.
Benefits
- The SQ Detector 2 identifies peptides with mass-to-charge ratios within the 2 to 3072 Da mass range, which reduces the analyte identification ambiguity that often accompanies analysis and purification with UV-directed systems.
- Mass analysis aids in the identification of contaminant by-products present in the crude peptide mixture, which ultimately assists in the optimization of the peptide synthesis and cleavage protocol and leads to improved product yield.
- AutoPurification Systems configured with an SQ Detector 2 and FractionLynx Software provide clear identification of target compounds in complex matrices, customized fraction collection and tracking, and automatic sample processing, which improve the purification process efficiency.
Introduction
Advancements in analytical instrumentation technology, improvements in synthesis and cleavage reagents and protocols, and developments in biopharmaceutical research have all played a role in the prevalence of peptides as therapeutic candidates targeting many medical conditions.1-5 Rapid, robust peptide synthesis and cleavage strategies yield a multitude of potential target compounds, all of which require purification. Although traditional peptide isolation is usually performed using UV-directed chromatography, many compounds are detected with nonspecific wavelength methods. Tedious post-purification workup is then required to identify the target compound. Whether the crude sample mixture is relatively pure immediately after synthesis and requires only a simple cleanup step to isolate the target peptide, or is more complex with many impurities, mass-directed isolation improves process efficiency by unambiguously identifying the product. The Waters AutoPurification System configured with an SQ Detector 2 provides an alternative choice to UV-directed systems. The selective collection of only the desired product mass reduces the total number of fractions for downstream processing and promotes faster workflow turnaround times. In this work, we illustrate the feasibility of configuring the SQ Detector 2 in the Waters AutoPurification System for the analysis and purification of peptides with mass-to-charge ratios that are within the 2 to 3072 Da mass range.
Experimental
LC Conditions
|
Analytical columns: |
Peptide B, XBridge BEH Phenyl, 4.6 × 100 mm, 5 μm, p/n: 186003351; Large pharmaceutical dosage peptide, XBridge Peptide BEH C18, 4.6 × 50 mm, 5 μm, p/n: 186003578 |
|
Analytical flow rate: |
1.46 mL/min |
|
Prep columns: |
Peptide B, XBridge BEH Phenyl OBD Prep, 19 × 100 mm, 5 μm, p/n: 186003357; large pharmaceutical dosage peptide, XBridge BEH C18 OBD Prep, 19 × 50 mm, 5 μm, p/n: 186002977 |
|
Prep flow rate: |
25 mL/min |
|
Mobile phase A: |
0.1% Formic acid in water |
|
Mobile phase B: |
0.1% Formic acid in acetonitrile |
|
Makeup solvent: |
Methanol |
MS Parameters
|
Cone voltages: |
Peptide B, 59 V; biopharmaceutical dosage peptide, 35 V |
|
Capillary voltage: |
3.51 kV |
|
RF voltage: |
3.50 V |
|
Extractor voltage: |
3.00 V |
|
Source temp.: |
150 °C |
|
Desolvation temp.: |
500 °C |
|
Cone gas flow: |
10 L/Hr |
|
Desolvation gas flow: |
1000 L/Hr |
|
Ionization mode: |
ES+, continuum |
|
Scan range: |
100–3072 amu |
|
Gradients and injection volumes: |
As noted in figures |
Samples
Peptide B; crude synthetic peptide comprised of 14 amino acid residues: 4 polar, 10 nonpolar; purity 63% by HPLC.
|
Monoisotopic peptide B mass: 1322.71 Da |
|
|---|---|
|
Target ions for charge states |
m/z |
|
[M+H]+ |
1323.7 |
|
[M+2H]2+ |
662.4 |
|
[M+4H]4+ |
331.7 |
Large peptide; biopharmaceutical dosage peptide comprised of 39 amino acid residues: 10 polar, 20 nonpolar, 2 basic, 7 acidic; purity 96% by HPLC.
|
Average large peptide mass: 4186.6 Da |
|
|---|---|
|
Target ions for charge states |
m/z |
|
[M+3H]3+ |
1396.5 |
|
[M+4H]4+ |
1047.7 |
Instrumentation
Waters AutoPurification System: 2545 Binary Gradient Module, 2767 Sample Manager, System Fluidics Organizer, 8–30 mL Flow Splitter, two 515 HPLC pumps, 2998 Photodiode Array Detector, SQ Detector 2
Results and Discussion
Mass-directed purification is an effective technique for the isolation of target peptides from crude sample mixtures. As higher molecular weight peptides become more prevalent as potential therapeutic entities, the number of peptide-related impurities increases, a result of the chemical reactions incurred with each amino acid addition. Although most reactions are quickly driven to completion, any aberration in a single synthetic step could potentially initiate impurity formation. After synthesis and cleavage of the peptide from the solid supporting resin, contaminants in the crude sample mixture must be removed before the target molecule can be used in other experimental studies. While non-specific UV-directed purification is well-accepted in many peptide purification schemes to perform this task, mass-directed isolation quickly distinguishes the product from related impurities to reduce the post-purification workup of extraneous fractions.
Electrospray, a technique which ionizes samples at atmospheric pressure, generates molecules with multiple charges, and is frequently used in mass-directed purification. Although some peptides may have molecular weights higher than the upper mass limit of the analyzer, multiply-charged ions of the peptide (with lower m/z values) usually fall within the mass range of the spectrometer. Several factors influence the charge state of peptides including the diluent pH, the number of acidic and basic amino acid functional groups, and the physical properties of the solvent used in the analysis.6
For the studies described, the AutoPurification System was configured with the SQ Detector 2. The SQ Detector 2 has a broad mass range (2 to 3072 m/z), which makes it more amenable for analyses of samples with higher masses.
Peptide B
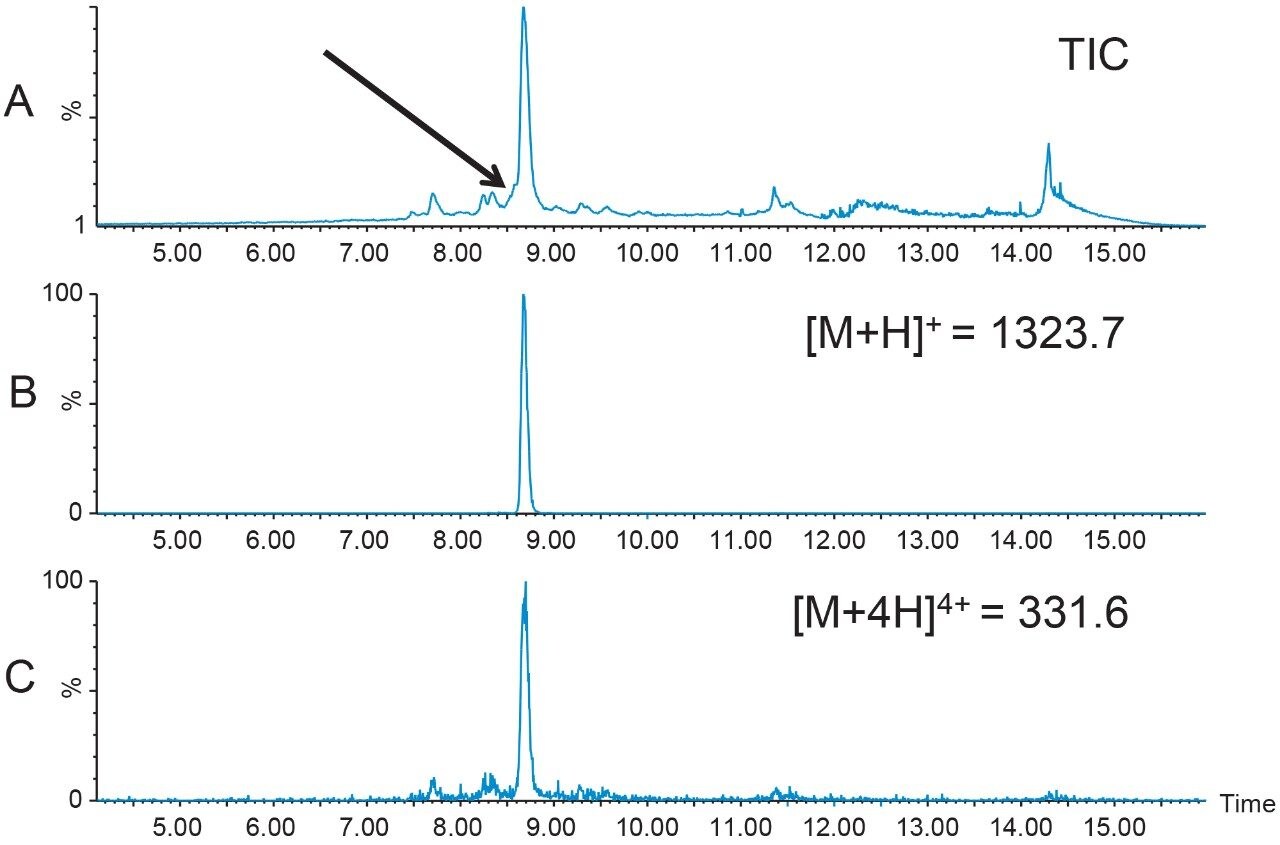
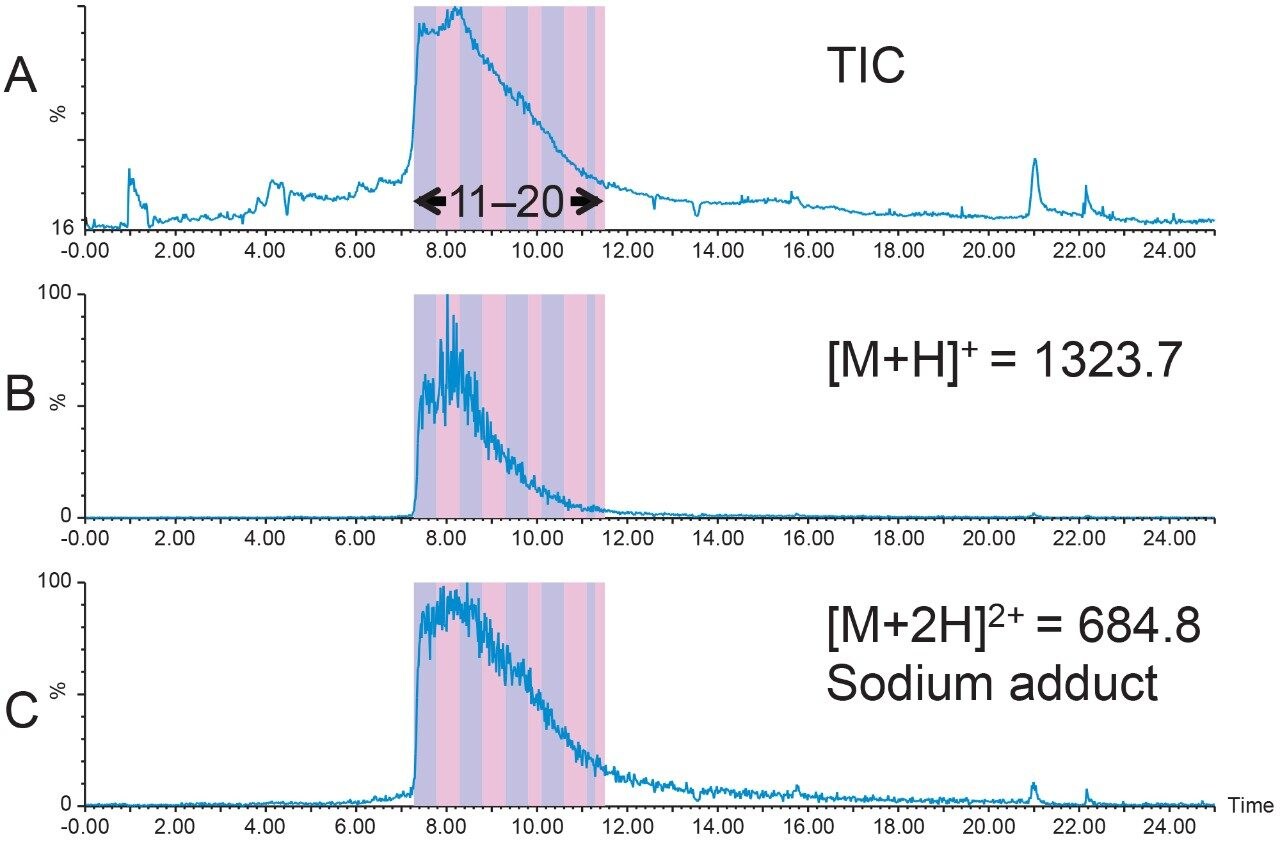
1.6 mg of crude Peptide B was dissolved in dimethylsulfoxide (DMSO) and filtered with a 13 mm Acrodisc GHP syringe filter. The total ion chromatogram (Figure 2A) for the analysis of the crude peptide sample showed several small impurities eluting near the product peak at 8.7 min. The singly-charged [M+H]+ and the quadruply-charged [M+4H]4+ peptides (Figures 2B and 2C, respectively), were the most abundant peptide charge states present in the sample mixture. The TIC also displayed a partially co-eluting peak on the leading edge of the target peptide peak. Although the peptide product was identified by the extracted mass ions, the close proximity of the peptide product to other closely-eluting contaminants would undoubtedly reduce the preparative sample loading in the isolation step. For this reason, a focused gradient7 was developed to improve the resolution between the crude sample constituents.
Focused gradients, an alternative to universally shallower gradients, decrease the gradient slope for only that portion of the chromatogram that needs increased resolution, providing more resolution between closely-eluting peaks without increasing the total run time. The target peptide peak organic elution percent was calculated to be 38.6%B, a value which can easily be determined when the system volume, column volume, and retention time are known from the analytical screening run.
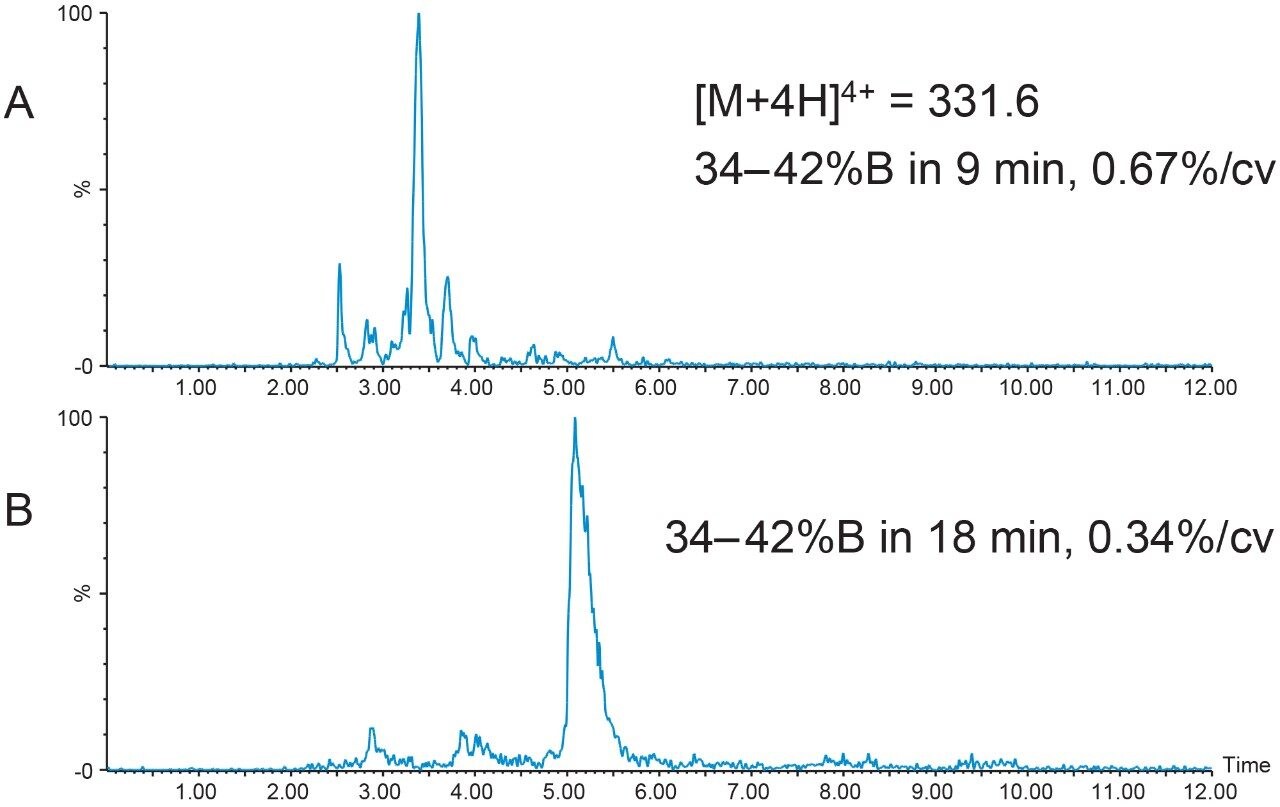
Narrow elution ranges, usually from 5% below to 3% above the target peak elution percent, promote reasonable total chromatographic run times. With a peptide product elution percent of about 39%B, the focused gradient was developed to progress from 34%B to 42%B with a slope of 0.67%/column volume, or one-fifth the rate of gradient change per column volume used in the original screening run. Although the separation using this focused gradient resolved some of the sample component peaks (Figure 3A), the resolution was still not adequate for scaling to prep. Complex peptide mixtures often require an even shallower gradient slope to achieve satisfactory resolution between component peaks, sometimes as low as 0.2–0.4% change per column volume. Reducing the gradient slope to 0.34% change per column volume improved the resolution between the peptide sample mixture peaks (Figure 3B), increasing the probability of improved sample loading and higher purity sample recovery.
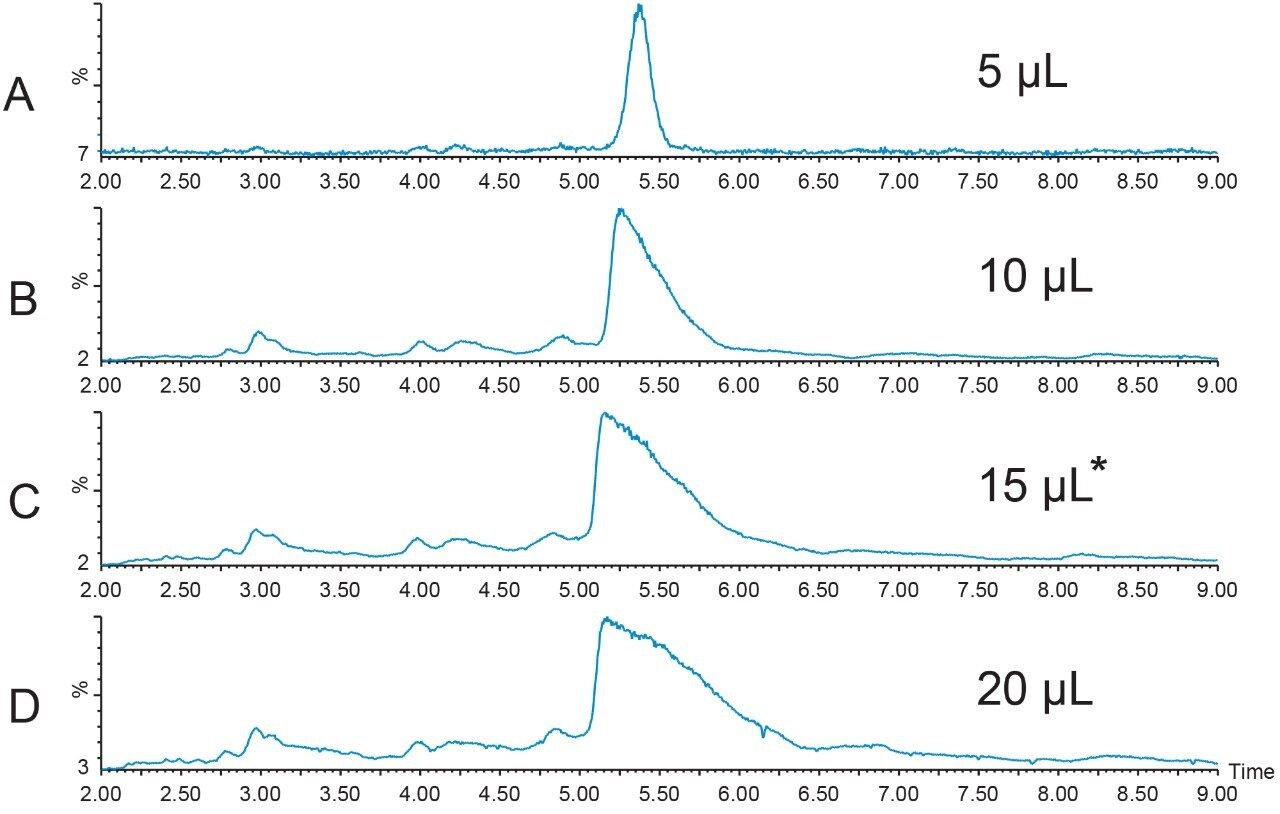
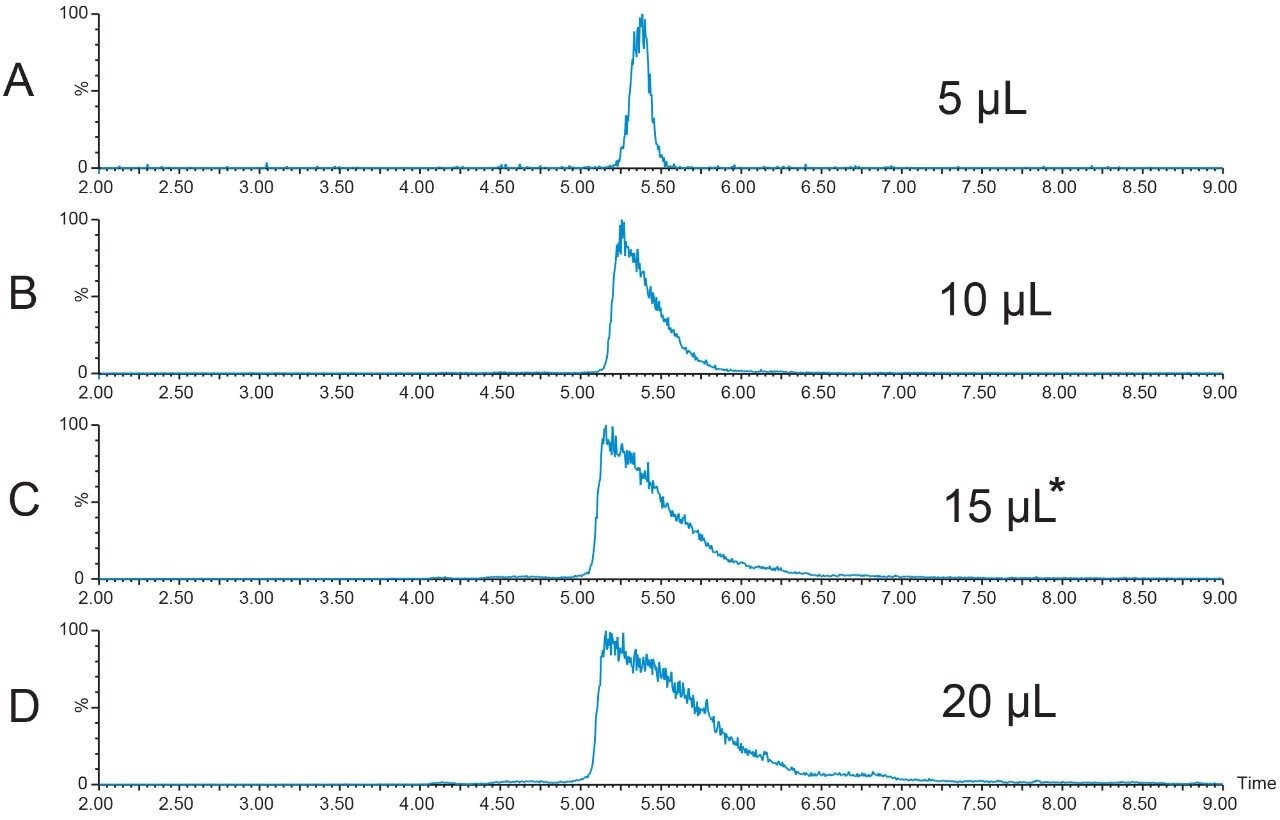
A new peptide sample at higher concentration (12.4 mg/mL) was prepared in DMSO and filtered. A loading study was performed to determine the maximum amount of peptide that could be introduced to the column without compromising the resolution of the sample components. Although the recommendation to always use the extracted mass ion(s) for evaluation of the chromatographic results is usually the best, sometimes considering the TIC chromatogram results is also useful in making a final decision about sample loading. A more conservative loading amount was chosen for scaling to prep because of the close proximity of the peak which eluted just before the target peptide. Figures 4 and 5 show the TICs and the [M+H]+ chromatograms, respectively, for the loading study performed with the new, more concentrated peptide sample. The 15 μL injection was chosen as the maximum injection volume for small scale loading on the 4.6 × 100 mm column.
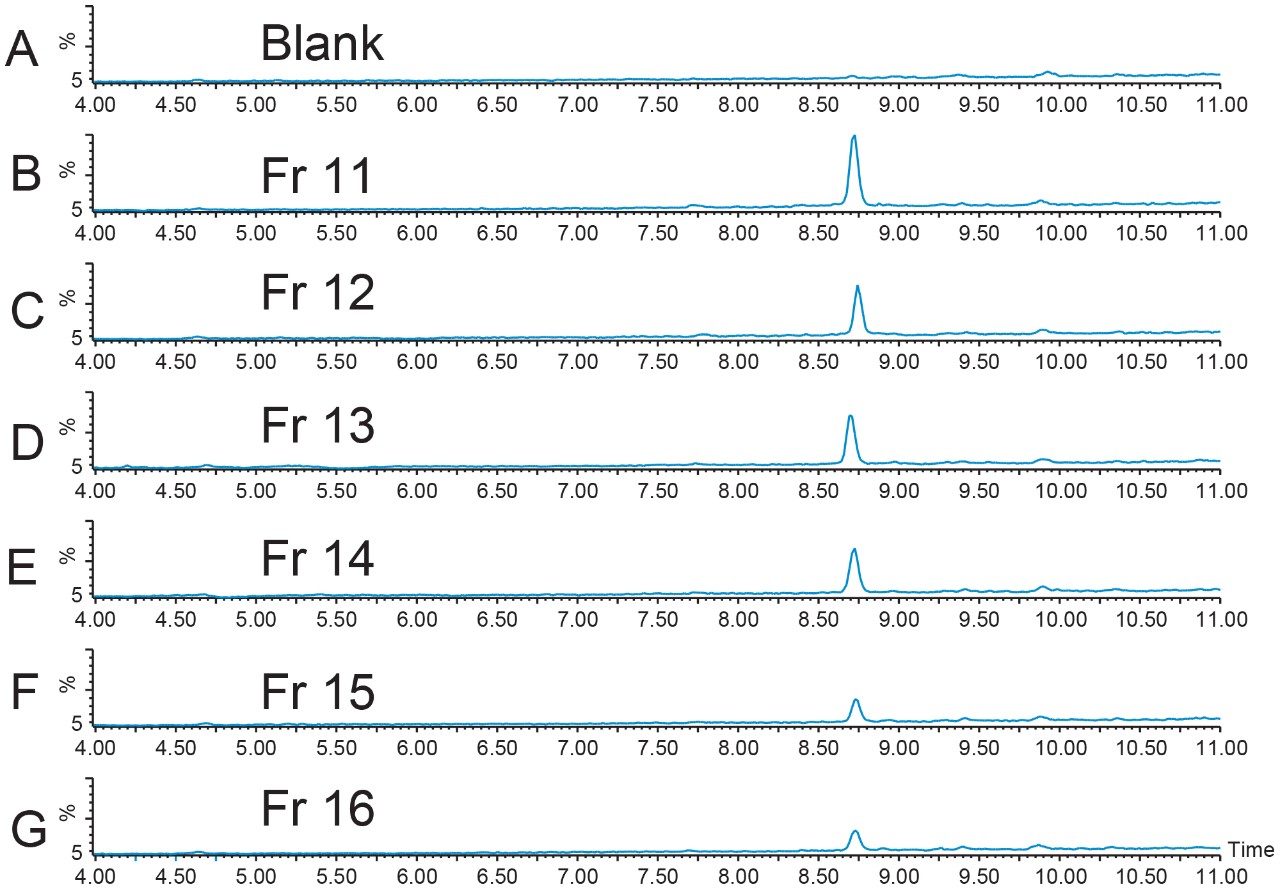
Geometric scaling for preparative chromatography on the 19 × 100 XBridge BEH Phenyl Column was performed. Ten fractions were collected from the 256 μL injection with fraction triggering on the [M+H]+ ion and the sodium adduct of the doubly-charged peptide (Figure 6). Fraction analysis (Figure 7) was performed immediately after collection on the 4.6 × 1 00 mm column using the original screening gradient. Fractions 17 through 20 had very little product in them, but all of the other fractions showed excellent product purity.
Biopharmaceutical Dosage Peptide
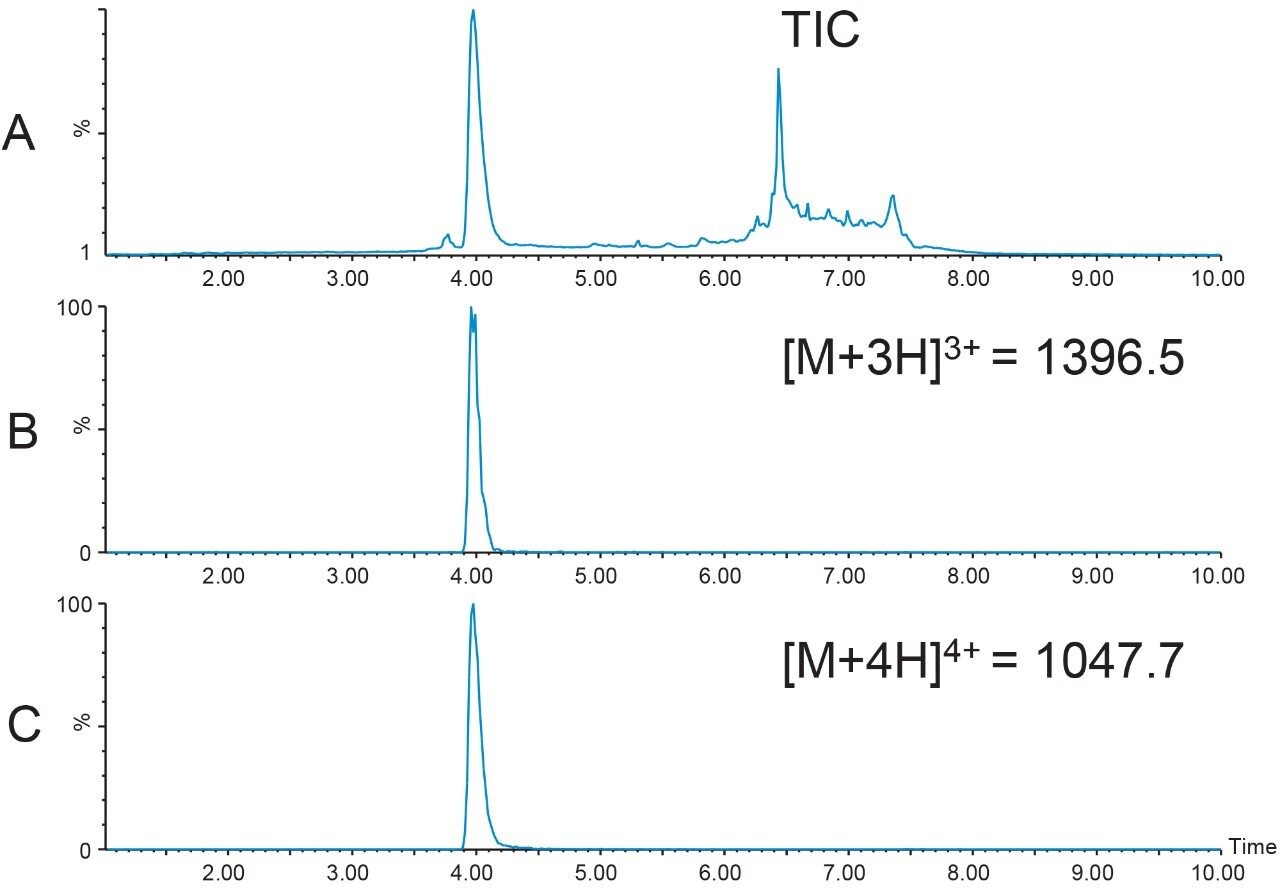
Since the 39-mer used for this illustrative study was already processed by the manufacturer, and any contaminants were probably due to degradation which occurred during prolonged storage, a short, 4.6 × 50 mm XBridge BEH C18 Column was chosen for initial screening (Figure 8). The sample was prepared by diluting 740 μL of peptide from its repeatable syringe delivery device in 2 mL DMSO. As expected, the peptide was relatively pure with most contaminants in the column washout (Figure 8A). These peaks can most likely be attributed to other compounds present in the peptide formulation. The most abundant charge states detected were the [M+3H]3+ (m/z 1396.5) and [M+4H]4+ (m/z 1047.7) ions, which correlate to the average mass of 4186.6 Da for the peptide.
For most small molecule and small peptide isolations, the monoisotopic mass is the mass used for identification and other related ion adducts are defined and monitored based on this value. For larger molecules such as peptides, sometimes the average mass is used as the primary identifier. The monoisotopic mass is calculated using the mass of the most abundant isotopes of each element in the molecule, while the average mass is calculated using the weighted average of all of the naturally occurring isotopes of each element in the molecule.8-10 Consequently, for peptides, the average mass can be notably larger than the monoisotopic mass. As the number of carbons in the molecule increases, there is a greater probability that more 13C will be present, which will, in turn, increase the molecular weight. In addition, the monoisotopic mass may not be the most abundant peak in the average mass spectrum. While there is no rule to define when to use monoisotopic mass or average mass, transitioning to the use of average mass for peptide triggering usually is in the 1500–1700 molecular weight range. In practice, many available software programs calculate both the average and monoisotopic m/z for the peptide charge states. It is most prudent to include both alternatives as triggers. The best choices for triggering will become evident during the screening run prior to isolation.
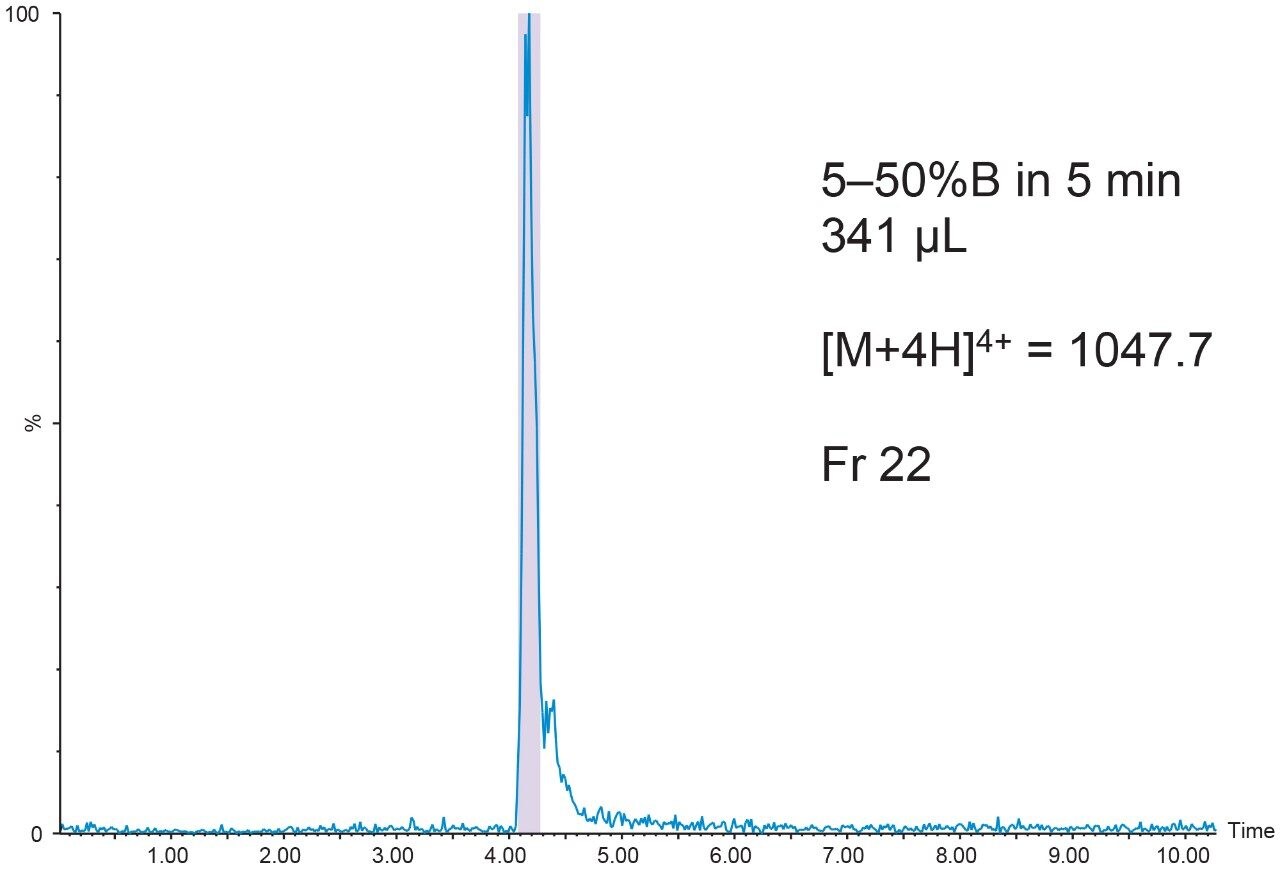
The 20 μL analytical injection volume was scaled to 341 μL for injection on the 19 × 50 mm preparative column. Fraction collection was triggered by the [M+4H]4+ (m/z 1047.7) ion. One fraction tube was collected (Figure 9).
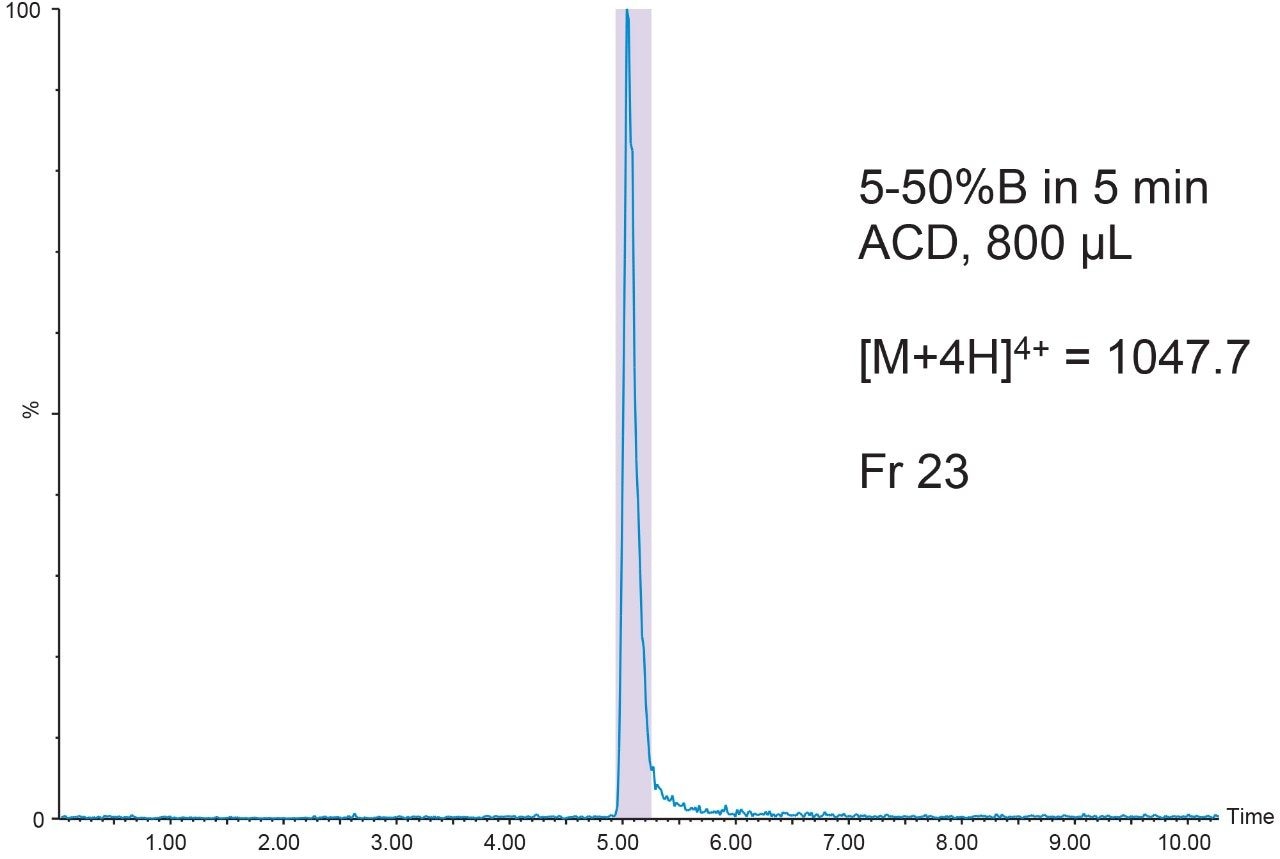
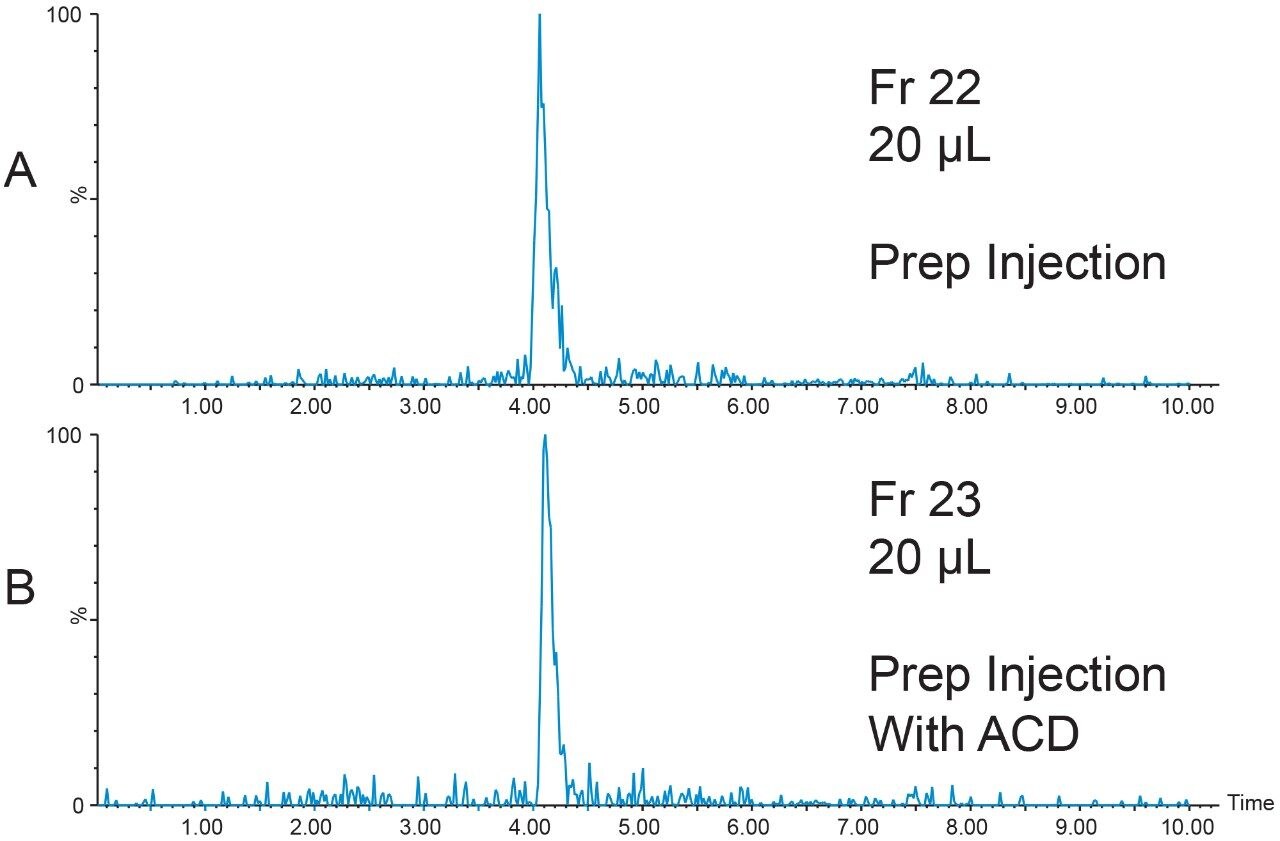
The chromatographic system was plumbed for at-column dilution11 and the remainder of the prepared peptide sample (800 μL) was injected (Figure 10). Again, one fraction was collected. Fraction analysis for both the conventional injection and the at-column dilution injection showed excellent purity despite the very low peptide concentration (Figure 11).
Conclusion
- Peptide isolation is easily accomplished using the Waters AutoPurification System configured with the SQ Detector 2, thus making it a viable alternative for purification of those peptides with molecular weights and charge state masses which fall within the 2–3072 Da mass range of the detector.
- Mass-directed purification quickly identifies the target peptide product and improves the efficiency of the isolation by eliminating unnecessary processing steps.
- Focused gradients improve the resolution between closely-eluting peptide impurities, contribute to improvements in peptide isolation protocols, and reduce overall chromatographic run times.
- The SQ Detector 2 can be used to gather mass data on peptide by-products, which may be useful for optimizing synthesis and cleavage protocols.
References
- De Spiegeleer B, D’Hondt M, Gevaert B, Wynendaele E. Implementation of a Single Quad MS Detector in Routine QC Analysis of Peptide Drugs. Journal of Pharmaceutical Analysis 6(2016)24-31. http://dx.doi.org/10.1016/j.jpha.2015.09.002.
- Jad Y, de la Torre B, Govender T, Kurger H, El-Faham A, Albericio F. Oxyma-T, Expanding the Arsenal of Coupling Reagents. Tetrahedron Letters, Volume 57, Issue 31, 2016, 3523–3525. https://doi/org/10.1016/j.tetlet.2016.06.109
- Uhlig T, Kyprianou T, Martinelli FG, Oppici CA, Heiligers D, Hills D, Calvo XR, Verhaert P. The Emergence of Peptides in the Pharmaceutical Business: From exploration to exploitation. EuPA OPEN PROTEOMICS 4 (2014) 58–69.
- Augusta University. Manmade Peptides Reduce Breast Cancer’s Spread. August 2, 2017. https://www.technologynetworks.com/analysis/go/lc/view-source-290830.
- Oligos & Peptides. Chemistry Today, Volume 34(2)March/April 2016.
- Banerjee S., Mazumdar S. Electrospray Ionization Mass Spectrometry: A Technique to Access the Information Beyound the Molecular Weight of the Analyte. Hindawi Publishing Corporation, International Journal of Analytical Chemistry, Vol. 2012, Article ID 282574, 40 pages. Doi:10.1155/2012/282574.
- Jablonski J, Wheat T, Diehl D. Developing Focused Gradients for Isolation and Purification. Waters Technical Note 720002955EN. September 2009.
- Volmer D.A., Leslie A.D. Dealing With the Masses: A Tutorial on Accurate Masses, Mass 32 Uncertainties, and Mass Defects, Spectroscopy. Vol. 22, Issue 6, June 1, 2007.
- Murray K.K., Boyd R.K., Eberlin M.N., Langley G.J., Li L., Naito Y. Definition of Terms Relating to Mass Spectrometry (IUPAC Recommendations 2013). Pure Appl. Chem., Vol 85, No. 7, pp. 1515–1609, 2013.
- Yergey J., Heller D., Hansen G., Cotter R.J., Fenselau C. Anal. Chem. 55, 353 (1983).
- Wheat T., et.al. At-Column Dilution Application Notes. Waters Application Note 71500078010rA. 2003.
Featured Products
720006381, April 2024