A Simple LC-MS/MS Method for Simultaneous Analysis of 35 Anti-psychotics in Human Plasma for Clinical Research
Nur zu Forschungszwecken. Nicht als diagnostisches Verfahren geeignet.
Abstract
LC-MS/MS is a technique which allows selective and analytically sensitive analysis of large panels in single run sets. In this application note, we describe a simple and robust clinical research method for the simultaneous analysis of 35 antipsychotics in human plasma using an ACQUITY™ UPLC™ I-Class System coupled with a Xevo™ TQ-S micro Mass Spectrometer as a tool in clinical research.
Benefits
- A method for simultaneous quantification of 35 antipsychotics in human plasma within one single LC-MS/MS run
- Simple and cost-effective sample preparation
- Injection to injection time of less than five minutes
Introduction
Antipsychotic drugs are widely used in combination with other drugs leading to potential pharmacokinetic (PK) and pharmacodynamic (PD) drug interactions. Many of these interactions have not been adequately studied for clinical research.1 Herein, we demonstrate a simple, cost-effective, fast and robust LC-MS method which is based on protein precipitation for simultaneous analysis of 35 antipsychotics drugs in human plasma. The verification of the method was performed including the functional sensitivity, linearity, extraction recovery, matrix effects, interferences, and autosampler stability.
Experimental
The calibration ranges and quality control (QC) sample concentrations for all 35 compounds are shown in Table 1.
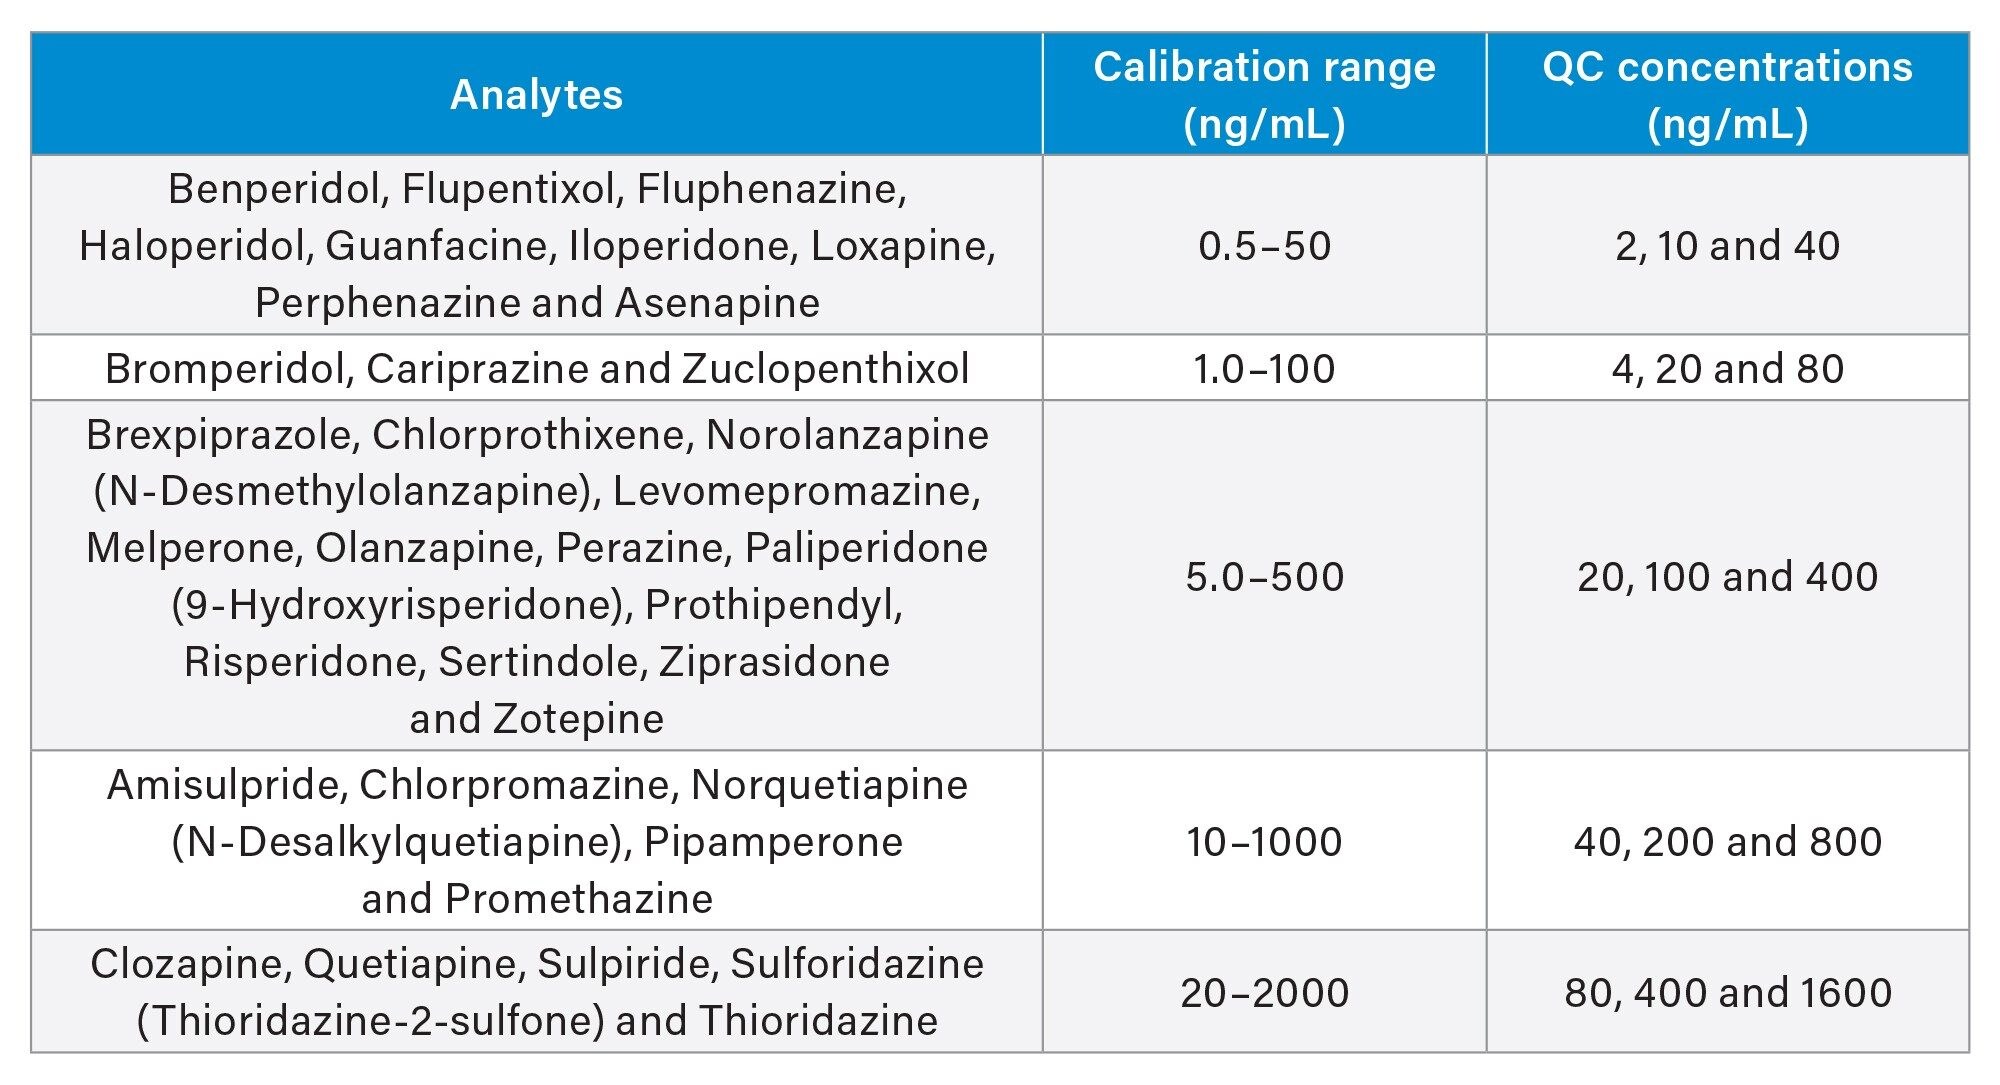
The calibration standards consisted were prepared from the working solutions containing the 35 analytes at 5 different concentration levels. (See Table 1) A mixture of stable isotope labeled internal standards (SIL-IS) at different concentrations corresponding to the appropriate calibration ranges of the antipsychotic compounds were prepared directly in protein precipitation solvent (PPS). The PPS was a mixture of 70:30 (v:v) MeOH:0.1M ZnSO4(aq).
To 50 µL of plasma, 100 µL of PPS was added and all samples were vortex mixed briefly before centrifugation at 18,000 g for five minutes at room temperature. 100 µL of the supernatant was transferred into a 96-well plate (Waters™ 1ml Round Collection Plate, p/n: 186002481) and then diluted with 100 µL distilled pure water. The samples in the plate were mixed on a shaker for three minutes at 850 rpm and room temperature prior to analysis by LC-MS/MS using multiple reaction monitoring (MRM).
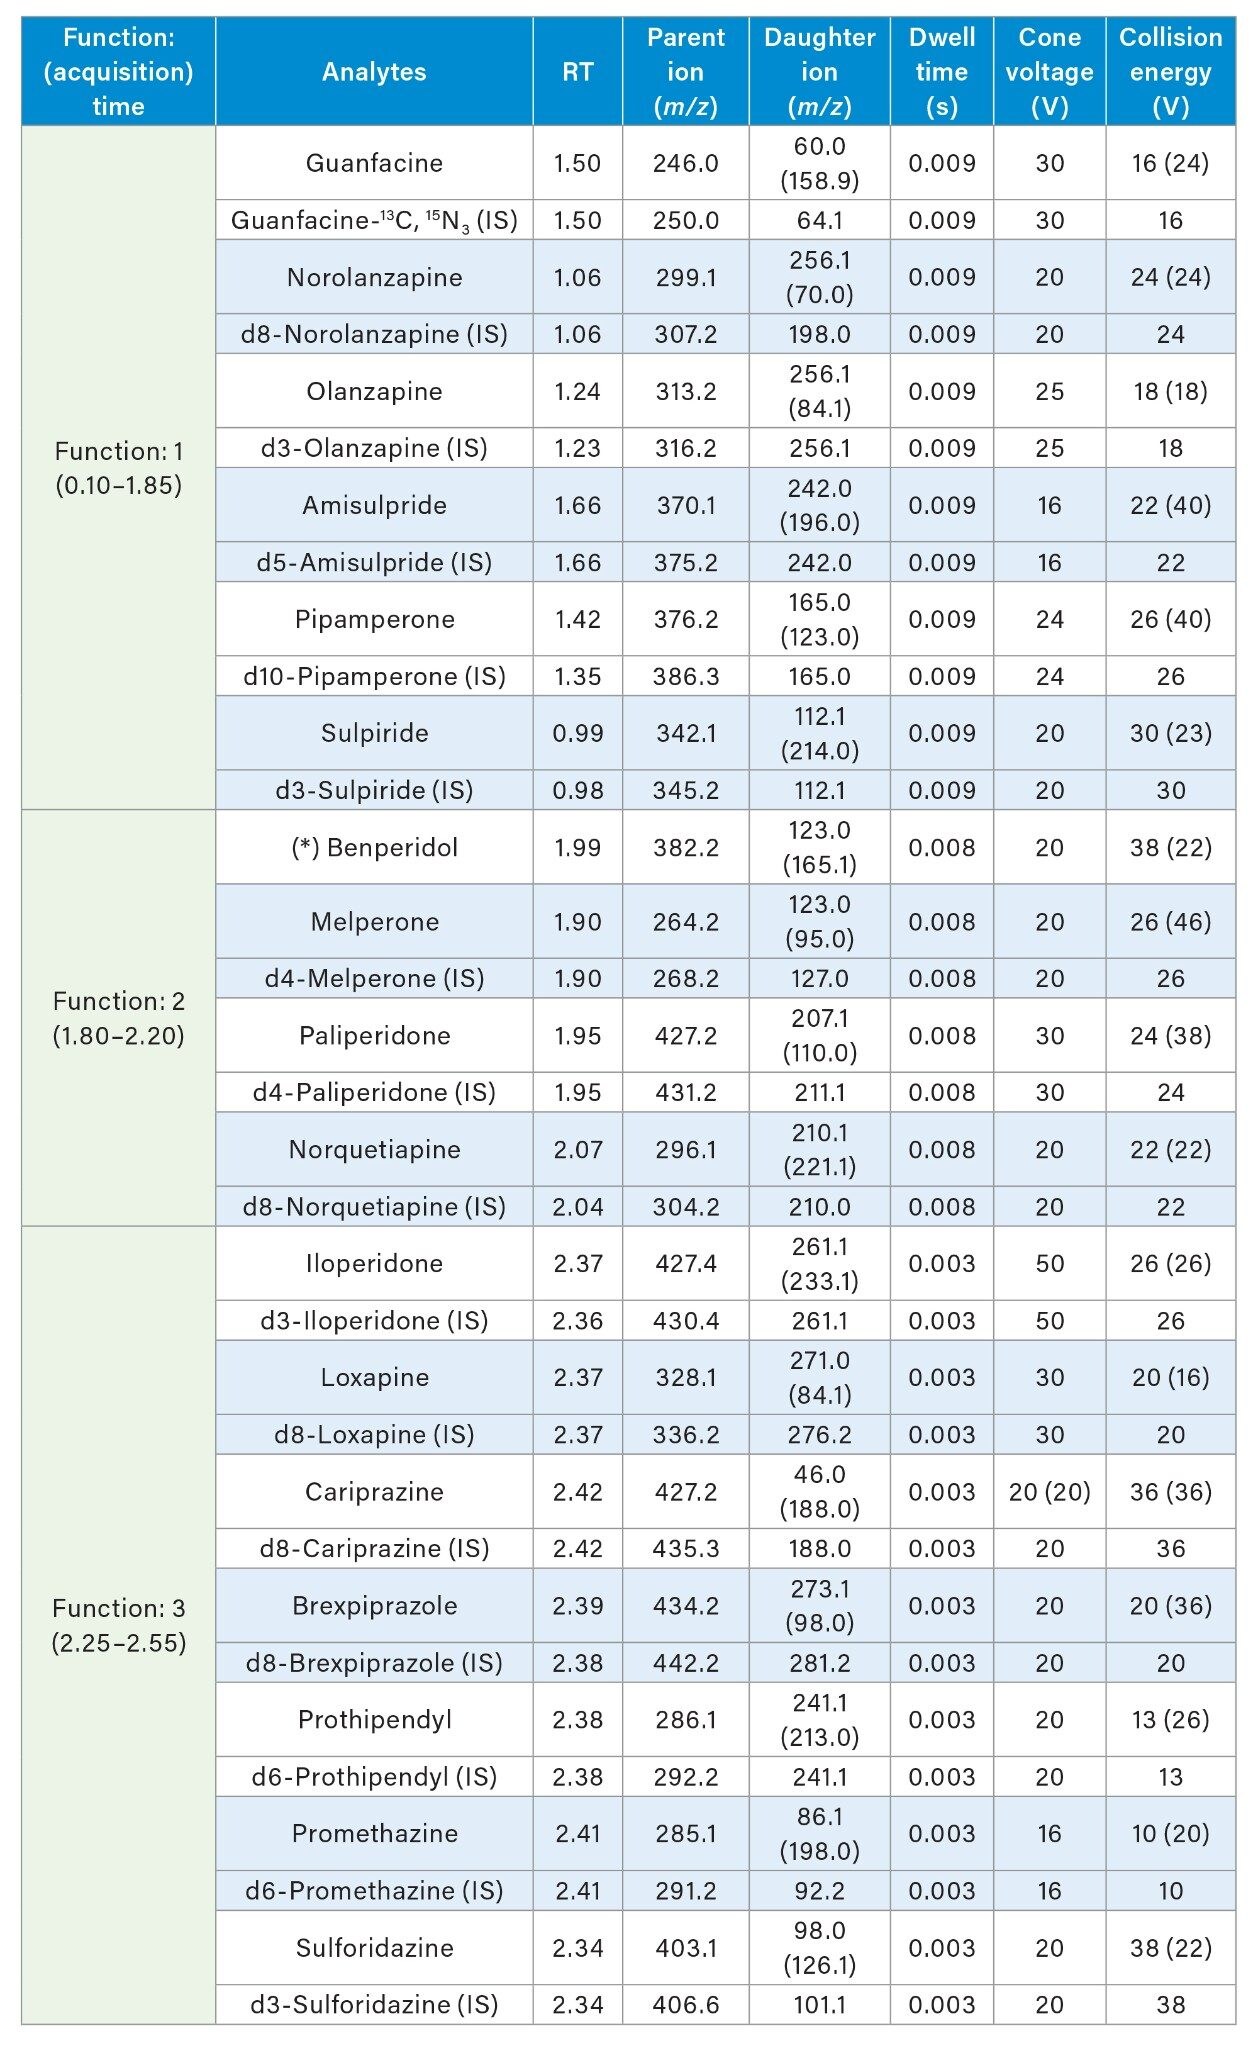
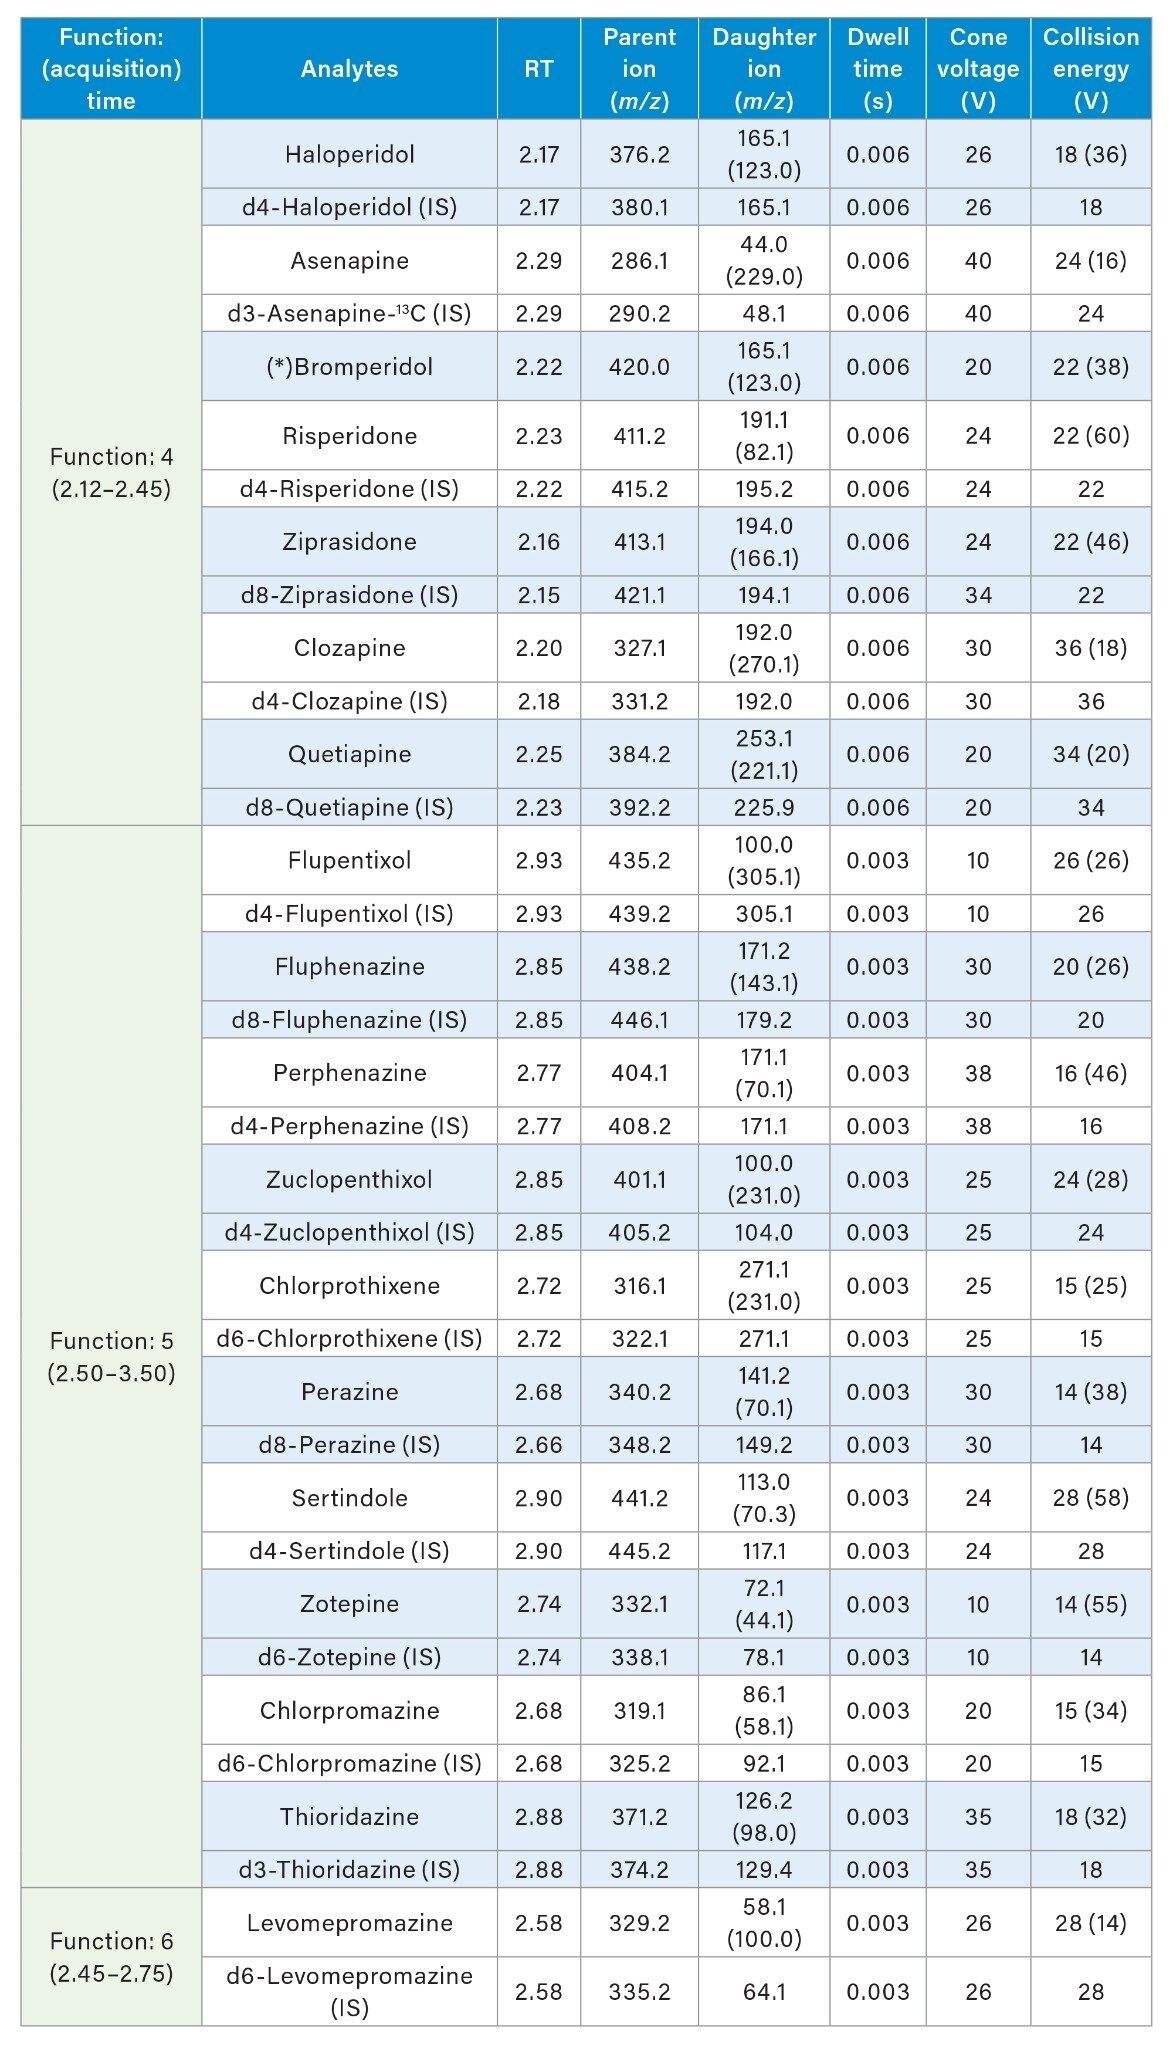
A Waters Xevo TQ-S micro Triple Quadrupole Mass Spectrometer coupled to an ACQUITY UPLC I-Class System with FL Sample Manager was used for all analyses. Ionization was achieved using electrospray in the positive ionization mode (ES+). Details of the MRM conditions are given in Table 2.
LC Conditions
|
LC system: |
ACQUITY UPLC I-Class System with FL Sample Manager |
|
Column: |
XSelect™ HSS C18 SB XP Column, 100 Å, 2.5 µm, 2.1 mm x 30 mm, (p/n: 186006160) |
|
Column temperature: |
45 °C (pre-column heater active) |
|
Sample temperature: |
5 °C ± 2° C |
|
Loop volume: |
50 µL |
|
Injection volume: |
15 µL |
|
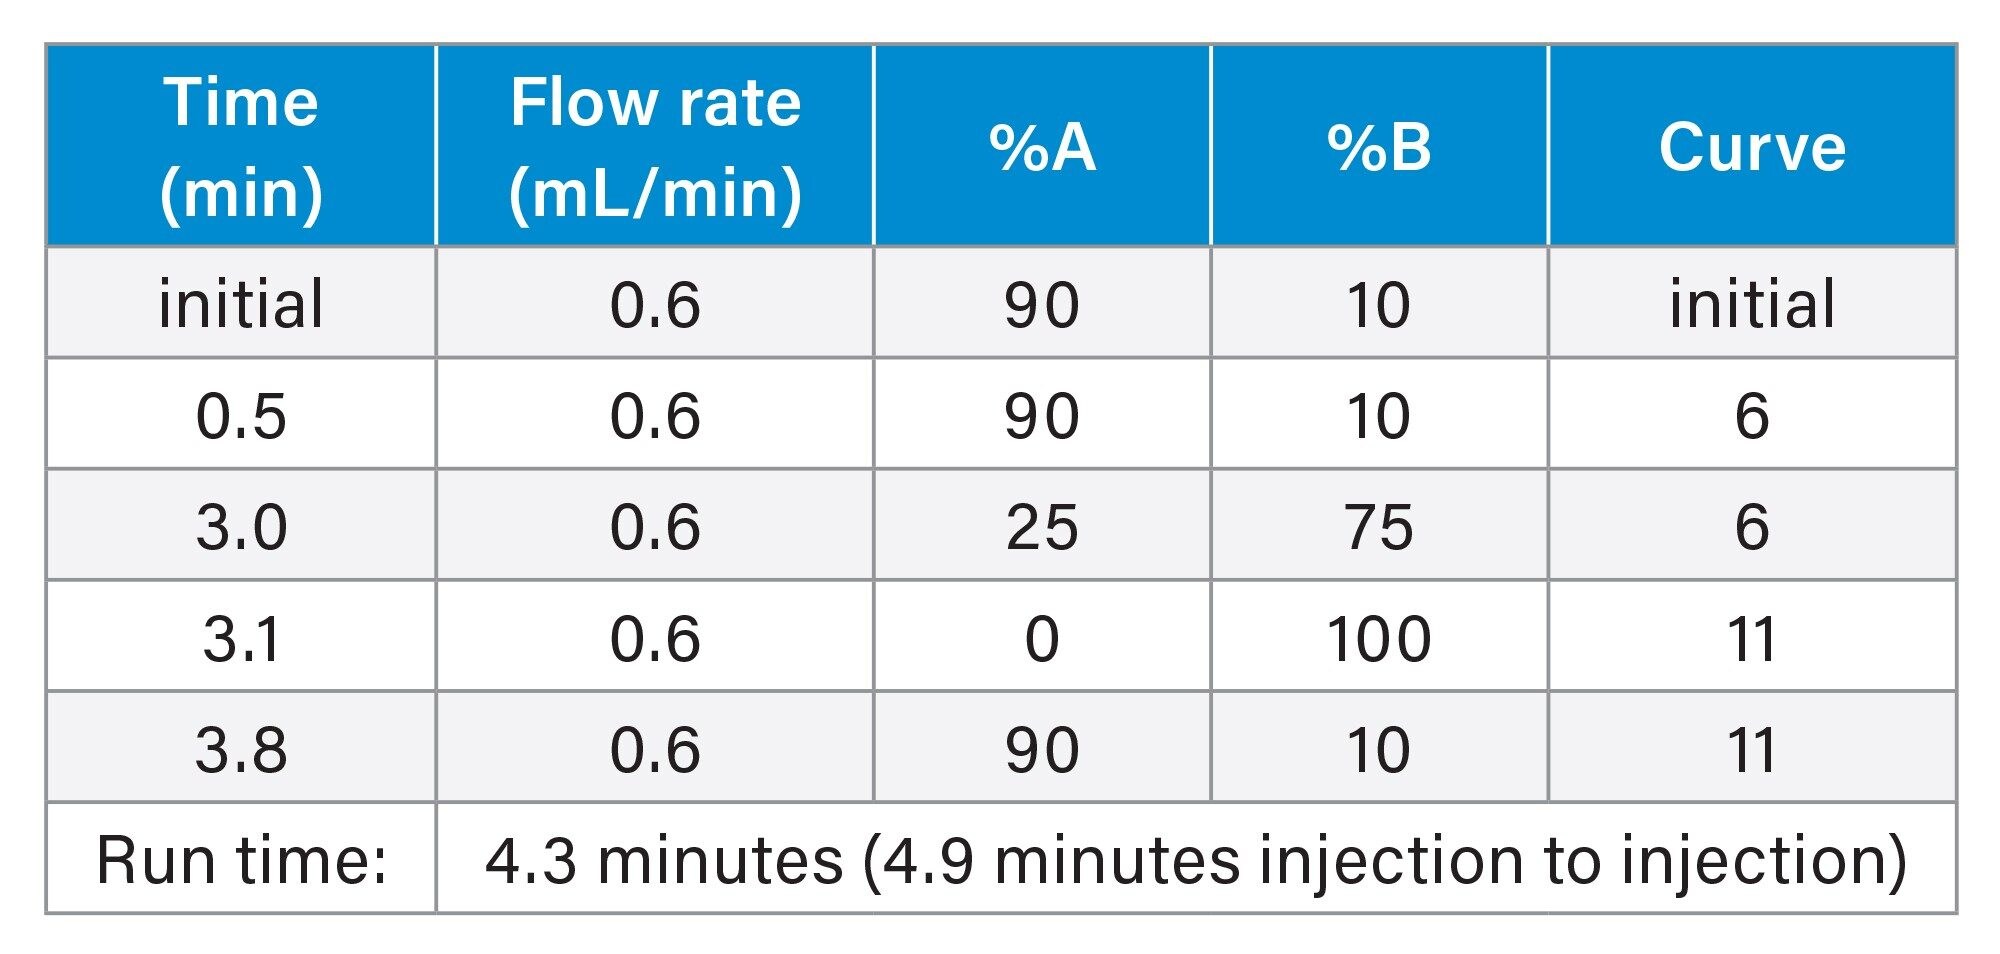
Flow rate: |
0.600 mL/min |
|
Mobile phase A: |
2 mM ammonium acetate in Water + 0.1% formic acid |
|
Mobile phase B: |
2 mM ammonium acetate in Methanol + 0.1% formic acid |
|
Seal wash: |
20% aqueous methanol |
|
Weak wash: |
5:95 (v:v) methanol:water |
|
Weak wash volume: |
2 mL |
|
Strong wash: |
25:25:25:25 (v:v:v:v) water:methanol:acetonitrile:2-propanol |
|
Strong wash volume: |
2 mL |
Gradient Table
MS Conditions
|
MS system: |
Xevo TQ-S micro Tandem Quadrupole Mass Spectrometer |
|
Resolution: |
MS1 (0.75 FWHM) MS2 (0.75 FWHM) |
|
Polarity: |
ESI+ ionization |
|
Acquisition mode: |
MRM (see Table 2 for details) |
|
Capillary voltage: |
0.5 V |
|
Desolvation temperature: |
650 °C |
|
Desolvation (L/Hr): |
1000 |
|
Cone (L/hr): |
0 |
|
MS Inter-scan: |
0.003 seconds |
|
Polarity/Mode switch inter-scan: |
0.015 seconds |
|
Inter-channel delay: |
0.002 seconds |
Data Management
|
Chromatography software: |
MassLynx Mass Spectrometry Software™ V4.2 (SCN1045) |
|
MS software: |
MassLynx Mass Spectrometry Software V4.2 (SCN1045) |
|
Informatics: |
TargetLynx™ |
Results and Discussion
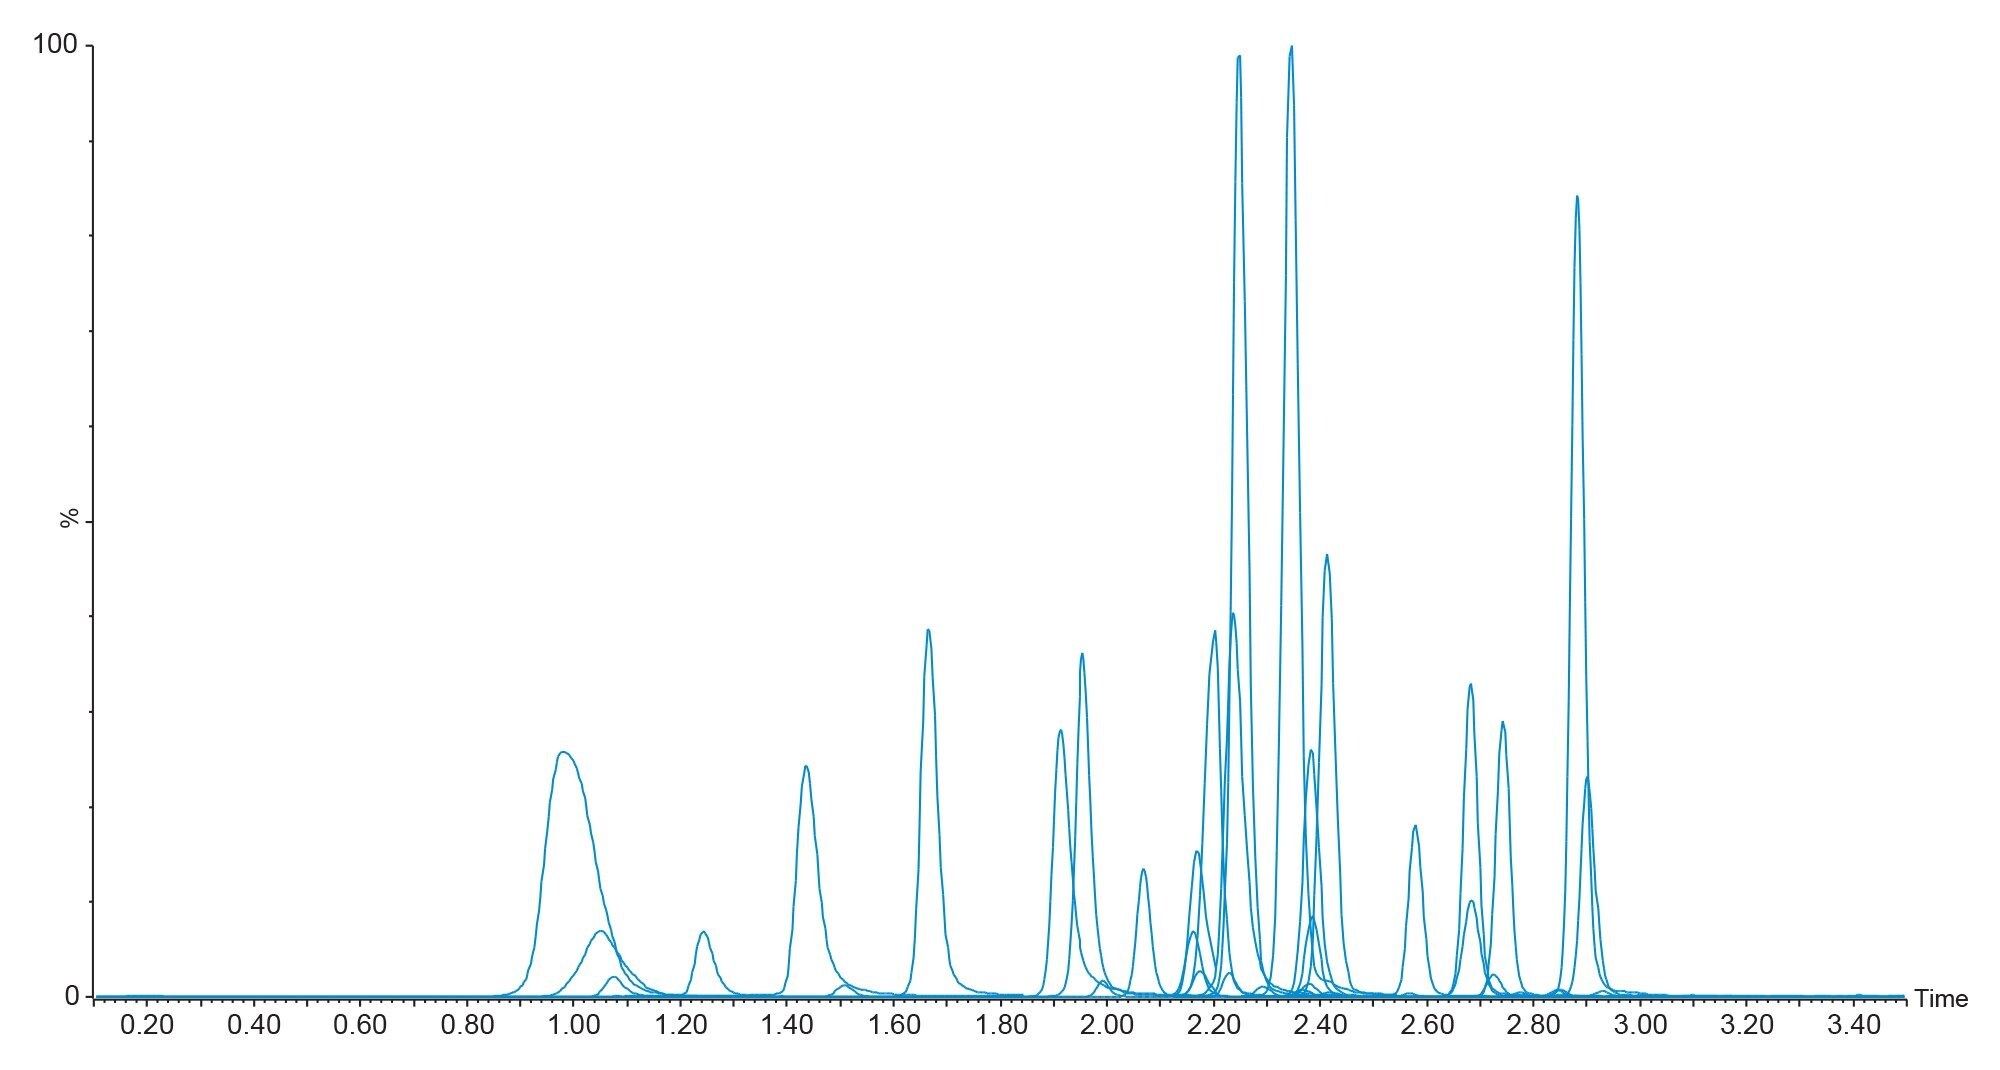
Method verification was performed through assessment of system carryover, functional sensitivity, linearity, extraction recovery, matrix effects, trueness, repeatability, intermediate precision, accuracy profiles, and autosampler stability. Figure 1 shows the chromatography of all 35 compounds included in the panel on the XSelect HSS C18 SB XP, 100 Å, 2.5 µm, 2.1 mm X 30 mm Column.
No significant system carryover (<25% Calibrator 1 mean peak area) was observed across all analytes following analysis of a plasma sample at twice the concentration of the high QC.
Functional sensitivity was assessed by extracting and quantifying 10 replicates of low concentration samples prepared in plasma over three days (n=30). Investigations indicated the method would allow for precise quantification (≤20% CV, ≤15% bias) at the defined LLMI (Lower Limit of the Measuring Interval) concentrations for each of the analytes.
Linear regression (1/x weighing) provided the best fit, with correlation coefficient (r2) higher than 0.99 for all analytes. Linearity of the method was also assessed by combining a high concentration pool, above the highest calibrator, with a blank plasma pool. The method was shown to be linear across nine concentration levels (n=4) when low and high pools were mixed in known ratios over the ranges of 1.44–240 ng/mL for Benperidol, Flupentixol, Fluphenazine, Haloperidol, Guanfacine, Iloperidone, Loxapine, Perphenazine, and Asenapin; over the ranges of 2.88–480 ng/mL for Bromperidol, Cariprazine and Zuclopenthixol; over the ranges of 14.4–2400 ng/mL for Brexpiprazole, Chlorprothixene, Norolanzapine, Levomepromazine, Melperone, Olanzapine, Perazine, Paliperidone (9-Hydroxyrisperidone), Prothipendyl, Risperidone, Sertindole, Ziprasidone, and Zotepine; over the ranges of 28.8–4800 ng/mL for Amisulpride, Chlorpromazine, Norquetiapine , Pipamperone, and Promethazine; over the ranges of 58.6–9600 ng/mL for Clozapine, Quetiapine, Sulpiride, Sulforidazine and Thioridazine. The allowable non-linearity at all levels for all compounds was less than 10% across the targeted linearity interval. All calculations for linearity assessment were performed using Analyse-it® Software.
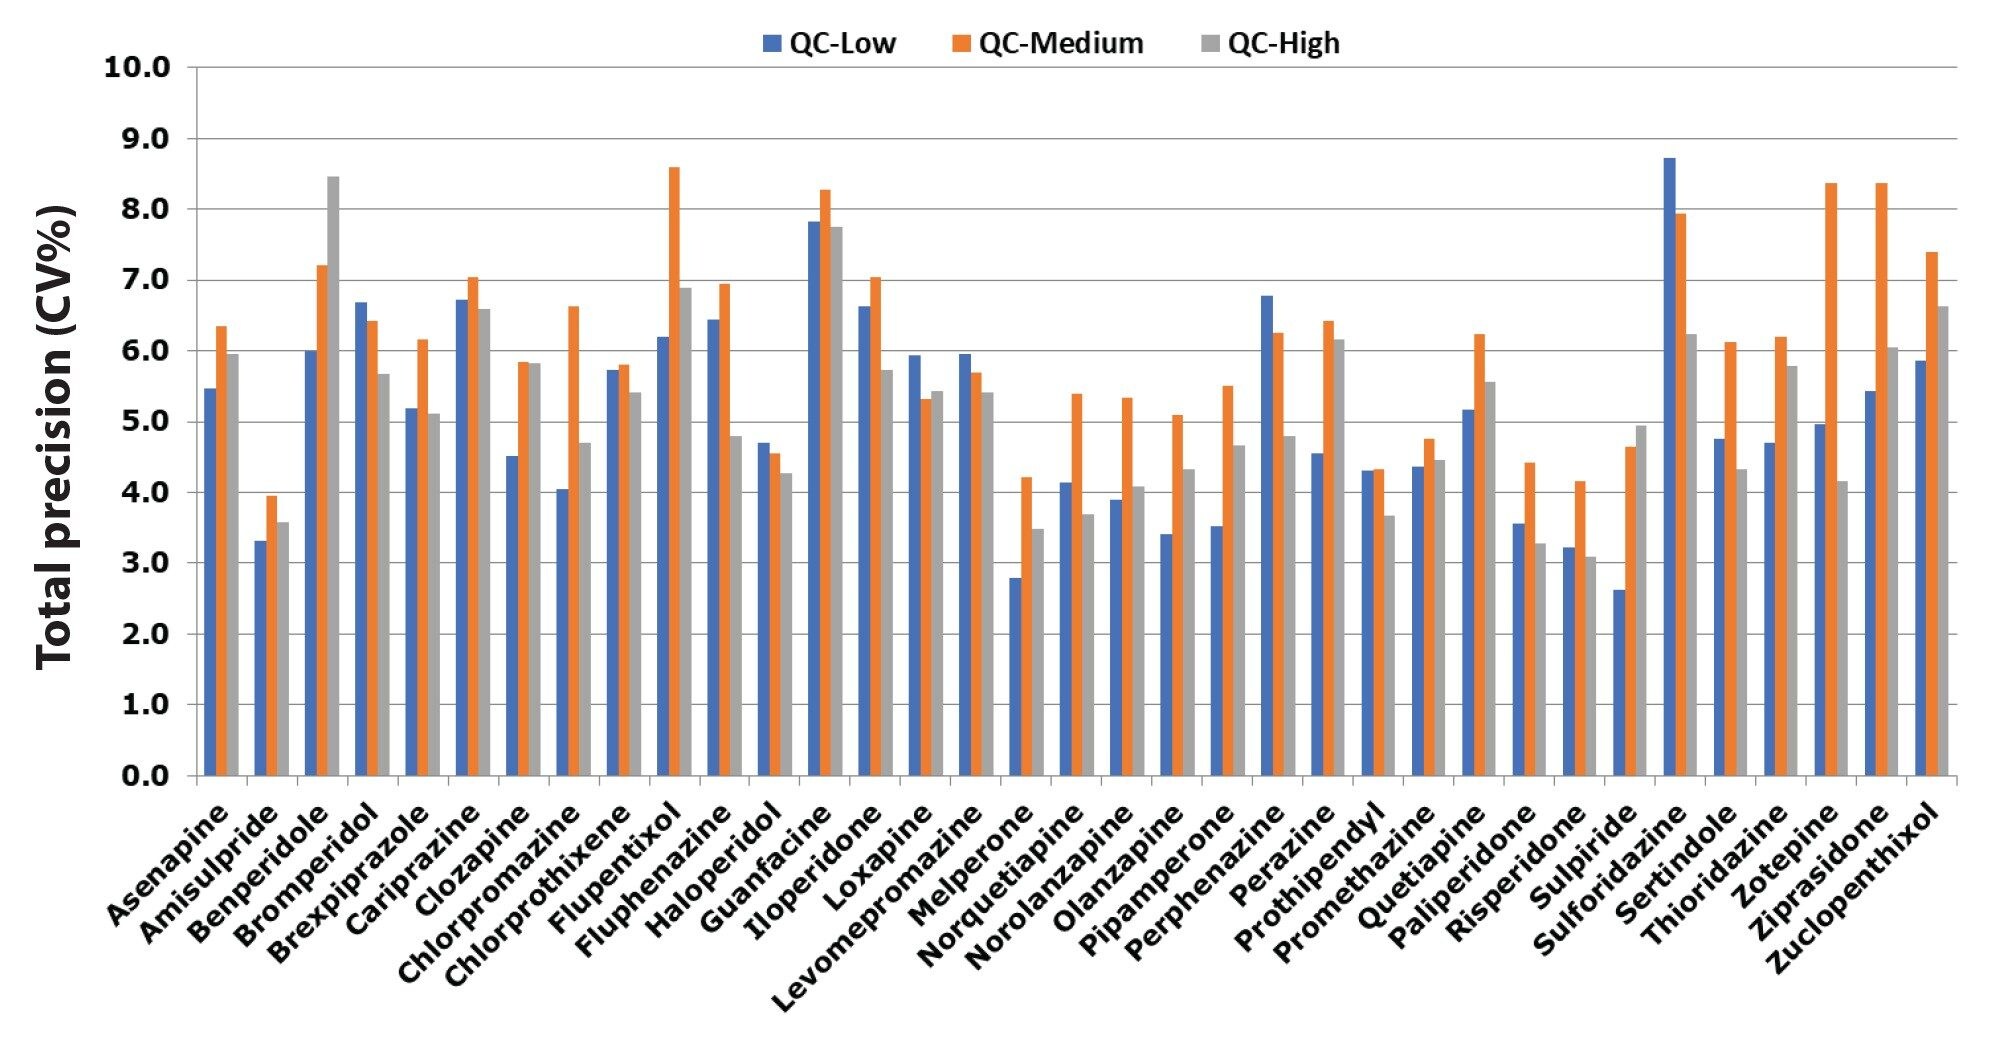
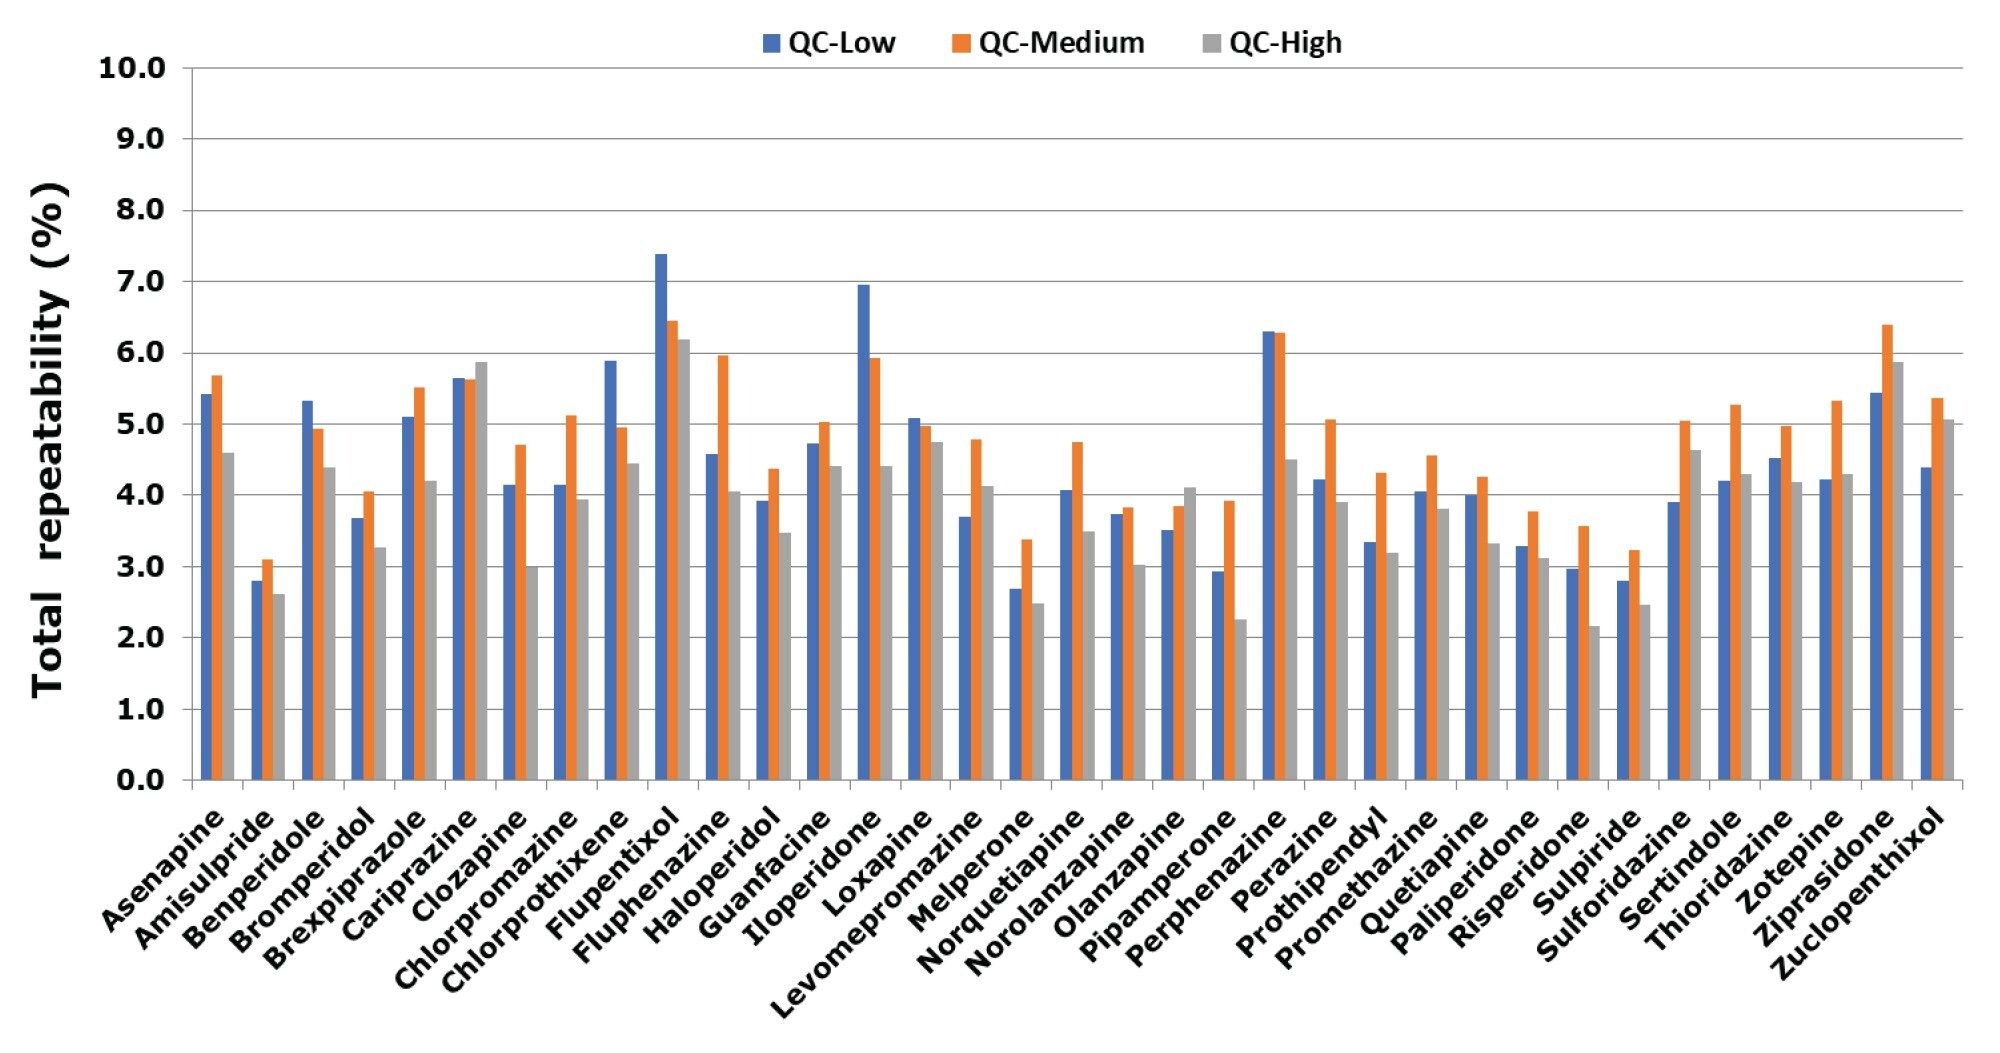
Total precision was determined by extracting and quantifying five replicates of three concentrations of plasma pools over five separate days (n=25). Repeatability was assessed by analyzing five replicates at each QC level. Total precision and repeatability at the three concentrations for all compounds were shown to be ≤8.7% CV and ≤7.4%, respectively. (see Figure 2 and Figure 3).
Normalized matrix effects were evaluated by spiking low and high QC concentrations in plasma of six individuals (n=6) post-extraction and comparing to solvent samples. Calculation using analyte:internal standard response ratio indicated compensation for signal enhancement or suppression by the internal standard. All ratios for normalized matrix effects ranged from 0.88 and 1.14.
Potential interference from endogenous compounds (albumin, bilirubin, cholesterol, creatinine, triglycerides, uric acid) spiked at high concentrations was assessed by determining the recovery (n=3) of the analytes from low and high QC plasma samples. Recoveries for the low QC ranged from 91.5–108.7% and high QC from 85.7–112.7% across all analytes.
Recoveries were evaluated at low and high QC concentrations in plasma of six individuals (n=6) taken as a percentage of extracted plasma samples. The overall mean recovery for each concentration all compounds were in the range of 85%–115%. The mean extraction efficiencies across the 35 analytes ranged from 52.2%–96.9%.
The 72 hours (5 °C ± 2 °C) onboard autosampler stability was demonstrated by batch re-analysis of samples (Calibrators, QCs, and Blanks). The determined concentrations of all QC samples were within ± 15% deviation of the original determination. Stabilities for QC-low ranged from 93.5–110.5% and QC-high from 97.1–106.6%, respectively.
Conclusion
A method for the LC-MS/MS analysis of 35 anti-psychotics drugs was developed for clinical research. A number of advantages are highlighted:
- The sample preparation and analysis were fast, simple, and inexpensive, requiring only 50 µL of plasma and taking less than five minutes per injection
- Total precision and repeatability were ≤8.7% CV and ≤7.4%, respectively
- The method demonstrated good recovery and extraction efficiency for each analyte with minimal matrix effects
References
- Wijesinghe R: A review of pharmacokinetic and pharmacodynamic interactions with antipsychotics. Ment Health Clin 2016, 6(1):21–27.
720008636, December 2024