• Applikationsbericht

Ultra-Low Level Analysis of Aldosterone in Plasma Using the Xevo TQ-XS for Clinical Research

Ultra-Low Level Analysis of Aldosterone in Plasma Using the Xevo TQ-XS for Clinical Research

  • Dominic Foley
  • Lisa J. Calton
  • Waters Corporation

For research use only. Not for use in diagnostic procedures.

Abstract

An analytically sensitive and selective clinical research method has been developed for the analysis of aldosterone in plasma using the Xevo TQ-XS Mass Spectrometer.

Benefits

  • Analytical selectivity of the chromatographic method provides separation of isobaric species 
  • LC-MS/MS enables high sample-throughput using multi-well plate automation
  •  Excellent agreement to EQAmean values for aldosterone

Introduction

Aldosterone is a mineralocorticoid steroid hormone that plays a central role in the regulation of blood pressure. Traditionally, aldosterone has been analyzed by radioimmunoassays. However, these methods involve the use of hazardous radioisotopes. In addition, they can suffer from a lack of specificity due to the cross reactivity of structurally similar steroid hormones and metabolites, which may result in greater imprecision and inaccuracy. To minimize specificity issues, radioimmunoassay methods employ time-consuming manual extraction protocols. LC-MS/MS combined with automation of the sample preparation with sample tracking capabilities provides an alternative means of aldosterone analysis for clinical research. An integrated workflow solution enables selective and analytically sensitive characterization of aldosterone with a reduction in sample handling time.

Here we describe a clinical research method utilizing Oasis MAX μElution Plate technology for the extraction of aldosterone from plasma, which has been automated on the Tecan Freedom Evo 100/4 Liquid Handler. Chromatographic separation was performed on an ACQUITY UPLC I-Class System using a CORTECS C18, 2.7 μm Column followed by detection on a Xevo TQ-XS Tandem Quadrupole Mass Spectrometer to enable quantification of very low physiological concentrations of aldosterone (Figure 1).

Figure 1. The Waters ACQUITY UPLC I-Class System and Xevo TQ-XS Mass Spectrometer.

Experimental

LC conditions

System:

ACQUITY UPLC I-Class (FTN) with Column Heater (CH)

Needle:

30 μL

Column:

CORTECS C18, 2.7 μm, 2.1 × 100 mm (p/n: 186007367)

Pre-column:

VanGuard Cartridge Holder (p/n: 186007949) with CORTECS C18 2.7 μm VanGuard Cartridge (p/n: 186007682)

Mobile phase A:

Water with 0.05 mM Ammonium Fluoride

Mobile phase B:

Methanol

Needle wash solvent:

Methanol

Wash time:

6 s

Purge solvent:

35% methanol(aq)

Column temp.:

45 °C

Injection volume:

25 μL

Flow rate:

See Table 1

Gradient:

See Table 1

Run time:

3.5 min

Table 1. Gradient table for the separation of aldosterone. Operating backpressure at the initial conditions was approximately 8000 psi.

MS conditions

System:

Xevo TQ-XS

Resolution:

MS1 (0.75 FWHM) MS2 (0.5 FWHM)

Acquisition mode:

Multiple Reaction Monitoring (MRM) (see Table 2 for details)

Polarity:

ESI-

Capillary:

2.75 kV

Source temp.:

150 °C

Desolvation temp.:

600 °C

Inter-scan delay:

Automatic

Inter-channel delay:

Automatic

Table 2. MRM parameters for aldosterone and its stable isotope labelled internal standard. Dwell times were set to automatic with 20 points across the peak over 6 seconds. Qualifier ion conditions are in parentheses. MS scan window was 1.5 to 2.8 minutes with the time period outside this diverted to waste.

Data management

MassLynx v4.2 Software with TargetLynx Application Manager

Sample preparation

Aldosterone certified reference solutions and aldosterone – 2H4 stable labelled internal standard were purchased from Sigma Aldrich (Poole, UK).

Calibrators were prepared in MSG4000 stripped serum (Golden West Biologicals, USA) and Quality Controls (QCs) were prepared in pooled human plasma (BioIVT, UK). Aldosterone calibrators were prepared over the range of 8–4162 pmol/L. QC concentrations were 36, 286, and 2932 pmol/L.

To convert SI units to conventional mass units, divide by 2.774 for aldosterone (pmol/L to pg/mL).

Sample extraction

Sample extraction was performed using a liquid handler. Samples were centrifuged at 4000 g for 5 minutes prior to extraction. To 200 μL of sample; 25 μL of internal standard solution (5550 pmol/L aldosterone-2H4), 200 μL 70/30 (v/v) methanol/0.1 M zinc sulfate, and 500 μL water were added, mixing after each reagent addition. Samples were centrifuged for 5 minutes at 4000 g.

An Oasis MAX μElution Plate (p/n: 186001829) was conditioned and equilibrated with 150 μL methanol and water, respectively. An aliquot of each of the pre-treated samples (600 μL) was loaded into individual wells and slowly pulled through the plate. Consecutive washes with 50 μL of *1% (v/v) formic acid in 10% (v/v) acetonitrile(aq) and 50 μL *1% (v/v) ammonia in 10% (v/v) acetonitrile(aq) were performed to reduce potential ionic interference. Analytes were eluted using 30 μL of 60% acetonitrile (aq), followed by the addition of 35 μL water. *Prepared weekly.

Results and Discussion

No significant interferences (recovery within ±15% bias) were observed at the retention time for aldosterone when other structurally related compounds with similar polarities were individually examined (cortisol, cortisone, 18-hydroxycorticosterone, corticosterone, 11-deoxycortisol, 21-deoxycortisol, prednisone, and prednisolone). No significant interference (recovery within ±15% bias) were observed when other endogenous compounds were examined (albumin, bilirubin, uric acid, intralipid, triglycerides, and cholesterol).

No significant system carryover (<20% of the lowest calibrator) was observed from high concentration samples into subsequent blank injections. A 1:5 dilution was successfully employed on high concentration samples, providing a mean accuracy of 100% for aldosterone with an RSD of 2.2%.

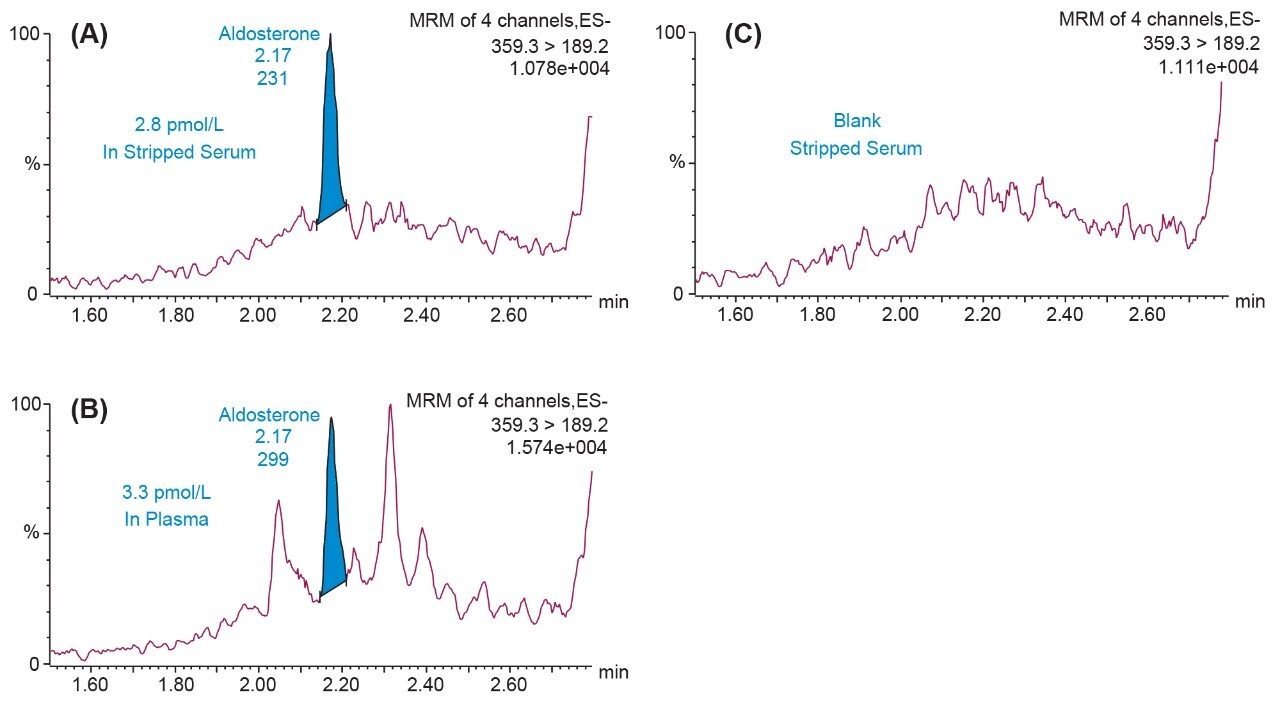
Analytical sensitivity investigations were performed using aldosterone spiked into stripped serum over four occasions across and below the calibration range (n = 40 at each concentration). The method would allow for precise quantification (<20% RSD) at 2.8 pmol/L for aldosterone. The S/N (PtP) was >10 at 8.3 pmol/L.

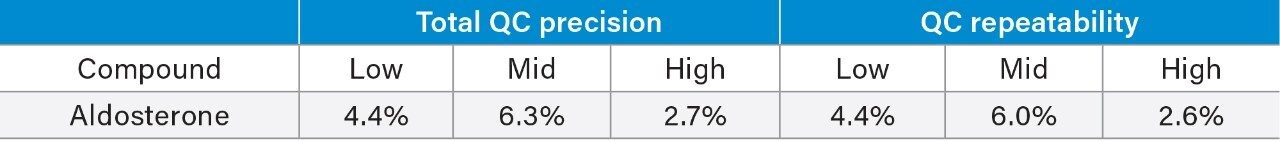
Total precision was determined by extracting and quantifying five replicates of three level QC material per day over five separate days (n = 25). Repeatability was assessed by analyzing five replicates at each QC level. Low, mid, and high concentrations were 36, 286, and 2932 pmol/L for aldosterone.

Table 3. Total precision and repeatability for the analysis of aldosterone.

The method was shown to be linear for aldosterone (6.7–4994 pmol/L) when different ratios of high and low concentration pools of the analytes were combined and analyzed. In addition, calibration lines in spiked stripped serum were linear with coefficient of determinations (r2) > 0.995 for all analyses.

Matrix effect investigations for aldosterone were performed using individual donor plasma samples (n = 6). The matrix factor calculated is shown in Table 4. Normalized matrix factor calculations, based on the analyte:internal standard response ratio, demonstrated that the internal standards compensated for any observed ion suppression.

Table 4. Mean (range) matrix factor and %RSD based on both peak area and analyte:internal standard response ratio.

Analytical bias was assessed for aldosterone through the analysis of EQA samples from UK NEQAS. The data obtained was compared to the mass spectrometry method mean for the samples and Deming regression was performed (Table 5). Altman-Bland agreement for aldosterone demonstrated a mean method bias was -3.3%, demonstrating excellent agreement with the EQA mass-spectrometry method mean for aldosterone (Figure 2).

Table 5. Deming regression comparing the Waters LC-MS/MS method to the EQA scheme MS method for aldosterone. P values <0.05 would indicate statistically significant bias.
Figure 2. Altman-Bland agreement comparing the Waters LC-MS/MS method to the EQA scheme MS method mean for aldosterone.

Evaluation of low concentration plasma samples was performed to assess analytical sensitivity and selectivity in unadulterated samples compared to spiked samples in stripped serum used for calibration. Figure 3 provides an illustration of the analytical sensitivity of the method, demonstrating the capability of detecting peaks of aldosterone at 3.3 pmol/L (1.2 pg/mL) in plasma and 2.8 pmol/L (1 pg/mL) in stripped serum.

Figure 3. Comparison of a 2.8 pmol/L (1 pg/mL) stripped serum sample (A), a 3.3 pmol/L (1.2 pg/mL) plasma sample (B), and a blank stripped serum sample (C).

Method robustness was evaluated through the consecutive analysis of 672 extracted plasma samples over 48 hours. Figure 4 shows there is minimal change in column backpressure, with a 380 psi increase over the course of analysis (Mean = 8247 psi, RSD = 1.3%), with minimal deviation in aldosterone peak area (Mean = 6122, RSD = 3.6%), demonstrating a highly robust method for the analysis of aldosterone.

Figure 4. Column backpressure and aldosterone peak area evaluation of 672 consecutive injections of extracted plasma over 48 hours.

Conclusion

An analytically sensitive and selective clinical research method has been developed for the analysis of aldosterone in plasma using the Xevo TQ-XS Mass Spectrometer.

The Xevo TQ-XS enables the analysis of physiologically low levels down to 8 pmol/L of aldosterone while only using 200 μL sample volume. Excellent levels of precision across the calibration range have been demonstrated. Accuracy assessment using EQA samples has shown the method provides excellent agreement for aldosterone. Automation of the analytical method in combination with sample tracking capabilities of the liquid handler, using the Tecan File Converter and MassLynx LIMS Interface, improves laboratory workflow and reduces sample handling, which alleviates the potential for operator error.

Acknowledgements

We would like to thank Professor Brian Keevil and colleagues at Wythenshawe Hospital for providing samples for evaluation purposes.

720006677, September 2019

Zurück zum Seitenanfang Zurück zum Seitenanfang