• Applikationsbericht

LipidQuan Method Reference Guide: Analysis of Lipids in Plasma and Serum Samples by LC-MS/MS

LipidQuan Method Reference Guide: Analysis of Lipids in Plasma and Serum Samples by LC-MS/MS

  • Nyasha Munjoma
  • Andrew Peck
  • Lisa Thorne
  • Giorgis Isaac
  • Waters Corporation

For research use only. Not for use in diagnostic procedures.

Abstract

This reference guide provides recommended step-by-step instructions for sample preparation followed by HILIC chromatography of human plasma/serum samples for semi-quantitative lipid analysis. 

1. Purpose

The purpose of this analysis document is to provide Waters recommended step-by-step instructions for sample preparation followed by HILIC chromatography of human plasma/serum samples for semi-quantitative large cohort lipid analysis. This document includes: details of sample preparation/extraction using IPA, mobile phase buffer preparation, and UPLC-MS/MS analysis of the samples.

2. Scope

This document contains Waters recommendations for:

  • Internal standard preparation
  • Standard curve preparation
  • Quality control sample preparation
  • Human plasma/serum sample preparation for large cohort lipidomics studies
  • Sample analysis by LC-MS/MS

3. Notes

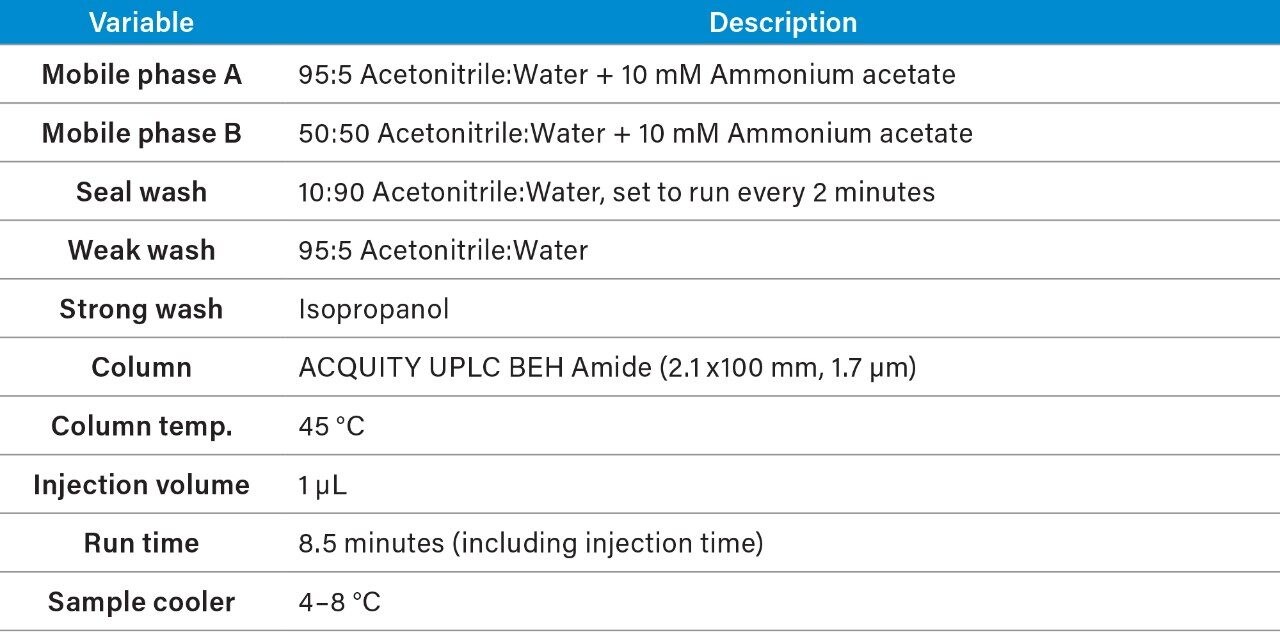
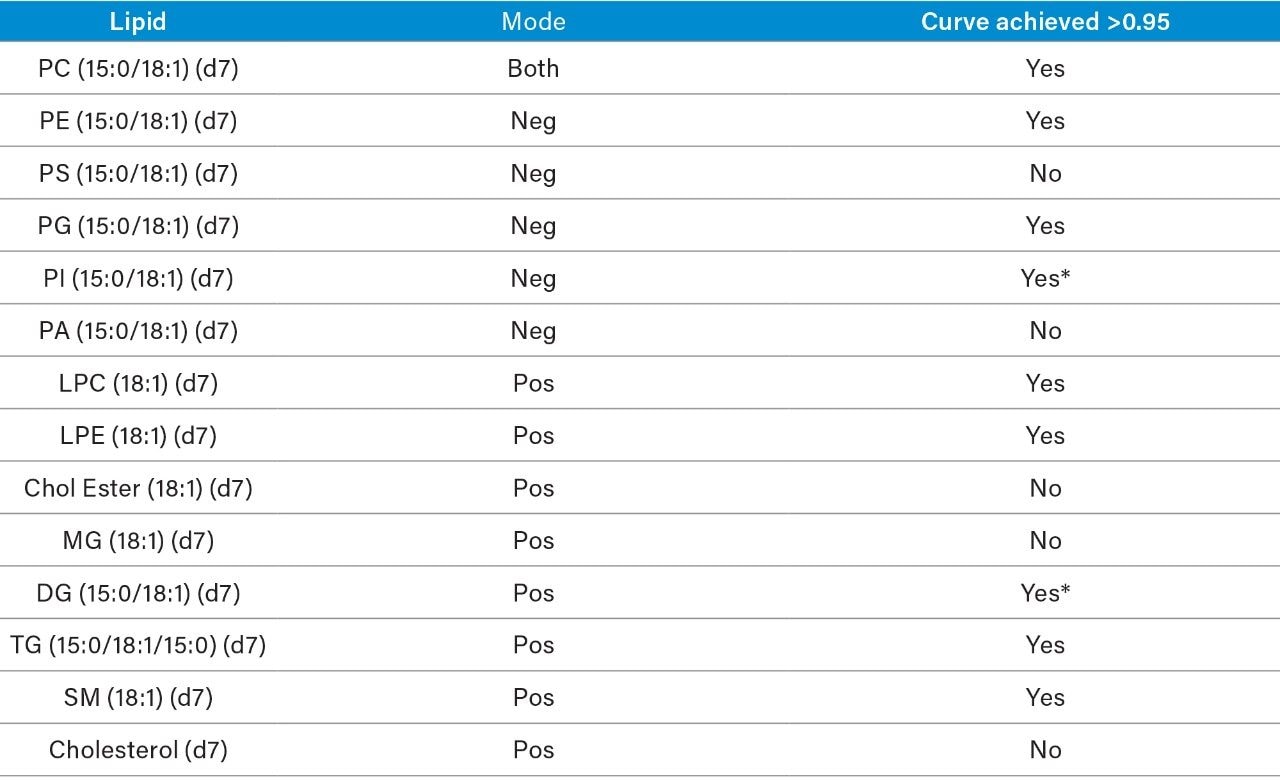
The following method conditions are suitable for the semi-quantification of (polar lipids) phospholipids and ceramides. Non-polar lipids (MG, DG, TG, Cholesterol, Cholesterol Esters, etc.) elute in the solvent front using these conditions and therefore concentration values obtained are for monitoring only and should not be deemed quantitative with this method. Although Free Fatty Acids (negative mode) elute close to the solvent front it is still possible to semi-quantify this class using these conditions. 

The LipidQuan MS methods, LC methods, and TargetLynx processing method packages are available for download from the Waters website at www.waters.com/TargetedOmics.

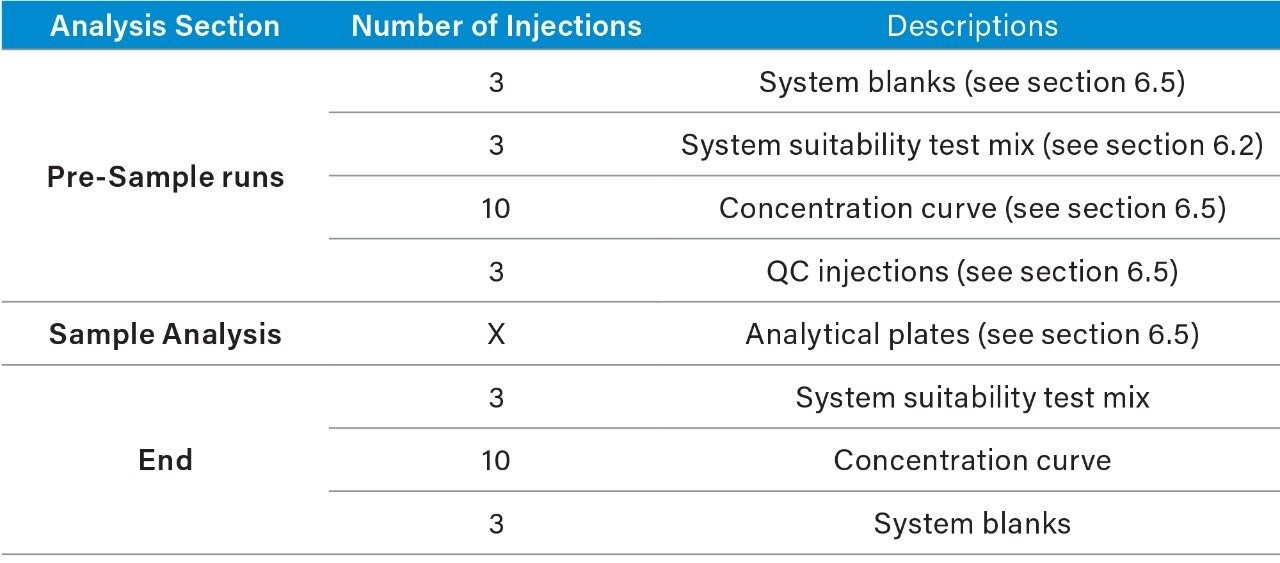
A project batch should not consist of more than 1500 biological samples. Calibration curves will be run at the beginning and end of each batch. If the cohorts are large, then it is advisable to run calibration curves at points throughout the analysis to ensure bracketed data is available that will allow to adjust any drift within the run or to flag any analysis failure.

Prior to sample analysis, blanks and quality controls (QC) injections are performed to demonstrate that the instrument is stable and that results are consistent prior to running valuable biological samples. Ensuring that the instrument is stable prior to sample analysis will also help to maintain consistency between the runs.

In addition to running blanks and QCs prior to the start of analytical runs, QC samples are acquired throughout the analytical run; these intra-run QCs will assist with determining analysis stability and data suitability. These frequent injections allow for instrument changes to be monitored. They can also be used to indicate injection suitability prior to, or post, any instrument issues that result in an analysis stoppage.1

4. Abbreviations

CAN

Acetonitrile

Cer

Ceramide

CE

Cholesteryl Ester

CL

Cardiolipin

DG

Diacylglycerol

DAG

Diacylglycerol

FA

Fatty acyls

FFA

Free Fatty Acid

GLs

Glycerolipids

GPs

Glycerophospholipids

IPA

Isopropanol (2-Propanol)

LPC

Lysophosphatidylcholine

MG

Monoacylglycerols

PA

Phosphatidic acid

PC

Phosphatidylcholine

PE

Phosphatidylethanolamine

PG

Phosphatidylglycerols

PI

Phosphatidylinositols

PLs

Phospholipids

PS

Phosphatidylserine

QC

Quality Control

RSD

Relative standard deviation

RT

Retention time

SIL

Stable isotope labelled

SP

Sphingolipids

SM

Sphingomyelin

TG

Triacylglycerol

TAG

Triacylglycerol

5. Materials and equipment

5.1 Equipment

  • Pipettes and tips (1000 μL, 200 μL, and 10 μL minimum requirement)
  • Fume hood
  • Centrifuge
  • Waters Xevo TQ-S, Xevo TQ-XS, or Xevo TQ-S micro Mass Spectrometer (Xevo TQ-XS recommended)
  • Waters UPLC System (ACQUITY UPLC I-Class Flow Through Needle (recommended) or Fixed Loop)
  • 1.5 mL microcentrifuge (Eppendorf) tubes or 1 mL 96-well plate for extractions (p/n 186002481)
  • Total recovery vials (p/n 186002805) or 1 mL 96-well analytical plates (p/n 186002481)
  • Pre-slit PTFE/Silicone Cap Mat for 96-well (p/n 186006332)
  • Temperature controlled mixer

5.2 Materials for sample preparation

  • Avanti SPLASH LIPIDOMIX lipid standards
  • Isopropanol (LC-MS grade)

5.3 Materials for UPLC-MS/MS analysis

  • Water (LC-MS grade or 18.2 MΩ Milli-Q)
  • Acetonitrile (LC-MS grade)
  • Formic acid (LC-MS grade)
  • Isopropanol (LC-MS grade)
  • Ammonium acetate (LC eluent grade)
  • ACQUITY UPLC BEH Amide Column, 130Å, 1.7 μm, 2.1 mm x 100 mm, 1/pkg (p/n 186004801)

6. Standards and sample preparation

6.1 Standard spiking mix preparation

  1. Remove a vial of Avanti SPLASH LIPIDOMIX from the freezer and allow it to equilibrate at room temperature (a minimum of 20 minutes).
  2. Prepare spiking solutions 1, 2, and 3 (10x, 50x, and 100x dilution of SPLASH LIPIDOMIX standards respectively). Please see Table 1 below for resulting concentrations.
  3. Spiking solution 1: dilute 100 μL of SPLASH LIPIDOMIX into 900 μL of IPA.
  4. Spiking solution 2: dilute 20 μL of SPLASH LIPIDOMIX 980 μL of IPA.
  5. Spiking solution 3: dilute 10 μL of SPLASH LIPIDOMIX into 990 μL of IPA.

These volumes can be scaled up or down, ensure that whenever preparing the calibration curve and QCs that the total volume v/v of SPLASH LIPIDOMIX is no more than 5% at any time.

Table 1. Spiking Solution Preparation using SPLASH LIPIDOMIX
*Please note these concentrations may vary depending upon the original concentration of the SPLASH LIPIDOMIX, please check the provided certificate of analysis for true values.

6. Vortex mix each solution for 15 seconds to ensure homogeneity.

7. The spiking solutions may be stored at -20°C (±5°C) for up to 6 months.

6.2 System suitability test mix

1. Transfer 20 μL of spiking solution 2 (Table 1) into suitable glass HPLC vials.

2. Dilute with 480 μL of IPA (chilled to 4–8 °C).

3. Vortex mix for 15 seconds to ensure the solution is homogenous.

6.3 System blank

4. System blank should be a vial of IPA (chilled to 4–8 °C).

5. This must be prepared as described in section 6.5.

6.4 Calibrant, QC, and Matrix Blank Sample Preparation

A pool composed of an aliquot from every sample to be analyzed should be prepared. To calculate the amount of sample to remove from each sample for the pool, divide the number of samples by the total pool required (#samples/pool = µL/sample to be removed). The pooled samples will be representative of all the samples in the study and will be combined with the standards mix to form the QCs and the calibration curve standards. Pooled plasma can be aliquoted to microcentrifuge tubes (6.5.2) and stored at -80 °C a day prior to the analysis. At least one aliquot of blank matrix should be prepared from the pooled samples; the blank matrix includes the QCs but not the calibrants (Table 2).

  1. Remove the pooled plasma from the freezer and allow it to equilibrate at room temperature for 1 hour (±10 minutes) prior to use.
  2. Prepare the calibration curve using the solutions prepared in 6.1 and the pooled samples. Use the volumes as described below in Table 2.
Table 2. Calibration Curve Preparation.
*These volumes can be scaled up if more aliquots are required, it is NOT advised to pipette  volumes smaller than 5 µL due to the higher potential for pipetting inaccuracies.

3. The resulting concentrations for the curve are listed below in Table 3.

Table 3. Resulting Individual SPLASH LIPIDOMIX Calibration Curve Concentrations.

4. Prepare the QC samples using the standards solutions mix prepared in 6.1 and the pooled sample volumes as described below in Table 4. High (HQC), Middle (MQC), and Low (LQC) QC samples should be prepared at 80%, 8%, and 1.275% of the highest concentration of the calibration curve.

Table 4. Suggested QC Concentration Values.

5. The resulting concentrations for the curve are listed below in Table 5.

Table 5. Individual SPLASH LIPIDOMIX QC Concentrations.

6.5 Extraction and protein precipitation

A simple protein precipitation sample preparation procedure should be used with pre-cooled isopropanol (IPA).2

Extraction of calibrants, QCs, blank IPA, pool, and test samples should follow the same conditions to ensure uniformity.

  1. Allow calibrants (6.4), QCs (6.4), blank pool (matrix blank) (6.4), and test samples to equilibrate at 4–8 °C for 1 hour prior to preparation.
  2. Pipette 50 μL aliquots of the calibrants, QCs, blank pool (IPA), pooled plasma, and test samples to 1.5 mL microcentrifuge tubes (or 1 mL 96-well plates).
  3. Add 250 μL of IPA (chilled to 4–8 °C).
  4. If your sample volume is limited, then these volumes can be reduced as long as the ratio of 1:5 (sample:IPA) is maintained. However, do not let the plasma sample fall below 10 μL as it may be challenging to detect and quantify the low abundant lipid species.
  5. Vortex mix for 30 seconds.
  6. Incubate the mixture at 2–8 °C for 2 hours with agitation using a temperature-controlled shaker (preferred) to ensure complete protein precipitation. (If shaker has no temperature control, remove sample from fridge and shake for 5 minutes every 30 minutes before returning to 2–8 °C).
  7. Centrifuge at 10,300 g for 10 minutes at 4 °C.
  8. Carefully transfer 250 μL of each supernant to vials (110 μL to each vial if separate vials or 96-well plates are required for positive and negative mode). The recommend acquisition list is shown in section 9.

7. Mobile phase preparation

Purge UPLC solvent lines for a minimum of 2 minutes when new mobile phases or solvents are added.

7.1 Mobile phase A

95:5 Acetonitrile:Water, 10 mM Ammonium acetate

  1. Accurately measure out 50 mL of LC-MS grade water into a 1 L Duran bottle.
  2. Add 0.77 g (+/-0.01 g) of ammonium acetate to the water and mix for about 2 minutes until dissolved.
  3. Accurately measure 950 mL of LC-MS grade ACN, and slowly add to the ammonium acetate solution, while swirling to ensure good mixing.
  4. The solution may become ‘cloudy’; sonicate for 10 minutes to ensure proper dissolution and mixing.

7.2 Mobile phase B

50:50 Acetonitrile:Water, 10 mM Ammonium acetate

  1. Accurately measure out 500 mL of LC-MS grade water into a 1 L Duran bottle.
  2. Add 0.77 g (+/-0.01 g) of ammonium acetate to the water and mix for 2 minutes until dissolved.
  3. Accurately measure out 500 mL of LC-MS grade ACN and slowly add to the ammonium acetate solution, while swirling to ensure good mixing.
  4. Sonicate for 10 minutes to ensure complete dissolution and mixing.

Scale up as necessary. It is recommended to prepare ALL required analysis mobile phases in one large batch and aliquot into suitable quantities. It is best practice to use a single batch of all solvents and additives during the entire study. This will minimize batch differences seen through the analysis.

7.3 Wash solutions

9.3.1 Seal Wash

10% acetonitrile in water

1. Measure 900 mL of water.

2. Top up bottle with 100 mL with acetonitrile.


9.3.2 Weak wash (FL)

95:5 (v/v) Acetonitrile:Water

1. Measure 50 mL of water.

2. Top up bottle with 950 mL with acetonitrile.


9.3.3 Strong wash (FL), Needle Wash and Purge (FTN)

100% isopropanol

8. Instrument set-up

8.1 UPLC System set-up

Table 6. UPLC System Set-up.

8.2 UPLC Gradient

Table 7. UPLC Gradient.

8.3 MS Source Settings

Table 8. MS Source Settings.

8.4 Inlet and MRM method

The LipidQuan MS and LC (contained in the LipidQuan Quanpedia file) settings as well as the TargetLynx processing files are available for download from the Waters website at www.waters.com/targetedOmics.

  1. Please use the Quanpedia files or MS methods provided for transitions.
  2. Please ensure that the transition windows are 30 seconds.
  3. Please ensure that the dwell time is not below 0.08 seconds for any transition or the signal will be compromised, and quantitation may be less accurate.

8.5 Pre-analysis checks

  1. Ensure the cone is clean (See Waters video for guide on cleaning the cone).3
  2. Using the Console: Perform leak tests for all pumps.
  3. Using the system suitability test mix (6.2), check that all peaks can be seen, check for any retention time shifts, and update the MS method if required.

8.6 Sample acquisition

  1. The run is now ready to begin.
  2. During the run, it is advised that you process the calibration curve and check QCs periodically to ensure the run is progressing correctly.

9. Acquisition

1. Suggested analysis running order*:

Table 9. Suggested Analysis Running Order.
*It is recommended that no more than 1500 samples are injected continuously. The instrument should be cleaned and checked between each set of 1500 samples. Every injection from row 12 on your plate will be a QC.

2. System blanks and suitability test mix should be checked prior to continued acquisition. In order to ensure the system is functioning as expected.

3. Should the analysis halt for any reason and the analysis session requires a restart, the analyst should assess the previous analysis. The subsequent course of action will be down to operator discretion.

—Should the issue have impacted multiple injections it may be necessary to re-prepare the affected plate and re-analyze.

—If the issue has not impacted previously injected samples then it is possible to re-start the analysis continuing sample analysis from the last injection. Once the system is operational, the operator must inject a new concentration curve to bracket the new analysis set. The initial set may need to be processed with only a single calibration curve.

10. Quality control

10.1 Curve linearity

  1. The curve of each lipid within the SPLASH LIPIDOMIX should be assessed and is deemed acceptable if the R2 value is >0.95 with no more than 20% of the points being removed as outliers.
  2. The following table shows the lipids from the SPLASH LIPIDOMIX indicating whether they pass the curve acceptance criteria using this method, and in which mode they are analyzed.
Table 10. List of Standards that Meet the Quantification Criteria and Those Suitable for Monitoring.
* These compounds require the deletion of cal points 6, 7, 8, and 9 as they are below LLOQ.

10.2 Quality control injections

  1. The quality control (QC) injections are deemed acceptable if they fall within ±30% from the absolute concentration. The absolute concentration is the value of calibration point 1 (the highest level in the curve).
  2. The assay is deemed acceptable if >67% of the quality control injections pass the above criteria.

References

  1. Broadhurst D, Goodacre R, Reinke SN, Kuligowski J, Wilson ID, Lewis MR, Dunn WB. Metabolomics. 14(6):72.2018.
  2. Magali H. Sarafian, Mathieu Gaudin, Matthew R. Lewis, Francois-Pierre Martin, Elaine Holmes, Jeremy K. Nicholson, and Marc-Emmanuel Dumas. Anal. Chem.86 (12):5766–5774.2014.
  3. http://videos.waters.com/detail/video/5235769453001/cleaning-the-sample-cone-and-gas-cone

720006541, July 2019

Zurück zum Seitenanfang Zurück zum Seitenanfang