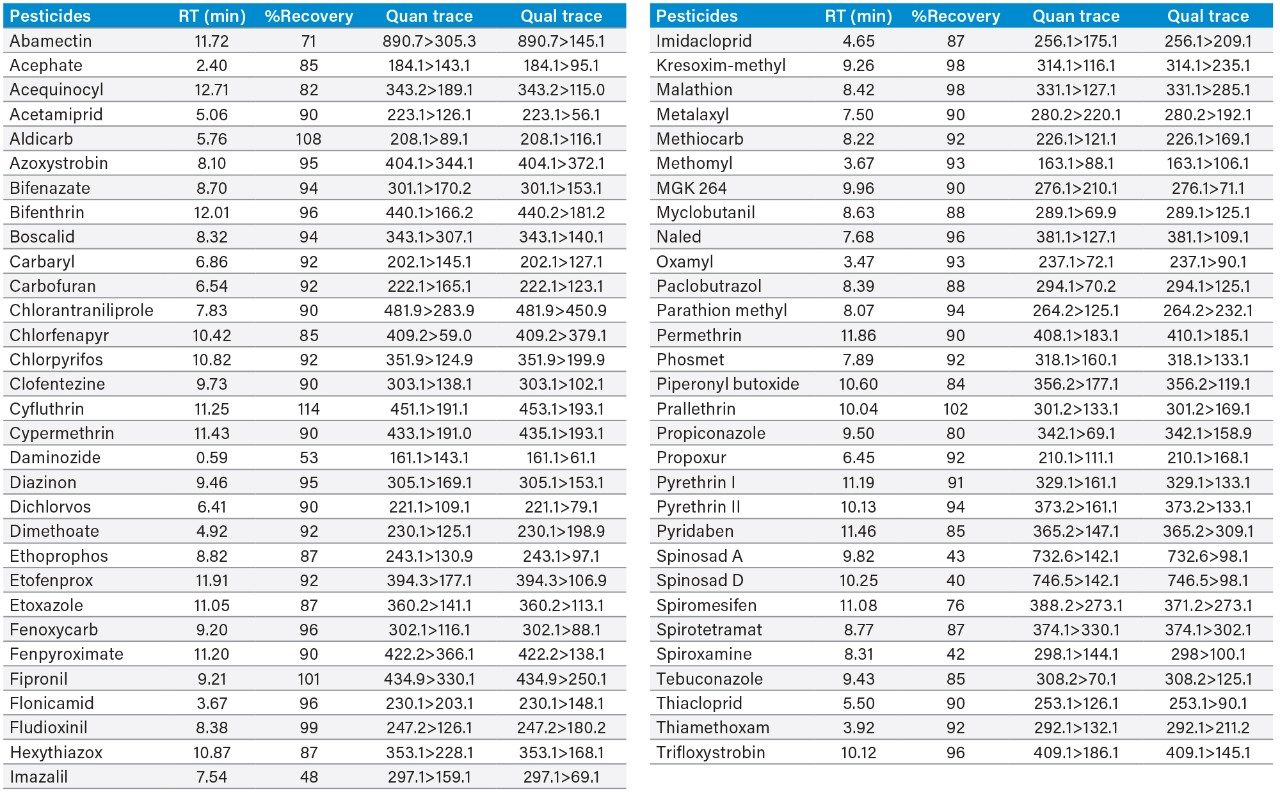
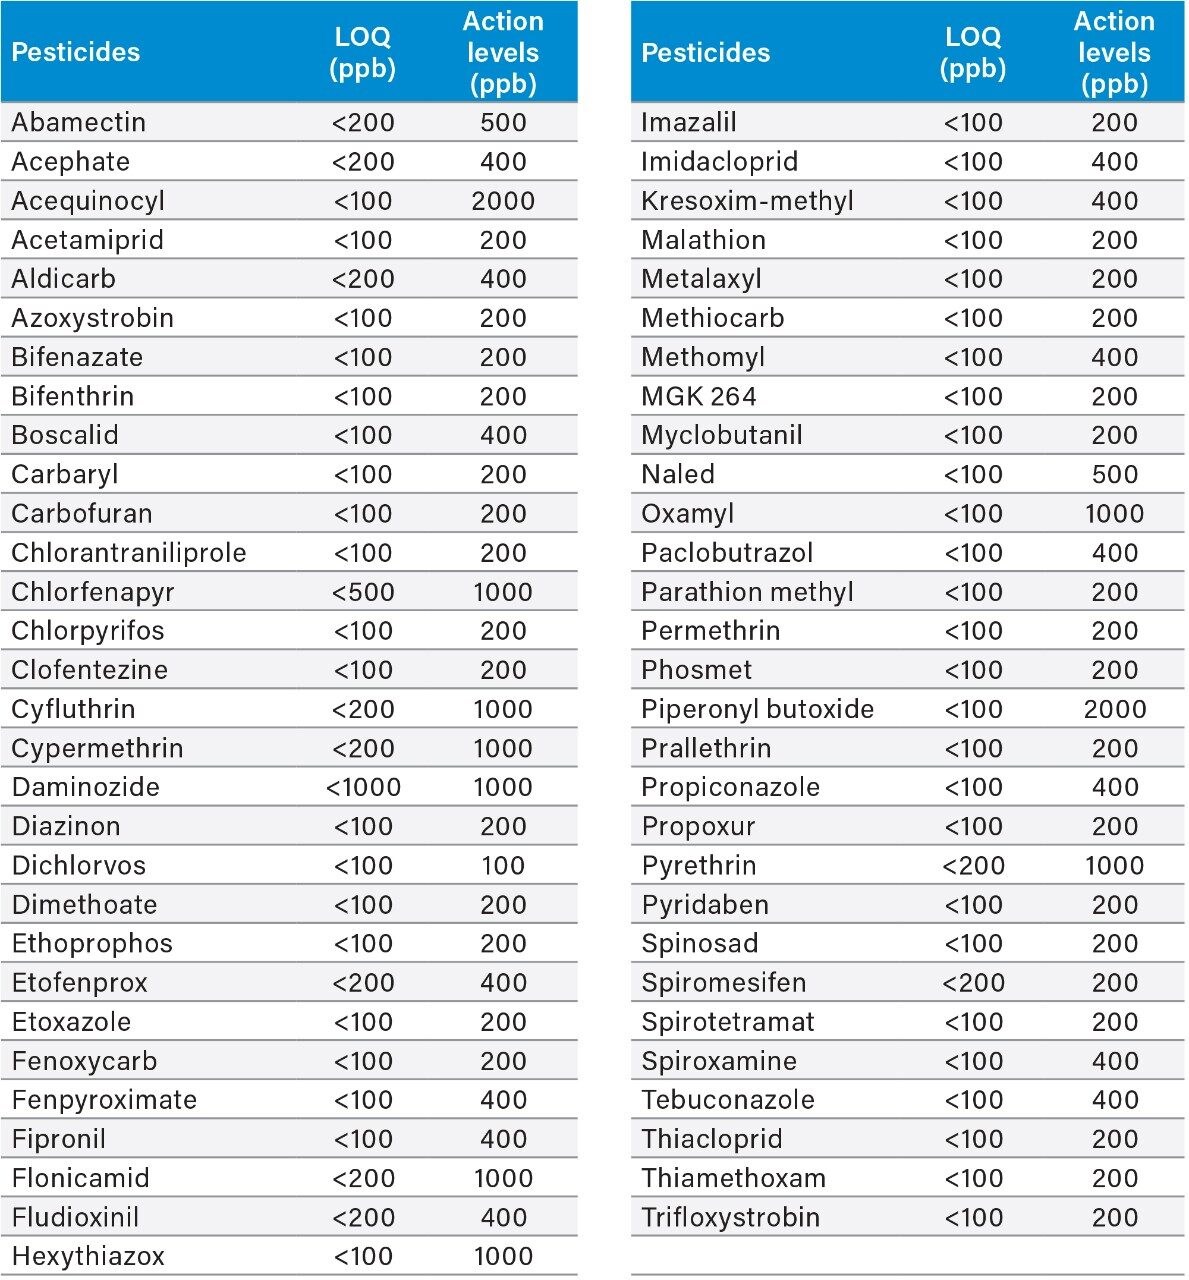
The increased use of both medical and recreational cannabis in combination with its expanding legal acceptance in most US states1 has led to rigorous cannabis safety and quality control testing. Pesticides are widely used in the cultivation of cannabis plants to safeguard against harmful insects and to promote better crop yields. The application of pesticides is regulated,2 and their residues in cannabis products are closely monitored by state regulatory agencies. The number of pesticides and their action limits varies from state to state. In Oregon, 59 pesticides are monitored with action limits ranging from 100 to 2000 ppb. Therefore adopting a robust and rapid procedure for monitoring the Oregon pesticide list in cannabis products is critical.
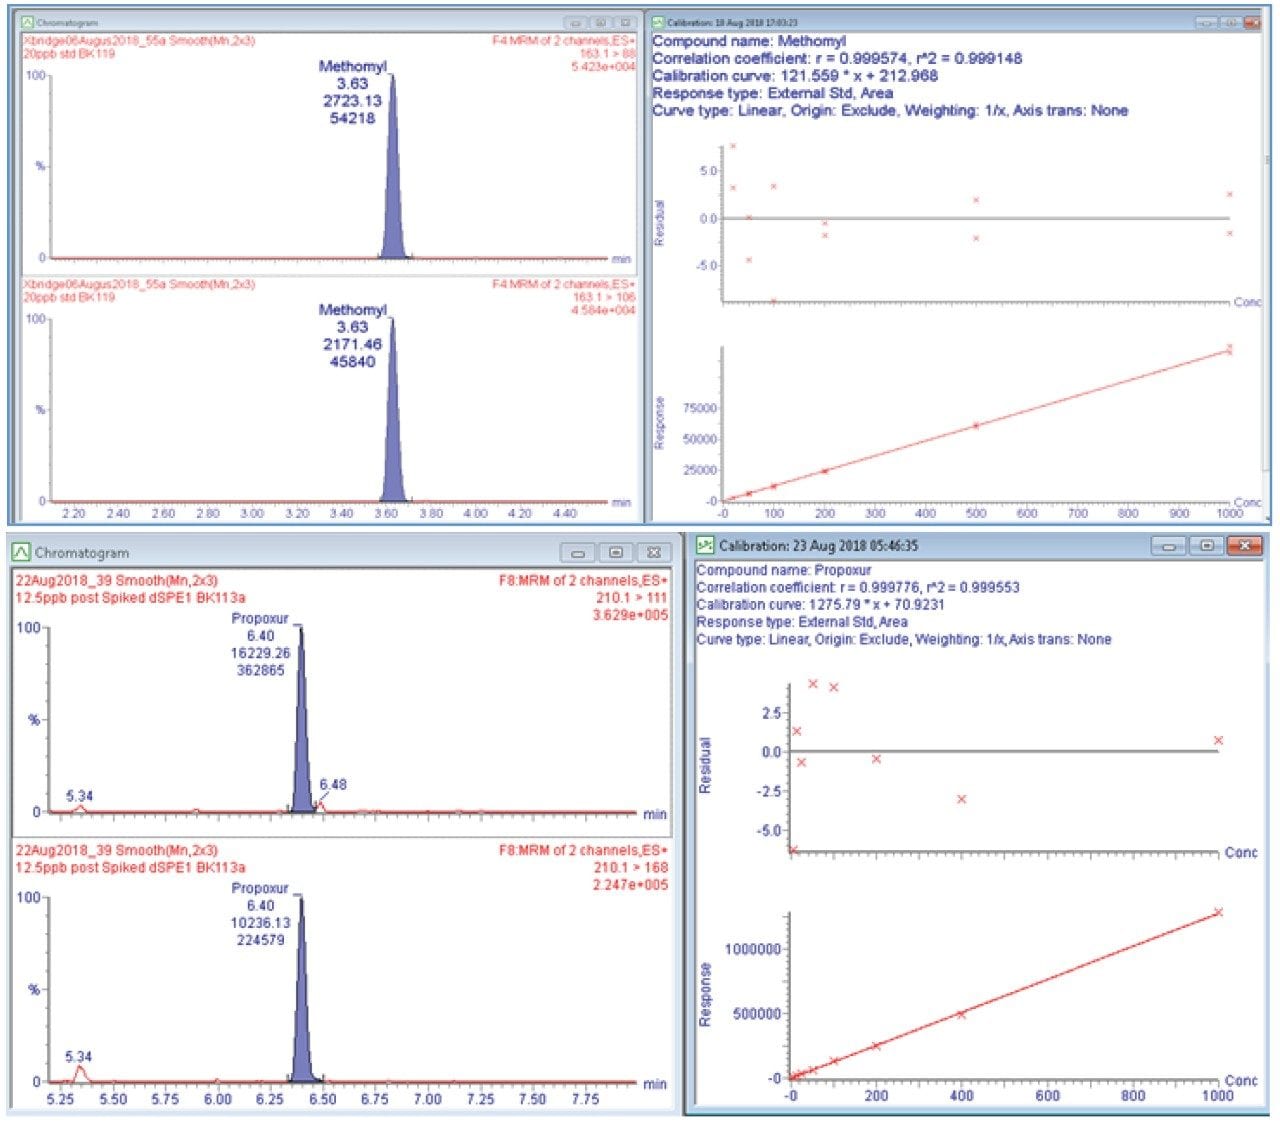
Multi-residue pesticide detection is routinely performed using tandem quadrupole mass spectrometry (MS/MS) in combination with liquid chromatography (LC) and gas chromatography (GC). Both LC-MS/MS and GC-MS/MS are commonly used for multi-residue pesticide analysis as some pesticides are only amenable to either LC or GC. Tandem quadrupole MS is the detector of choice as it provides high sensitivity and selectivity for simultaneous analysis of hundreds of pesticides at low ppb (ng/g) levels in a single analysis.
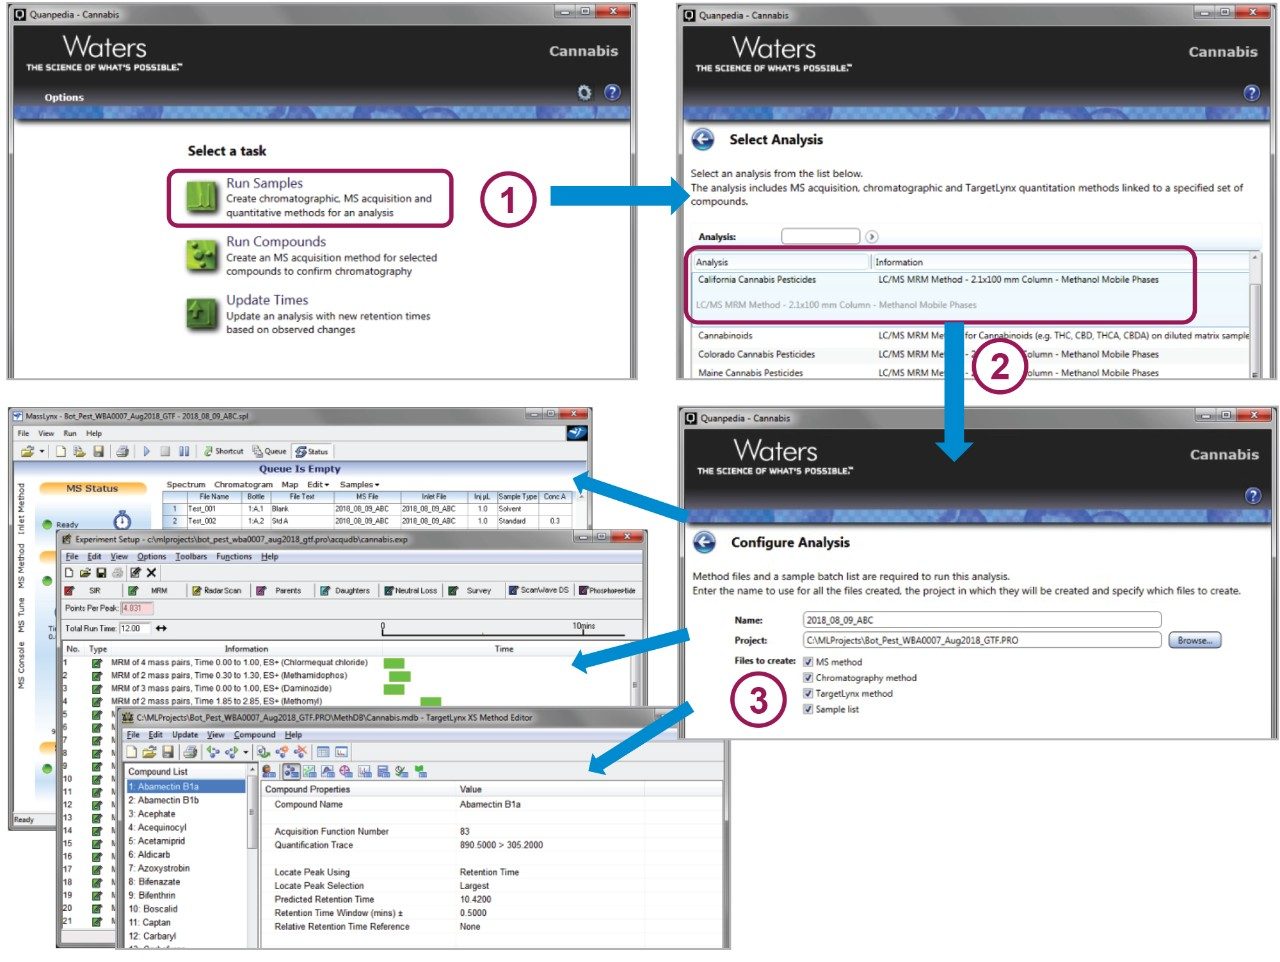
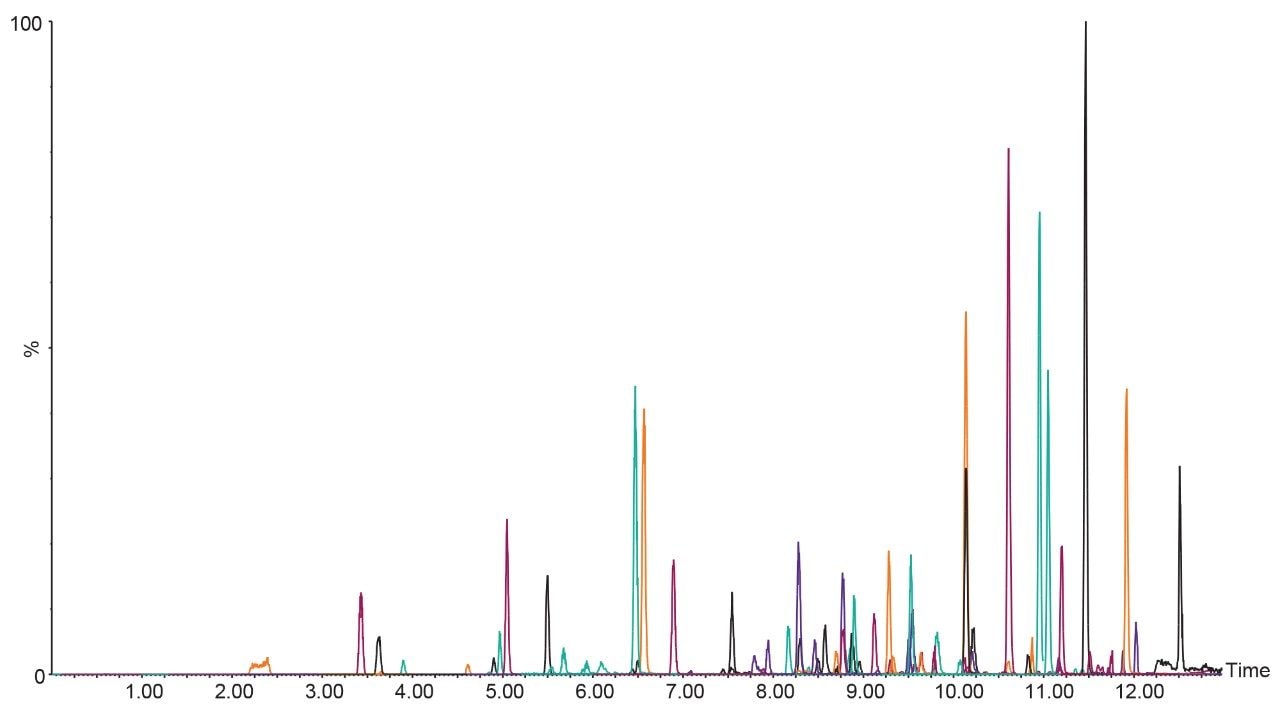
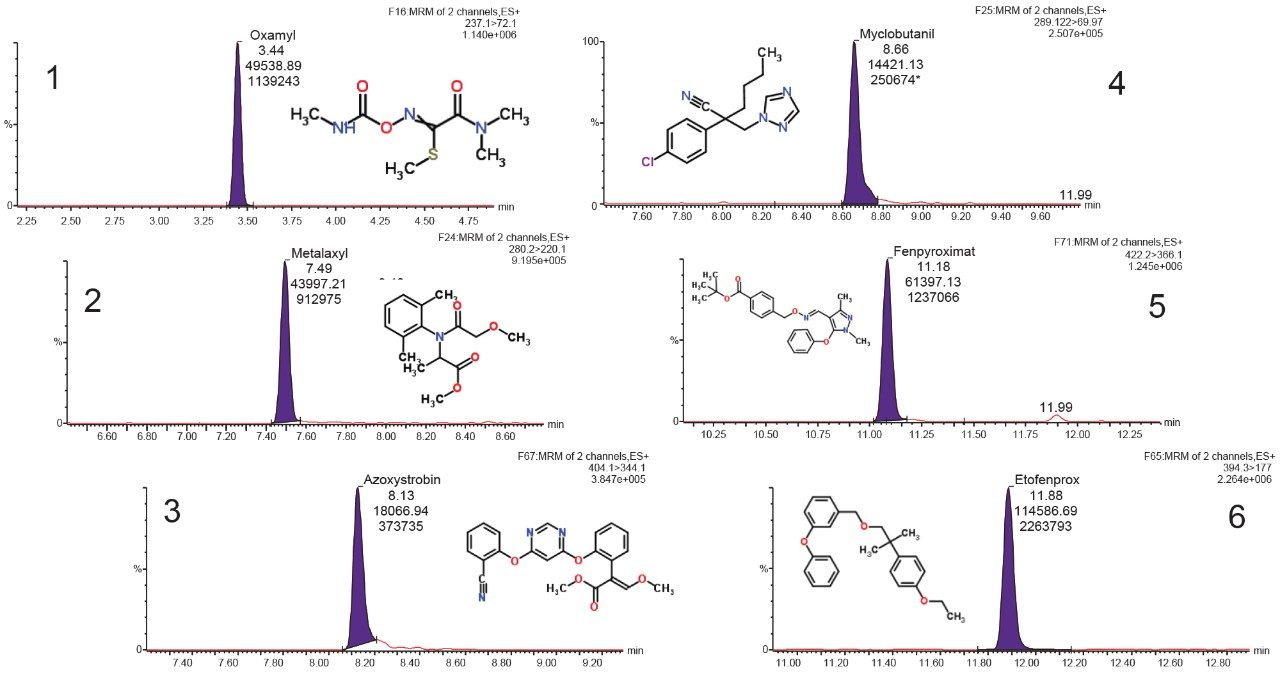
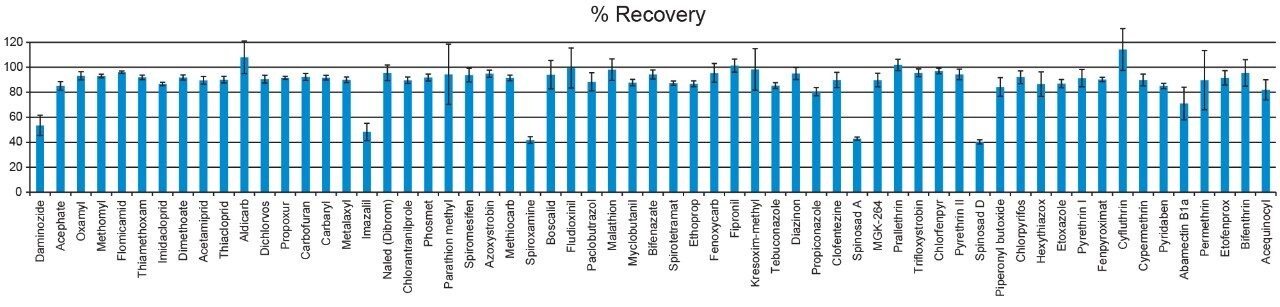
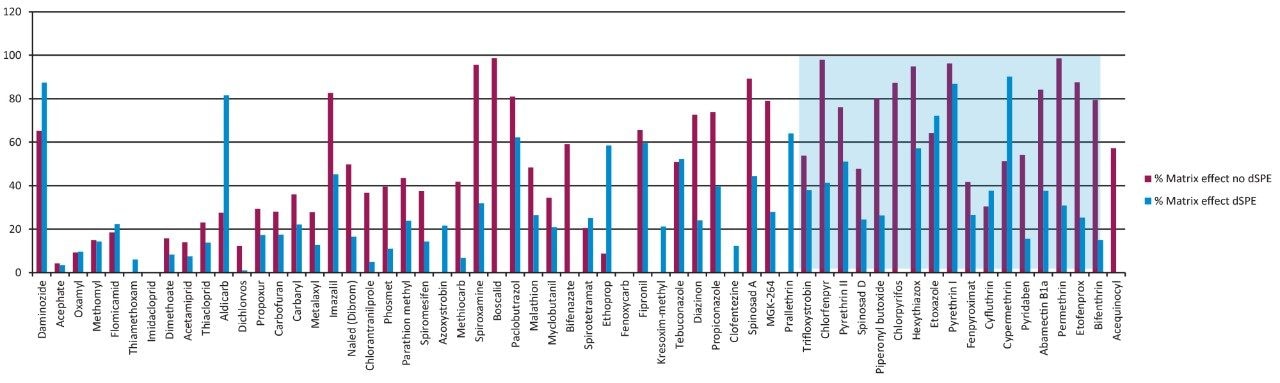
In this application note we present the use of a simple sample extraction and dispersive solid phase extraction (dSPE) cleanup procedure followed by UPLC-MS/MS analysis for rapidly monitoring the Oregon Cannabis Pesticide Guide List3 in cannabis matrix. With so many compounds to monitor, method generation can be a tedious task. In this study, the preexisting LC and MS methods from Waters Quanpedia Database were used to develop and implement a rapid solution for the Oregon pesticide list.