• Applikationsbericht

Designing a New Particle Technology for Reversed-Phase Separations of Proteins

Designing a New Particle Technology for Reversed-Phase Separations of Proteins

  • Jennifer M. Nguyen
  • Susan C. Rzewuski
  • Dan Walsh
  • Jim Cook
  • Gary Izzo
  • Maureen DeLoffi
  • Matthew A. Lauber
  • Waters Corporation
Comprehensive tools for intact protein analysis

Abstract

This application note describes the design and performance of the BioResolve RP mAb Polyphenyl Column and its ability to deliver high efficiency separations, new levels of resolution, and increased throughput for facilitating improved characterization assays.

Benefits

  • Solid-core particles designed to minimize intraparticle diffusion distances for enhanced protein separations
  • Improved mass transfer kinetics leading to better resolution at higher flow rates
  • Optimal 450 Å pore size for superior peak shape and resolution for mAbs in MS-friendly mobile phases
  • A 2.7 μm particle size affording columns with low backpressures amenable to a wide range of LC systems

Introduction

Reversed-phase liquid chromatography (RPLC) has become a preferred method to support various stages of biopharmaceutical development, ranging from basic research investigations to drug release testing.1 Its comparatively high resolution and amenability to hyphenation with mass spectrometry assures its utility for the characterization of protein therapeutics, like monoclonal antibodies (mAbs) and antibody drug conjugates (ADCs). Achieving optimal RPLC separation for these comparatively large analytes requires the use of stationary phases that are specially designed to handle their size and complexity. 

Column technologies for RPLC of proteins have been trending toward the use of wider pore packing materials to allow better mass transfer for today’s increasingly large and more complicated analytes. Columns containing wide-pore, fully-porous particles made from organic polymers, silica, and hybrid organic/inorganic materials are all commonly used. There has also been renewed interest in columns packed with solid-core particles (SCP).2 Comprising a solid core surrounded by a porous layer, SCPs reduce intraparticle diffusion distances of solutes and thereby decrease analyte band broadening versus fully-porous particles. The performance of solid core particles is dependent on the ratio of the core and total particle diameters (ρ). In practice, a range of ρ values from 0.5 to 0.9 has proven effective. The choice of the ρ value involves balancing efficiency versus loadability, as higher ρ values may give higher efficiencies, while lower ρ values give higher surface areas and thus greater loading capacities. A SCP with a ρ value of 0.7 is particularly well balanced in regards to its loading behavior and efficiency2 and thus this value was chosen to create  a new packing material designed for RPLC separations of intact mAbs  and protein subunits. 

The introduction of the BioResolve RP mAb Polyphenyl Column is the culmination of Waters’ efforts to design a new column technology that leverages the advantage of SCP kinetics with an optimized pore diameter and bonding chemistry for RPLC separations of proteins. In this application note, we describe the design and performance of the BioResolve RP mAb Polyphenyl Column and its ability to deliver high efficiency separations, new levels of resolution, and increased throughput for facilitating improved characterization assays.

Experimental

Sample preparation

A sample containing 0.1 mg/mL carbonic anhydrase was prepared by combining 30 µL of a 1 mg/mL carbonic anhydrase  solution with 240 µL of a 6 M guanidine hydrochloride (GuHCl), 0.1% trifluoroacetic acid (TFA) solution, and 30 µL of water.

Reduced, IdeS-digested National Institute of Standards and Technology mAb Reference Material (NIST 8671) was  manufactured, formulated to maintain storage stability, and packed in the form of the Waters mAb Subunit Standard  (p/n: 186008927). Each vial of this lyophilized standard contains approximately 25 µg of subunits and was reconstituted in 100 µL of 0.1% (v/v) formic acid (FA) in water.

Ten mg/mL infliximab (Remicade) was diluted into 13 mM sodium phosphate buffer (pH 7.1) and incubated at a concentration  of 2 mg/mL with IdeS for 30 minutes at 37 °C at a ratio of 1 µg of infliximab per 1 unit of IdeS. The resulting preparation of subunits was stored at -80 °C until analyzed.

A 1 mg lyophilized pellet of Waters Intact mAb Mass Check Standard (p/n: 186006552) was reconstituted in 500 µL (2 mg/mL) of 0.1% (v/v) aqueous formic acid.

Startup and initial column use

All columns were conditioned using Intact mAb Mass Check Standard according to the guidelines provided in the BioResolve RP mAb Polyphenyl Column Care and Use Manual (p/n: 720006027EN). 

van Deemter analyses (Figures 1–4) LC conditions

Instrument:

ACQUITY UPLC H-Class Bio

Columns:

BioResolve RP mAb Polyphenyl, 450Å, 2.7 μm, 2.1 x 50 mm (p/n: 176004156)

Waters prototypes, 2.1 x 50 mm

Other columns, 2.1 x 50 mm

Mobile phase:

0.1% TFA (v/v) in water/acetonitrile (% acetonitrile adjusted for each column to yield k' values between 2.9 and 4.0)

Flow rate:

0.05 to 1.2 mL/min with 0.05 mL/min increments

Column temp.:

60 °C

Detection (UV):

20 Hz, 214 nm

Injection volume:

1 μL

Data management

Chromatography software:

MassLynx 4.1

UNIFI 1.8

Data treatment and analysis

Due to the predominance of the C-term, the data were fit  using linear regression. Linear fits from a minimum of two columns were averaged and thereby used to prepare plots of plate height as a function of chromatographic velocity (so-called van Deemter plots) for each column technology included in this study. 

Chromatographic velocity was calculated from Eq 1.

 Chromatographic velocity equation, where L is the length of the column,  t0,column is the void time of the  column and t0,system is the delay time  of the LC system.
Chromatographic velocity equation, where L is the length of the column,  t0,column is the void time of the  column and t0,system is the delay time  of the LC system.

The retention time of carbonic anhydrase (tR) and its peak  width at half height (W50%) were used to calculate the plate height using Eq 2 and Eq 3.

Efficiency equation, where N is the column efficiency.
Efficiency equation, where N is the column efficiency.
Plate height equation, where L is the column length.
Plate height equation, where L is the column length.

Pore size study (Figure 6) LC conditions

Instrument:

ACQUITY UPLC H-Class Bio

Columns:

BioResolve RP mAb prototypes, 2.1 x 50 mm

Mobile phase A:

0.1% FA or TFA (v/v) in water

Mobile phase B:

0.1% FA or TFA (v/v) in acetonitrile

Gradient:

15–55% B in 20 min

Flow rate:

0.2 mL/min

Column temp.:

80 °C

Detection (UV):

280 nm

Mass load:

1 μg

Data management

Chromatography software:

MassLynx 4.1

UNIFI 1.8

Data treatment and analysis

Pore size distributions were measured using mercury porosimetry.

Effective peak capacity (Pc*) was calculated from Eq 4.

Effective peak capacity equation, where Δt is the difference in retention time for the Fd’ and Fc/2 peaks, and W50%, avg is the average peak width Efficiency equation, where N is at half height for the analyte(s) under investigation.
Effective peak capacity equation, where Δt is the difference in retention time for the Fd’ and Fc/2 peaks, and W50%, avg is the average peak width Efficiency equation, where N is at half height for the analyte(s) under investigation.

Size-exclusion chromatography analyses (Figure 7) LC conditions

Instrument:

ACQUITY UPLC H-Class Bio

Columns:

XBridge Protein BEH C4, 300Å, 3.5 μm, 2.1 x 150 mm (p/n: 186004500)

BioResolve RP mAb Polyphenyl, 450Å, 2.7 μm, 2.1 x 150 mm (p/n: 176004158)

Mobile phase A:

0.02% TFA (v/v) in water

Mobile phase B:

0.02% TFA (v/v) in acetonitrile

Gradient:

15–55% B in 5 min (0.8 mL/min) and 15–55% B in 20 min (0.2 mL/min)

Flow rate:

0.8 mL/min and 0.2 mL/min

Column temp.:

80 °C

Detection (UV):

280 nm

Mass load:

1 μg

Data management

Chromatography software:

Empower 3 FR 2

Accelerating throughput example (Figures 8 and 9) LC conditions

Instrument:

ACQUITY UPLC H-Class Bio

Columns:

XBridge Protein BEH C4, 300Å, 3.5 μm, 2.1 x 150 mm (p/n: 186004500)

BioResolve RP mAb Polyphenyl, 450Å, 2.7 μm, 2.1 x 150 mm (p/n: 176004158)

Mobile phase A:

0.02% TFA (v/v) in water

Mobile phase B:

0.02% TFA (v/v) in acetonitrile

Gradient:

15–55% B in 5 min (0.8 mL/min) and 15–55% B in 20 min (0.2 mL/min)

Flow rate:

0.8 mL/min and 0.2 mL/min

Column temp.:

80 °C

Detection (UV):

280 nm

Mass load:

1 μg

Data management

Chromatography software:

MassLynx 4.1

UNIFI 1.8

Data treatment and analysis

Effective peak capacity (Pc*) was calculated from eq 4.

Results and Discussion

Kinetic Properties and Van Deemter Analysis

To characterize the kinetic performance of columns, we measured peak widths as a function of flow rate. The results were plotted as plate height (H) versus mobile-phase velocity (u), and fit to the van Deemter equation, Eq 5. The van Deemter equation describes the dependence of H on u as the sum of three terms: the A, B, and C terms, or the eddy diffusion, longitudinal diffusion, and mass transfer terms, respectively.

van Deemter equation, where A, B, and C  are the eddy diffusion, longitudinal diffusion, and mass transfer terms, and u is the  mobile phase velocity.
van Deemter equation, where A, B, and C  are the eddy diffusion, longitudinal diffusion, and mass transfer terms, and is the  mobile phase velocity.

While H versus u studies are commonly used to evaluate RPLC columns  for small molecules, they can also be used to evaluate the performance of columns for larger molecules, such as proteins. However, the protein analyte must be chosen carefully due to their potential heterogeneity and how this can affect measured peak widths. To this end, carbonic anhydrase has proven to be a particularly effective analytical probe.3 As a 30 kDa protein, it is sufficiently large to be representative of important separations, such as those corresponding to mAb subunit profiling, without being so  large as to be impossible to elute under isocratic conditions. In passing through a column, carbonic anhydrase produces a peak that through its width reports on the kinetic properties of a column. From the peak width,  the plate height can be calculated. In determining plate heights at a number of different chromatographic velocities, an experimental van Deemter plot can be generated. 

In Figure 1, it is demonstrated that the experimental data can actually be approximated by a linear fit due to the fact that the mass transfer term (C term) dominates, as typically found for high molecular weight analytes. 

Experimental van Deemter plot generated with carbonic anhydrase and a BioResolve RP mAb Polyphenyl Column. The colored lines and markers represent data from three different columns. The black line represents the average fit generated from analysis of these three columns.
Figure 1. Experimental van Deemter plot generated with carbonic anhydrase and a BioResolve RP mAb Polyphenyl Column. The colored lines and markers represent data from three different columns. The black line represents the average fit generated from analysis of these three columns.

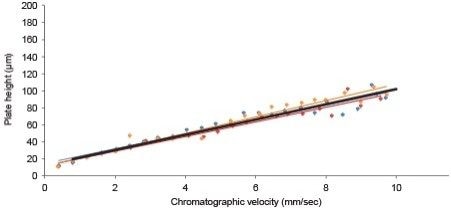
Figure 2 compares the performance of the BioResolve RP mAb Polyphenyl, 2.7 µm Column against Waters’ existing BEH 300Å C4 columns  as well as other commercially available columns for RPLC separations of proteins. 

The plate heights diverge noticeably at increasingly higher chromatographic velocities. Lower plate heights equate to higher efficiency and better column performance. In this comparison, it can be seen that the BioResolve RP mAb Polyphenyl Column produces the lowest plate heights across a wide range of chromatographic velocities. This performance was achieved through careful consideration of several different design properties that included the ρ value, particle and pore sizes, and ligand type.

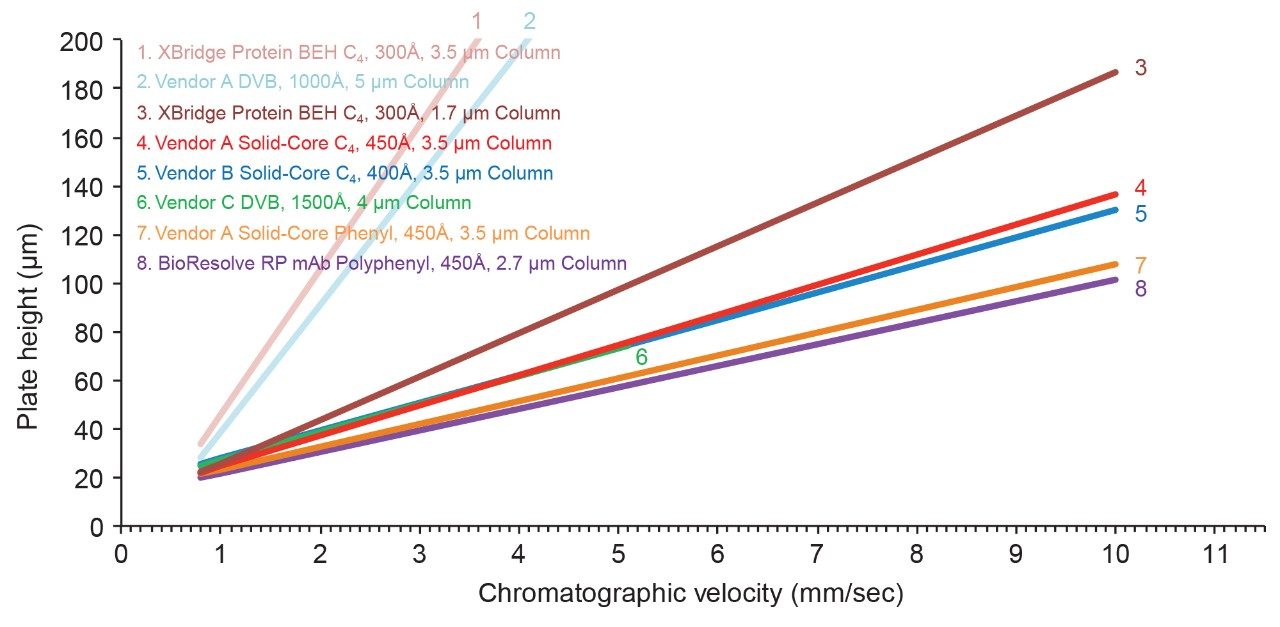
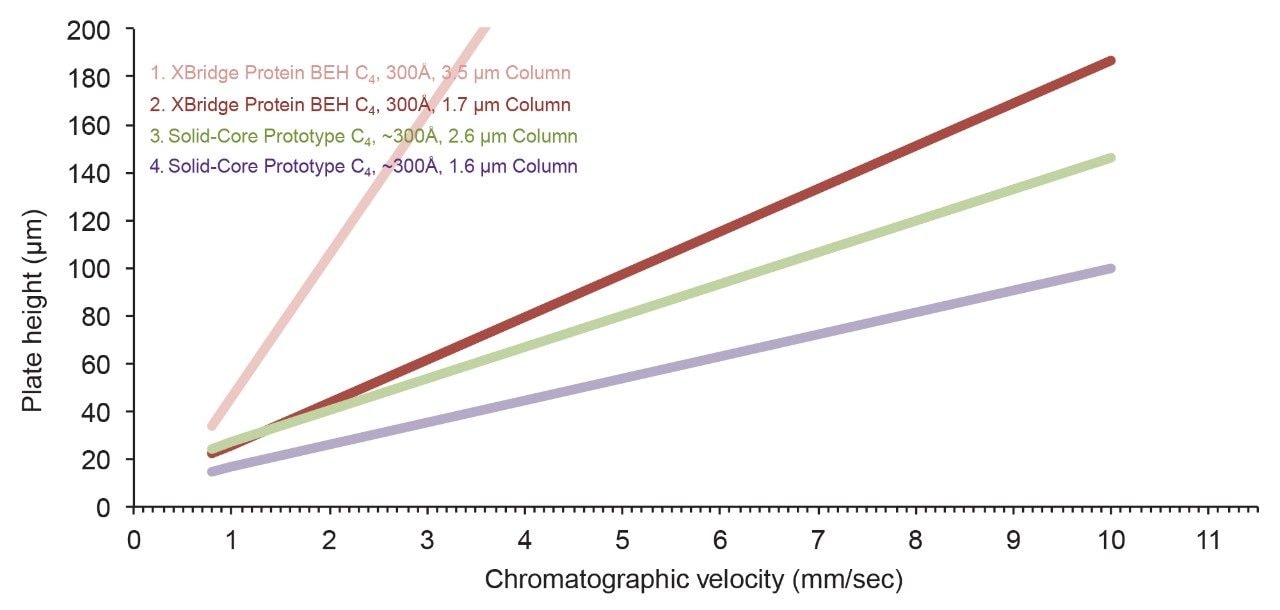
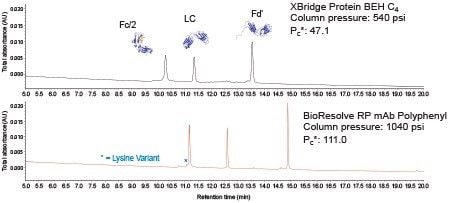
By comparing van Deemter plots, several insights about particle design can be made. First, columns packed with solid-core particles provide noticeably lower plate heights (higher efficiencies) versus columns containing fully-porous particles, especially at higher chromatographic velocities (Figure 3). It is known that the use of SCPs can help minimize longitudinal diffusion.4 In addition, large molecules, such as proteins, also benefit from faster mass transfer that results from SCPs having only a thin layer of pore network through which they are required to navigate. Moreover, these data show that once a SCP morphology is adopted, little is gained by reducing the particle diameter to less than 2.7 µm. By comparison, with a fully-porous morphology, there is a striking difference in the efficiency of columns packed with 1.7 µm versus 3.5 µm particles. In contrast, the benefit of miniaturizing SCPs to such a degree is marginal. Accordingly, a 2.7 µm SCP is a pragmatic option for high efficiency RPLC separations of proteins, achieving the kinetic advantages of <2 µm fully-porous particles with pressures that are amenable to many types of LC instrumentation. Lastly, it has been found that the bonded phase chemistry can affect column efficiency. Figure 4 illustrates this through a comparison of columns packed with nearly identical base particles but modified to have different ligand chemistries. 

Comparison of the van Deemter plots of different commercially available columns versus the BioResolve RP mAb Polyphenyl Column.
Figure 2. Comparison of the van Deemter plots of different commercially available columns versus the BioResolve RP mAb Polyphenyl Column.
van Deemter plots for columns differing by morphology and particle size.
Figure 3. van Deemter plots for columns differing by morphology and particle size.
van Deemter plots for columns containing different bonded phases: C4 versus phenyl based.
Figure 4. van Deemter plots for columns containing different bonded phases: C4 versus phenyl based.

The performance of a column packed with a prototype, solid-core, C4 bonded phase is contrasted against that of a BioResolve RP mAb Polyphenyl Column, and the latter is seen to produce lower plate heights, especially at higher chromatographic velocities. Interestingly, the same trend was observed in a comparison of another vendor’s C4 column against its phenyl-bonded analog. Being composed of rigidly constrained carbons, it is proposed that these phenyl-bonded phases afford more efficient chromatography by limiting the degrees of freedom for the conformational states of the protein-to-sorbent interactions and by sterically hindering protein to silanol interactions. The effects of bonding chemistry on RPLC separations of proteins are discussed further in application note 720006169EN.

Ultimately, it is with the above-mentioned examples of prototyping, and careful consideration of kinetic properties, that the stationary phase of the BioResolve RP mAb Polyphenyl Column was chosen to be based on a 2.7 µm SCP having a ρ value of approximately 0.7 (Figure 5) and a phenyl-based bonded phase.

Focused ion beam – SEM image of the BioResolve RP mAb Polyphenyl, 450Å,  2.7 µm particle.
Figure 5. Focused ion beam – SEM image of the BioResolve RP mAb Polyphenyl, 450Å,  2.7 µm particle.

Acid-induced Protein Conformational Size Differences

For large analytes like mAbs (150 kDa), pore size can have a significant impact on peak width. To guide the appropriate selection of an optimal average pore diameter, BioResolve RP mAb prototypes with varying pore sizes were evaluated for peak capacity, as measured using different IgG-based species along with either formic acid (FA) or trifluoroacetic acid (TFA) modified mobile phases. Figure 6 shows the results of this study. From these data, it has been found that only a select few separations show performance that is dependent on pore diameters in the 300 to 600Å range. First and foremost, it can be seen that none of the IgG species, whether they be 25 kDa subunits, a 100 kDa F(ab’)2 subunit, or an intact 150 kDa mAb molecule, show any significant change in peak capacity when separations are performed with TFA. As well,  no significant dependence is observed with a FA-based separation of 25 kDa subunits. 

Effective peak capacities of different mAb species obtained using stationary phases having various average pore diameters and either 0.1% formic acid (FA) or 0.1% trifluoroacetic acid (TFA) modified mobile phases. FA chromatography of A) Waters mAb Subunit Standard, B) the F(ab’)2 subunit of infliximab and C) the Waters Intact mAb Mass Check Standard. TFA chromatography of D) Waters mAb Subunit Standard, E) the F(ab’)2 subunit of infliximab, and F) the Waters Intact mAb Mass Check Standard.
Figure 6. Effective peak capacities of different mAb species obtained using stationary phases having various average pore diameters and either 0.1% formic acid (FA) or 0.1% trifluoroacetic acid (TFA) modified mobile phases. FA chromatography of A) Waters mAb Subunit Standard, B) the F(ab’)2 subunit of infliximab and C) the Waters Intact mAb Mass Check Standard. TFA chromatography of D) Waters mAb Subunit Standard, E) the F(ab’)2 subunit of infliximab, and F) the Waters Intact mAb Mass Check Standard.

However, very noticeable increases in peak capacity can be observed in the FA separations of larger IgG species, including the F(ab’)2 subunit of infliximab and an intact mAb. There was a significant increase in FA peak capacity values for both of these species when the pore size was increased from approximately 300 to 440Å. Based on these results, the optimal pore diameter of a stationary phase is greater than 400Å for the reversed-phase separation of intact mAb therapeutics using mobile phases containing FA. However, no further benefit was seen when the pore diameter was increased above 450Å.

This requirement for surprisingly large pores can be attributed to the conformations that proteins adopt when subjected to the extreme pH conditions of RPLC chromatography. Previous chromatographic studies have shown that proteins can undergo conformational changes depending on their environment.5 Proteins can unfold in the presence of a strong acid and may even refold into a “molten globule” when subjected to sufficiently high concentrations of acid. This refolding is likely due to the formation of ion pairs and partial hydrophobic collapse of the protein. Previous work by RPLC has shown that mobile phases based on lower concentrations of TFA (e.g., 0.02%) are likely to produce more extended conformations.5

To better understand this effect, as well as the difference between the use of TFA and FA as a mobile-phase additive, we employed size-exclusion chromatography (SEC) where the mechanism of separation is based on a molecule’s size in solution. As shown in Figure 7, SEC analyses of intact mAbs using typical RPLC mobile phases and temperatures show that they elute significantly earlier than when separated under native, non-denaturing conditions. This provides evidence that mAbs, and likely many other proteins, have radii under RPLC conditions that are significantly larger than their native state radii. It was observed that mAbs eluted even earlier in a FA mobile phase than when separated with TFA, suggesting that FA gives the largest conformational radii. As TFA is a more hydrophobic, stronger, ion pairing reagent than FA, it is plausible that it would allow proteins to more readily refold into a “molten globule” by more effectively attenuating cationic Coulombic repulsion and facilitating an entropically driven hydrophobic collapse. Alternatively, the weak ion pairing effects of FA are likely to leave proteins in comparatively extended conformational states.

Size-exclusion chromatograms of two mAb samples A) infliximab and B) the Intact mAb Mass Check Standard acquired under native versus formic acid (FA) and trifluoroacetic acid (TFA) in 30% acetonitrile (ACN), 80 °C RPLC conditions.
Figure 7. Size-exclusion chromatograms of two mAb samples A) infliximab and B) the Intact mAb Mass Check Standard acquired under native versus formic acid (FA) and trifluoroacetic acid (TFA) in 30% acetonitrile (ACN), 80 °C RPLC conditions.

In all, these observations suggest that pore diameters significantly larger than once thought (e.g., 300Å) are required for RPLC separations of mAbs, if column performance is to be optimized for separations based on FA and other MS-friendly, mobile-phase additives. Having a sufficiently large pore diameter ensures that protein separations are not compromised by the peak broadening imposed by restricted diffusion, as described by the Renkin equation.6 For this reason, the pore size of the BioResolve RP mAb stationary phase has been selected to be 450Å. At 450Å, the mass transfer rate is optimized for mAb separations using MS-friendly, weaker ion-pairing mobile-phase conditions, such as 0.1% FA and 0.02% TFA.

Using Kinetic Advantages to Accelerate LC Throughput

The benefits of optimizing the kinetic properties of a stationary phase can be seen through an example that demonstrates the development of a higher throughput, yet still high resolution protein separation. For this, the Waters mAb Subunit Standard was used to evaluate the chromatographic capabilities of a BioResolve RP mAb Polyphenyl, 450Å Column versus an XBridge Protein BEH, 300Å, C4 Column. This standard is based on a stabilized, 25 µg quantity of a reduced, IdeS-digested humanized IgG1K monoclonal antibody, specifically NIST RM 8671.7 As such, it is a reference material relevant to biopharmaceutical work that can be used for benchmarking, proficiency testing, and system suitability measurements.  

Figure 8 presents chromatograms for this standard obtained with the noted columns (both 2.1 x 150 mm) using the same method conditions and a typical 0.2 mL/min flow rate. In this separation, a relatively low concentration of TFA (0.02%) was selected to balance chromatographic resolving power against the suitability of the method for online MS detection. The BioResolve RP mAb Polyphenyl Column gave noticeably sharper peaks. In fact, a two-fold increase in effective peak capacity was achieved compared to the XBridge Protein BEH C4 Column. Moreover, several low abundance species in the standard are far more clearly defined with the BioResolve RP mAb Polyphenyl Column, including a lysine variant appearing on the front of the main Fc/2 subunit peak. 

mAb Subunit Standard separated at 0.2 mL/min using an XBridge Protein BEH C4 , 300Å, 3.5 µm Column and a BioResolve RP mAb Polyphenyl, 450Å, 2.7 µm Column (both 2.1 x 150 mm).
Figure 8. mAb Subunit Standard separated at 0.2 mL/min using an XBridge Protein BEH C4 , 300Å, 3.5 µm Column and a BioResolve RP mAb Polyphenyl, 450Å, 2.7 µm Column (both 2.1 x 150 mm).

Upon increasing the flow rate to 0.8 mL/min, the BioResolve RP mAb Polyphenyl Column continued to yield extraordinarily high resolving power (Figure 9). The lysine variant of the Fc/2 isoform remained clearly noticeable, yet the gradient time of the method was reduced from 20 to 5 minutes. By using the BioResolve RP mAb Polyphenyl Column, the separation can be performed with higher throughput without noticeable loss of separated component resolution. Furthermore, given the relatively low backpressure of the BioResolve RP mAb Polyphenyl, 450Å, 2.7 µm Column, it is possible to implement such a method even using traditional HPLC instrumentation. From this simple example of accelerating throughput, it is shown that an analyst can use a BioResolve RP mAb Polyphenyl Column to obtain better characterization data with shorter turn-around times.

mAb Subunit Standard separated at 0.8 mL/min using an XBridge Protein BEH C4, 300Å, 3.5 µm Column and a BioResolve RP mAb Polyphenyl, 450Å, 2.7 µm Column (both 2.1 x 150 mm).
Figure 9. mAb Subunit Standard separated at 0.8 mL/min using an XBridge Protein BEH C4, 300Å, 3.5 µm Column and a BioResolve RP mAb Polyphenyl, 450Å, 2.7 µm Column (both 2.1 x 150 mm).

Conclusion

A new RPLC column technology based on a 2.7 µm, solid-core particle has been developed to improve RPLC analyses of intact mAbs and mAb subunits. Careful optimization of the base particle to minimize mass transfer and hindered diffusion concerns has resulted in a column with superior kinetic properties in comparison to conventional RPLC stationary phases. After empirically studying the effects of pore size and understanding the implications of protein conformational changes under various RPLC conditions, an optimal pore diameter of 450Å was chosen for the BioResolve RP mAb Polyphenyl stationary phase. This pore diameter, coupled with an optimized particle morphology and unique bonded phase, allows users of the BioResolve RP mAb Polyphenyl Column to exploit a new level of kinetic performance and to generate higher quality, higher resolution chromatographic data with quicker runs, even when using MS-friendly mobile phases.

References

  1. Fekete, S.; Veuthey, J.; Guillarme, D. New trends in reversed-phase liquid chromatographic separations of therapeutic peptides and proteins: Theory and applications. J. Pharm. Biomed. Anal. 2012, 69, 9–27.
  2. Guiochon, G.; Gritti, F. Shell particles, trials, tribulations and triumphs. J. Chromatogr. A. 2011, 1218, 1915–1938.
  3. Kirkland, J. J.; Schuster, S. A.; Johnson, W. L.; Boyes, B. E. Fused-core particle technology in high-performance liquid chromatography: An overview. J. Pharm. Anal. 2013, 3, 303–312.
  4. Gritti, F.; Guiochon, G. Mass transfer kinetics, band broadening and column efficiency. J. Chromatogr. A. 2012, 1221, 2–40.
  5. Bobaly, B.; Toth, E.; Drahos, L.; Zsila, F.; Visy, J.; Fekete, J.; Vekey, K. Influence of acid-induced conformational variability on protein separation in reversed phase high performance liquid chromatography. J. Chromatogr. A. 2014, 1325, 155–62.
  6. Beck, R. E.; Schultz, J. S. Hindered diffusion in microporous membranes with known pore geometry. Science. 1970, 170, 1302–1305.
  7. Schiel, J. E.; Davis, D. L.; Borisov, O. V. State-of the-art and Emerging Technologies for Therapeutic Monoclonal Antibody Characterization Volume 2. Biopharmaceutical Characterization: The NISTmAb Case Study. American Chemical Society: Washington, DC, 2016.

720006168, January 2018

Zurück zum Seitenanfang Zurück zum Seitenanfang