For research use only. Not for use in diagnostic procedures.
In this study, an automated method has been developed for the measurement of mycophenolic acid in plasma. The method utilizes LC-MS and an online SPE system. This combination of SPE sample preparation coupled with the analytical power of LC-MS is able to deliver a very sensitive and efficient method.
Mycophenolic acid is a drug that interferes with purine nucleotide synthesis required for the proliferative response of T and B cells. Measurement of drug levels in plasma can be performed by a variety of analytical methods including immunoassay, LC with UV detection, or LC-MS. LC-MS methods can provide a level of analytical sensitivity and selectivity for mycophenolic acid analysis that is difficult for other methods to achieve.
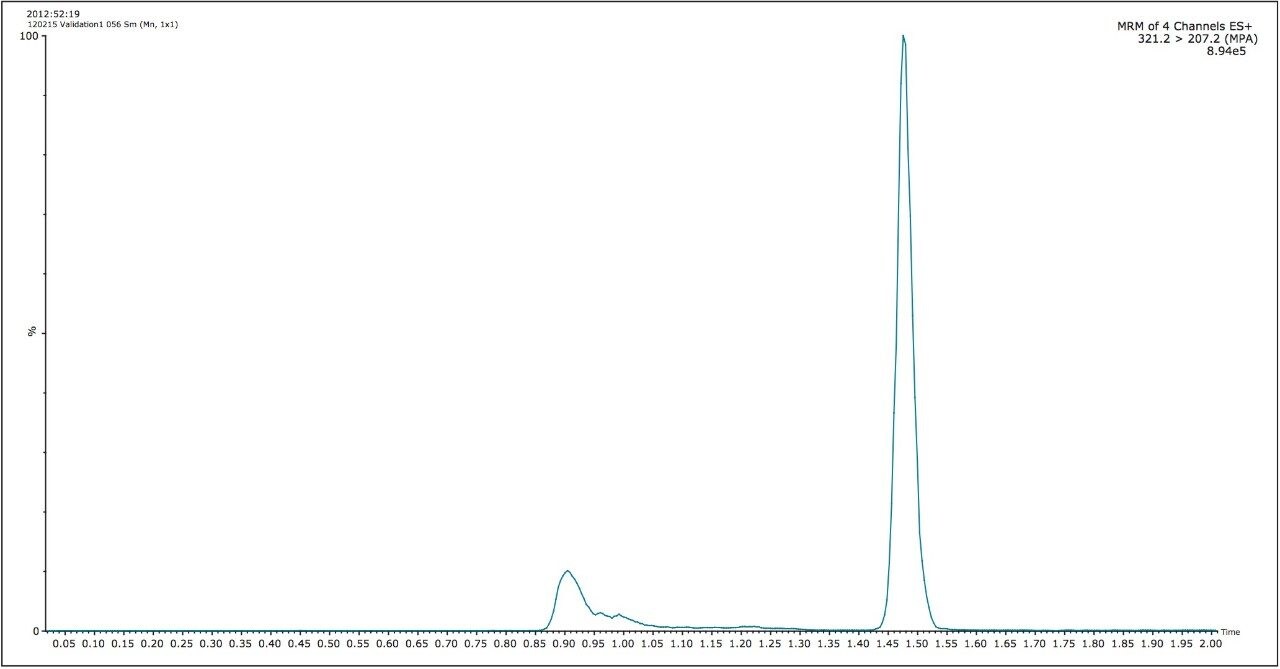
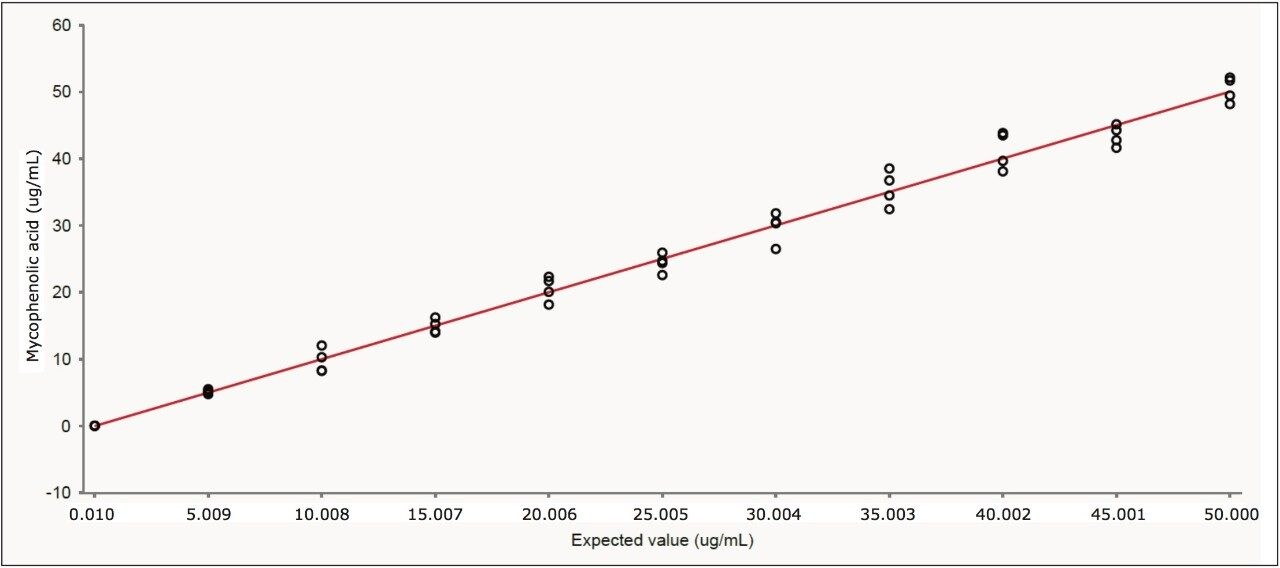
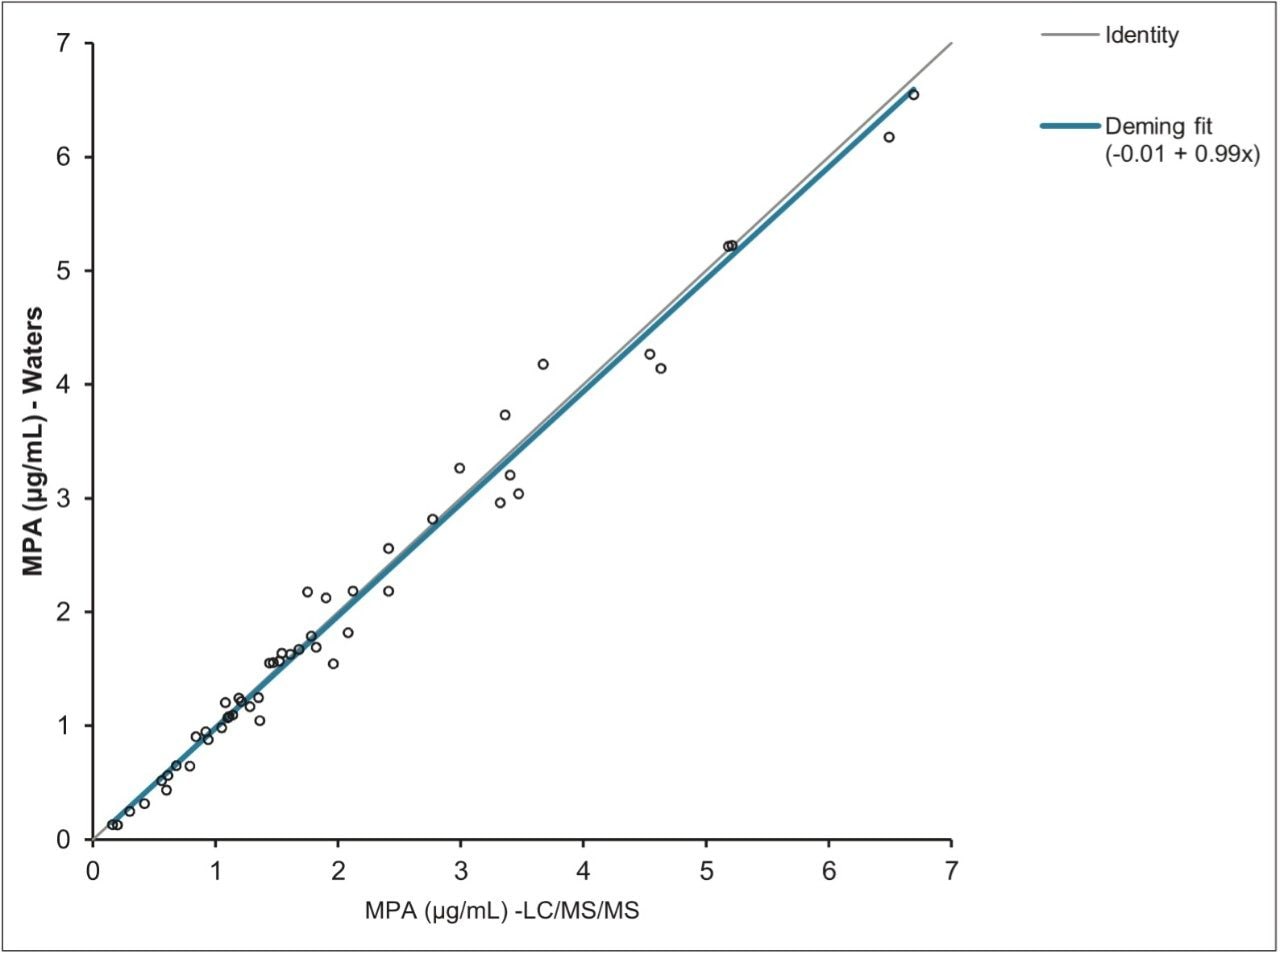
In this study, an automated method for efficiently and accurately measuring mycophenolic acid from plasma has been developed. This method takes advantage of the unique capabilities of an online SPE system, ACQUITY UPLC Online SPE Manager, to automate and integrate sample preparation with LC-MS analysis. This system enables the sensitive and robust measurement of mycophenolic acid in an automated fashion and compares favorably with existing methods for analyzing mycophenolic acid.
Online SPE is completely automated under software control. Disposable SPE cartridges that operate at UPLC pressures are used and, therefore, reduce or eliminate carry over. Parallel cartridge use allows for efficient utilization of the MS system as another sample can be processed through the SPE cartridge while the MS is measuring the components eluting from the LC column.
Calibrators were prepared using either Chromsystems’ 3PLUS1 multilevel plasma calibrator set (Chromsystems Instruments and Chemicals GmbH, Gräfelfing, Germany) or by spiking mycophenolic acid (Cerilliant Corporation, Round Rock, TX) into pooled human plasma (Scipac, Kent, United Kingdom). QC samples were prepared from commercially available material (Chromsystems Instruments and Chemicals GmbH, Gräfelfing, Germany; Recipe, Munich, Germany). Tri-deuterated (2H3) mycophenolic acid (Cerilliant Corporation, Round Rock, TX) was used as internal standard at a concentration of 1 μg/mL in 30% methanol (Sigma Aldrich, Dorset, United Kingdom) containing 0.2 M zinc sulphate (Sigma Aldrich, Dorset, United Kingdom).
Calibrator, QC, or plasma samples (50 μL) were transferred into micro centrifuge tubes (Anachem Ltd., Luton, United Kingdom). Internal standard solution was added (500 μL), and vortex mixed on a mechanical shaker for five minutes (VWR International LLC, Radnor, PA). Samples were then centrifuged at 12,500 rpm for an additional five minutes at 5 °C (Beckman Coulter, Inc., High Wycombe, United Kingdom) before the supernatants were transferred to a 96-well microtitre plate (Waters Corporation, Milford, MA). The plate was then sealed and transferred directly to the autosampler for analysis.
Automated sample extraction was performed automatically using a pre-configured method with a Waters MassTrak Online SPE Analyzer in sample extraction mode with XBridge C18 SPE cartridges. The automated method included the following steps: cartridges were conditioned with 0.7 mL of methanol and equilibrated with 1 mL of water at flow rates of 3 mL/min. Sample (10 μL) was loaded onto the cartridge with water (0.1 mL) at a flow rate of 3 mL/min. Cartridges were then washed with 25% methanol (0.1 mL) at a flow rate of 3 mL/min. After washing, the cartridge was automatically transferred to the left clamp and eluted using the mobile-phase gradient for 1 min. The cartridge was then removed and the clamp flushed with water (0.1 mL) at a flow rate of 3 mL/min. In parallel, a new cartridge was placed in the right clamp allowing SPE of the next sample to be extracted while the chromatography was being performed on the current sample.
Column: |
ACQUITY UPLC HSS C18 SB, 2.1 x 30 mm, 1.8 μm (p/n 186004117) |
Column temp.: |
50 °C |
Sample temp.: |
4 °C |
Injection volume: |
10 μL (PLNO) |
Strong wash: |
methanol |
Weak wash: |
water |
Flow rate: |
700 μL/min |
Mobile phase A: |
2 mmol/L ammonium acetate plus 0.1% formic acid in water |
Mobile phase B: |
2 mmol/L ammonium acetate plus 0.1% formic acid in methanol |
Gradient: |
Initial conditions were 70:30 (v/v) mobile phase A: mobile phase B, at a flow rate of 0.7 mL/min. Mobile phase B was increased to 40% over 0.75 min and then to 75% over an additional 0.85 min. Mobile phase B was then increased stepwise to 98% for 0.4 min before returning to starting conditions for 0.5 min. The total run time was 2.5 min. |
Mass spectrometer: |
ACQUITY TQD |
Ionization mode: |
ESI positive |
Capillary voltage: |
0.5 kV |
Desolvation temp.: |
450 °C |
Desolvation gas: |
800 L/h |
Cone gas: |
25 L/h |
Acquisition mode: |
multiple reaction monitoring (MRM) as shown in Table 1. |
MassLynx v4.1 SCN835 incorporating
TargetLynx Application Manager
Mycophenolic acid and d3-mycophenolic acid eluted from the column at 1.47 minutes, as shown in Figure 2. The interfering peak at 0.9 minute is caused by mycophenolic acid’s glucuronide metabolites. The glucuronide groups are labile and can fragment in the source of the mass spectrometer producing an isobaric interference.1 However, the peaks from the glucuronides are chromatographically resolved from mycophenolic acid, thus do not interfere with quantification. The total run time injection-to-injection was 3.0 minutes, and the overall time to prepare and analyze a 96-well plate of samples was approximately 5.5 hours.
Following CLSI guideline EP-6A,2 the method was shown to be linear from 0.01 to 50.0 μg/mL, as shown in Figure 3. Using Chromsystems’ 3PLUS1 calibrators gave r2 values > 0.996 (n=5) over the range 0.97 to 9.46 μg/mL. The lower limit of detection (signal to-noise ratio ≥3) and quantification (signal-to-noise ratio ≥10) were found to be 2 ng/mL and 7 ng/mL, respectively.
A total of fifty authentic samples were analyzed and the concentration of mycophenolic acid calculated. These values were compared to those obtained at a separate laboratory using a routine LC-MS/MS method. Using Deming Regression, the correlation between the two data sets was described by the equation y = 0.99x - 0.01, giving a bias of just 1% between the two methods, as shown in Figure 4. Bland Altman analysis also demonstrated good agreement of the methods with no systematic or proportional biases observed.
Using CLSI guideline EP07 as a criterion, raised levels of cholesterol (0.7 mg/mL) and albumin (0.05 g/mL) did not affect the quantified concentration of mycophenolic acid in patient samples.3 In addition, no signal above baseline was detected in blank plasma samples spiked with 500 ng/mL of the immunosuppressant drugs sirolimus, everolimus, tacrolimus, and cyclosporine or mycophenolic acid’s parent drug mycophenolate mofetil.
Post-column infusions showed no ion suppression at the elution time for mycophenolic acid. The ion count was stable across the entire run time with no noticeable differences in ion suppression between water and extracted matrix, as shown in Figure 5.
In this study, an automated method has been developed for the measurement of mycophenolic acid in plasma. The method utilizes LC-MS and an online SPE system. This combination of SPE sample preparation coupled with the analytical power of LC-MS is able to deliver a very sensitive and efficient method.
Method development benefits include:
720004669, May 2013