Food products have different desirability and value based in part on palatability and flavor profile. Controlling the manufacture of these food products to consistently meet the expectations and requirements of the consumer can be a difficult challenge. The materials and process that are combined to achieve that finished product can introduce many variables that can ultimately alter the product characteristics.
To ensure product quality, consistency in starting materials is required. Food constituents can have different characteristics based on origin and seasonal variation. The natural products may also have been processed by another manufacturer. All of these factors become further complicated when applying them to a complex process, such as fermentation.
It is, therefore, necessary to verify the quality of the starting materials. Chemical changes in those materials during processing can be monitored to ensure maximum yield of good product. The analysis of the final product assures that consumers always receive quality product. One useful class of chemical markers is amino acids.
Free amino acids can exist as nutrients, metabolic intermediates, or as waste products to a biological process and can be used to identify the genotype and origin of a plant. In a similar fashion, amino acids can be used to relate a profile to valuable characteristics in high value foods. By monitoring the free amino acids during and after a process, it is possible to identify and control physiology that affects the product quality.
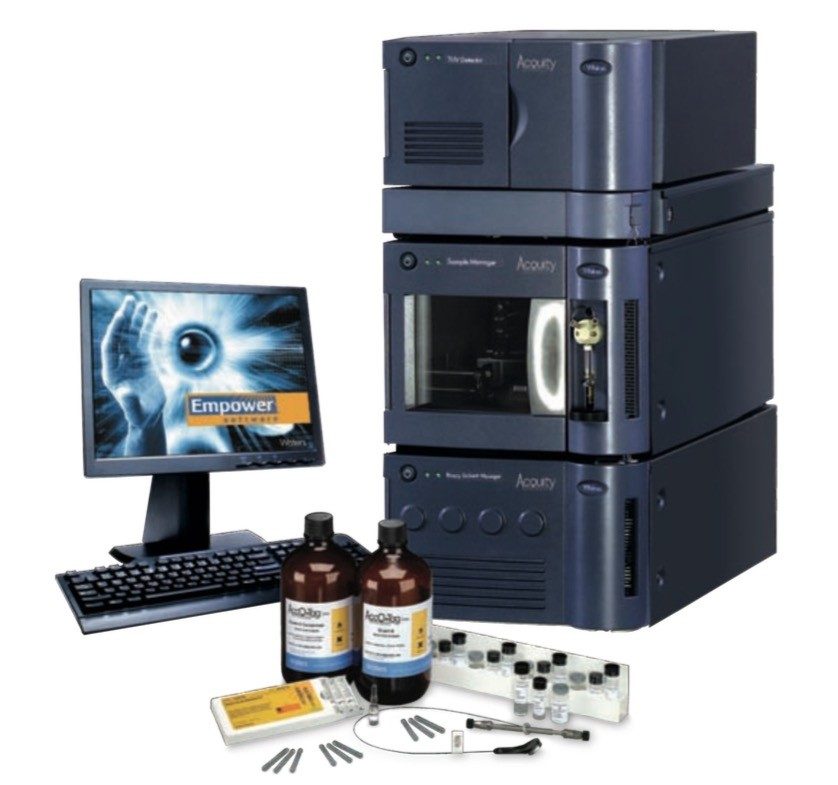
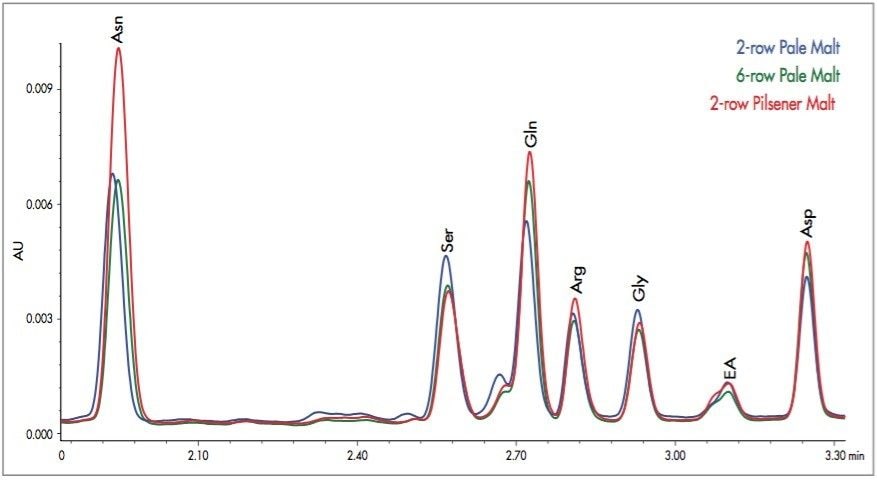
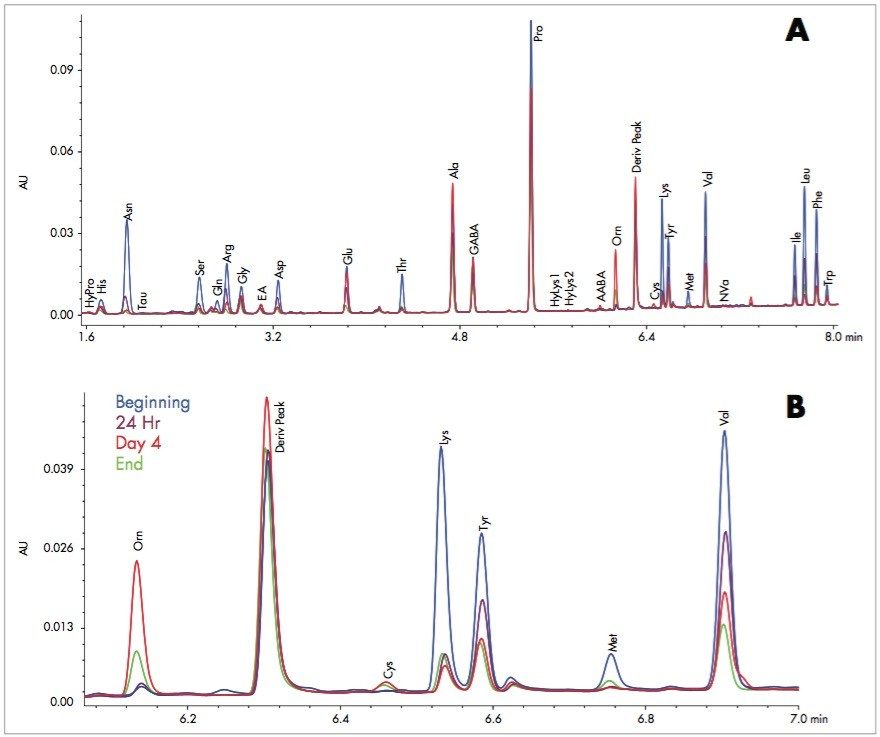
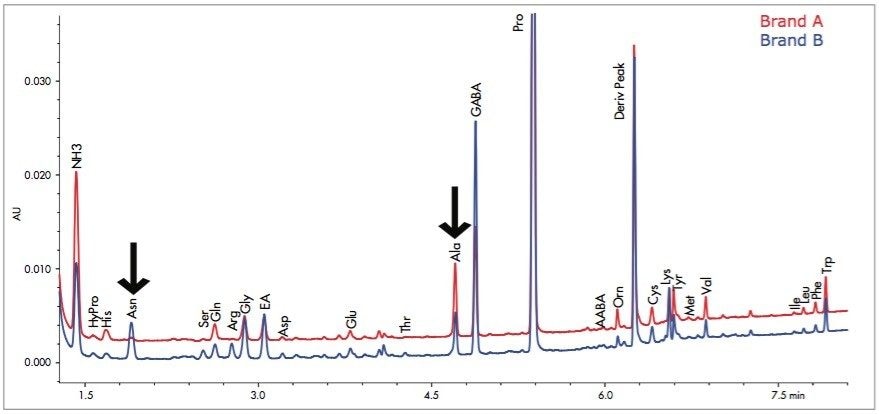
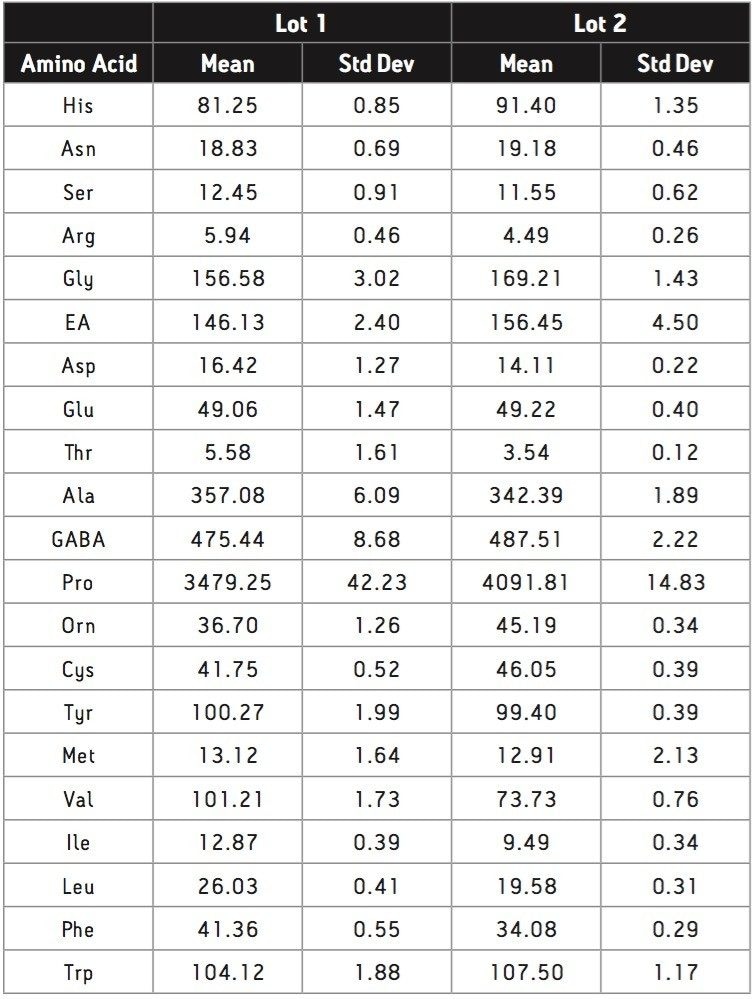
Waters turnkey application, UPLC Amino Acid Analysis Solution, has been used to monitor free amino acids in raw materials, processes, and final product quality of food products. As an example of this application, we have followed a yeast fermentation in the production of a beer. Characterization of raw materials is demonstrated with the free amino analysis of three different starting fermentation barley malts. Each of these malt varieties were then carried through a fermentation process, and the changes in free amino acid levels were observed at different stages of the fermentation. Finally, free amino acid analysis was performed on multiple lots of two commercially-produced pale ales to differentiate the brands and determine the manufacturing lot consistency.