• Applikationsbericht

Rapid Analysis of Aflatoxins without Derivatization Using Ultra Performance Liquid Chromatography and Fluorescence Detection

Rapid Analysis of Aflatoxins without Derivatization Using Ultra Performance Liquid Chromatography and Fluorescence Detection

  • Mark E. Benvenuti
  • Alice J. Di Gioia
  • Waters Corporation
Black mold which produce aflatoxins

Abstract

This application note introduces a methodology that utilizes VICAM's AflaTest cleanup columns and the ACQUITY UPLC with Fluorescence (FLR) Detector with the large volume flow cell, to obtain aflatoxin content in cereals, grains, nuts, and other foodstuffs without derivatization.

Benefits

Immediate benefits of using the ACQUITY UPLC FLR Detector instead of HPLC are the decrease in analysis runtime from 12.0 to 4.5 minutes

Introduction

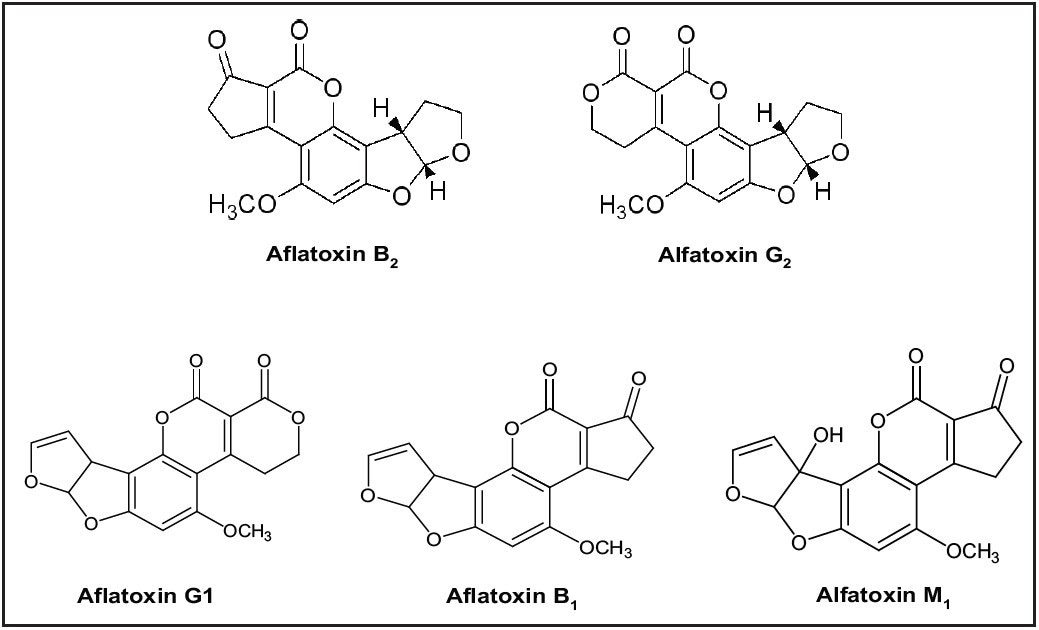
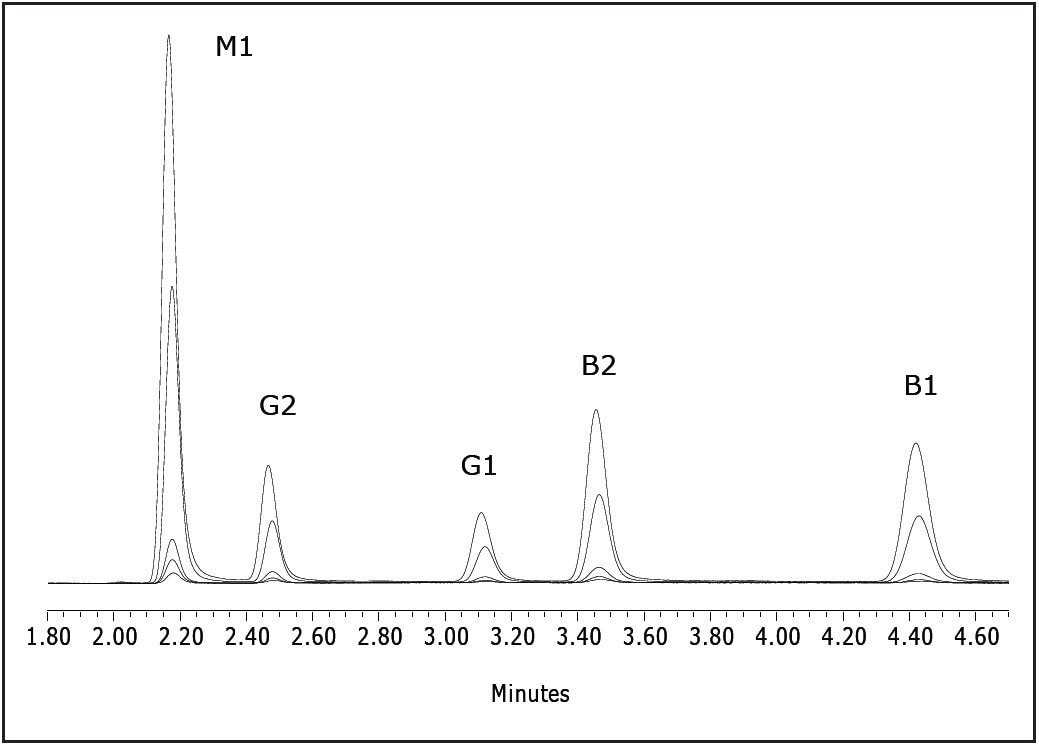
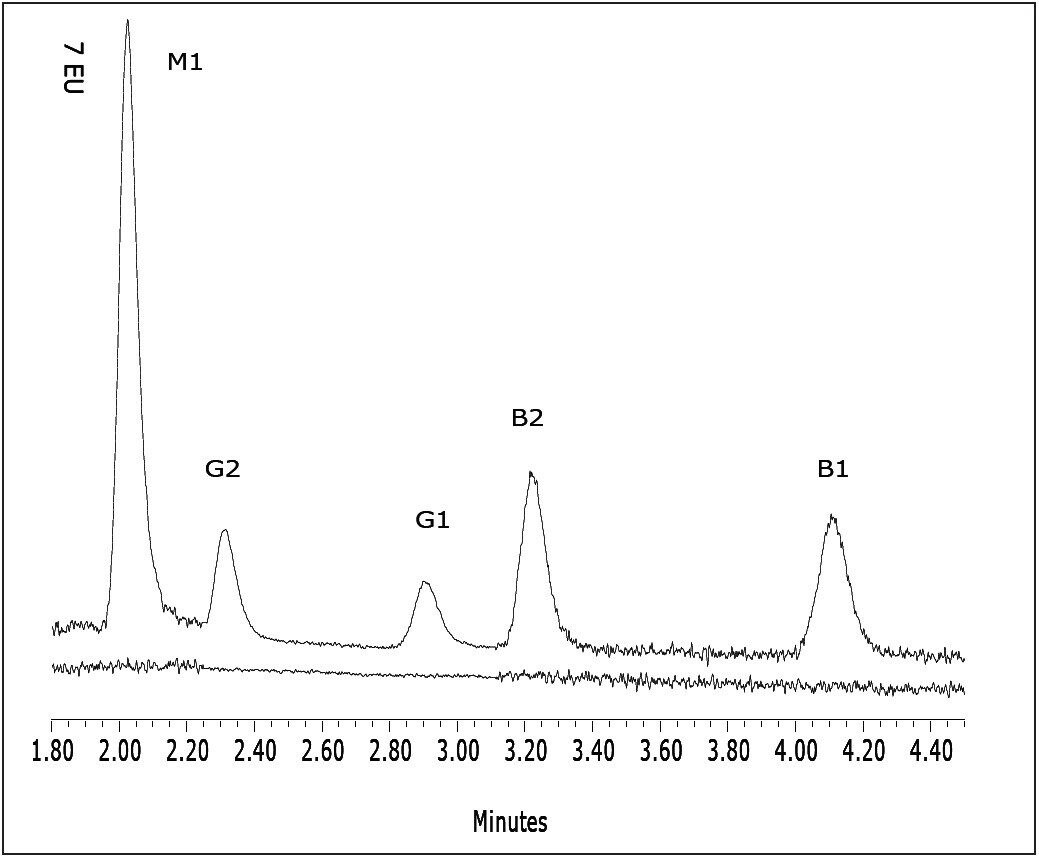
Aflatoxins are a group of mycotoxins produced as metabolites by the fungi Aspergillus flavus and Aspergillus parasiticus. They can be found in various foodstuffs such as grains, nuts, spices, and dairy products. There are four major naturally occurring aflatoxins: B1, B2, G1, and G2. A third subset, M1 and M2, arise as metabolic products when dairy cattle eat B contaminated grains. This can result in contaminated dairy products. Structures for these compounds are shown in Figure 1. M2 was not included in this study.

Aflatoxins are toxic and can be carcinogenic to humans and animals, with B1 and G1 more potent than B2 and G21. Due to this toxicity, government regulatory agencies impose strict limits on their content in foodstuffs. For this reason, the food industry needs sensitive, accurate, and reproducible methods to measure these analytes. These methods are typically based on reverse phase HPLC with fluorescence detection. However since reverse phase eluents quench the fluorescence of aflatoxins B1 and G1, derivatization is commonly required to enhance the response of these analytes. Typical choices are pre-column with trifluoroacetic acid (TFA), or post-column with iodine, electrochemically generated bromine, or photochemical UV.3

This application note introduces a methodology for the analysis of aflatoxins that utilizes Vicam AflaTest cleanup columns and a single detector, the Waters ACQUITY UPLC Fluorescence (FLR) Detector with the large volume flow cell, to obtain aflatoxins content in cereals, grains, nuts, and other foodstuffs without derivatization. There is no need to purchase a post-column derivatization system. Consequently, the overall setup, operation, and maintenance are easier.

Experimental

UPLC conditions

LC system:

ACQUITY UPLC with FLR Detector

Flow cell:

FLR Large Volume (part no. 205000609)

Column:

ACQUITY UPLC BEH C18 Column 2.1 x 100 mm, 1.7 µm (part no. 186002352)

Column temp:

30 ˚C

Flow rate:

400 µL/min

Mobile phase:

64:18:18 water/methanol/acetonitrile

Injection volume:

20 µL (full loop)

Run time:

4.5 min

Detection:

Fluorescence Data rate/filter settings: 20 pts/sec, PMT:10, Time constant: 0.2 sec (normal)

Excitation:

365 nm

Emission:

429 nm, aflatoxins M1, B2, B1 455 nm, aflatoxins G2, G1

Weak wash:

3:1:1 water/methanol/acetonitrile (1000µl)

Strong wash:

5:1:1 acetonitrile/IPA/water (500µl)

Software:

Empower 2

Aflatoxin structures
Figure 1. Aflatoxin structures.

Standard preparation

Two standard mixes in acetonitrile were purchased from Supelco: aflatoxin M1 ~10.0 parts per million (ppm) (46319- U), and B1 and G1 ~1.0 ppm with B2 and G2 ~0.3 ppm (46304- U). Actual certification values were used to compute concentrations. Three intermediate stock solutions were prepared by diluting the B and G mix 1:100 and 1:1000 and the M1:1000 in methanol. These stock solutions were diluted in 1% aqueous acetic acid to produce five standard mixes with the concentrations shown in Table 1.

 Concentration of standards parts per trillion

 Table 1. Concentration of standards parts per trillion (ppt).

Sample preparation:4

A commercial cereal sample was divided into two, 25 g portions. One portion was kept as a blank. The other was spiked with the aflatoxin standards at the levels listed in Table 2. Both portions were then  carried through the following sample preparation procedure.

Using a blender, combine 25 g sample, 5 g sodium chloride, and 100 mL of a 80:20 methanol:water (HPLC grade), and mix at high speed for 1 min.

  •  Filter the mixture through fluted Whatman filter paper  (filtrate 1).
  •  Mix 10 mL of filtrate 1 with 40 mL water
  •  Filter through glass microfiber filter paper (filtrate 2).
  • Load 10 mL of filtrate 2 onto a Vicam AflaTest WB Column.
  • Wash with two, 10 mL portions of HPLC-grade water.
  •  Elute with 1 mL HPLC-grade methanol.
  •  Dilute 1:1 with 1% aqueous acetic acid and inject.

Results and Discussion

Figure 2 is a representative overlay of the five standards. Each standard was injected three times. Linearity (R2) was greater than 0.999 for all of the analytes. Figure 3 is an overlay of the unspiked and spiked cereal. The lower chromatogram (unspiked cereal) shows no contamination. The limit for foodstuffs is < 20 ppb for the sum of aflatoxins B and G5, 6, and 7. Table 2 contains the recovery data.

Recovery data for cereal
Table 2. Recovery data for cereal (parts per trillion).
Overlay of chromatograms for standard mixes 1 to 5
Figure 2. Overlay of chromatograms for standard mixes 1 to 5.
Overlay of spiked and unspiked cereal chromatograms
Figure 3. Overlay of spiked and unspiked cereal chromatograms

Conclusion

Immediate benefits of using the ACQUITY UPLC FLR Detector instead of HPLC are the decrease in analysis runtime from 12.0 to 4.5 minutes7, and the ease-of-use of the analytical instrumentation. Eliminating a post-column derivatization system and post-column flow lessens band broadening, providing sharper peaks with higher signal-to-noise ratios, enabling more accurate integration and quantitation. With fewer instrument modules, there is less training, troubleshooting, and upkeep.

The ACQUITY UPLC FLR Detector, with its large volume flow cell provides the needed analysis sensitivity for quantifying aflatoxins B1 and G1 without post column derivatization. Because the calibration was linear ( R2> 0.999 ) over two orders of magnitude, and recoveries for the five aflatoxin compounds spiked into the cereal sample were satisfactory, analytical lab personnel can have a high level of confidence in both the sample preparation procedure and the analysis methodology. This methodology can also be applied to other mycotoxins such as zearalenone and ochratoxin-A.

In addition to the benefits previously described, solvent consumption is reduced by 85%, relative to HPLC. This is of particular importance when managing acetonitrile usage, particularly during periods of limited supply.


References

  1. Fungal Toxins Economic Health and Techno – Commercial Implications, Frost and Sullivan, 2001 p. 29.
  2. Kok, W Th. Derivatization Reactions for the Determination of Aflatoxins by Liquid Chromatography with Fluorescence Detection, Journal of Chromatography B. 659: ( 1994 ) pp 127-137.
  3. Joshua et al, The Simultaneous HPLC Determination of Six Aflatoxins, Zearalenone and Ochratoxin-A Using Gradient Elution. Post Column Photochemical Derivatization and Fluorescence Detection. Presented at the 110th AOAC International Meeting and Exposition, September 8-12, 1996, Orlando, FL.
  4. Vicam AflaTest HPLC Instruction Manual p.11 (modified as described) #715001733 Rev. A 2007.
  5. Council for Agricultural Science and Technology, Mycotoxins: Risks in Plants, Animals, and Human Systems. January, 2003 p. 127.
  6. EU Commission Regulation 1881/2006/E.
  7. M Benvenuti et al. A Unified Method for Mixed Mycotoxin Analysis Using UV and Fluorescence Detection  Waters Poster #720000908EN, ( 2004 ).

Ackowledgement

We thank Marjorie Radlo, Nancy Zabe and the staff of Waters Vicam for their assistance with this study.

720002644, January 2009

Zurück zum Seitenanfang Zurück zum Seitenanfang