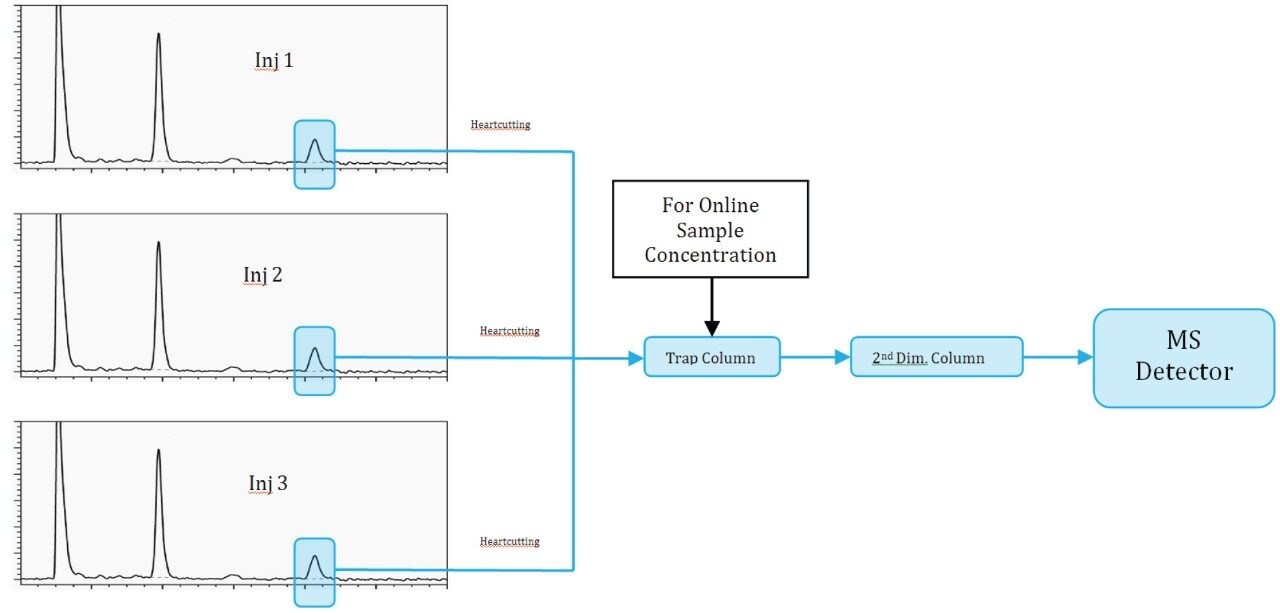
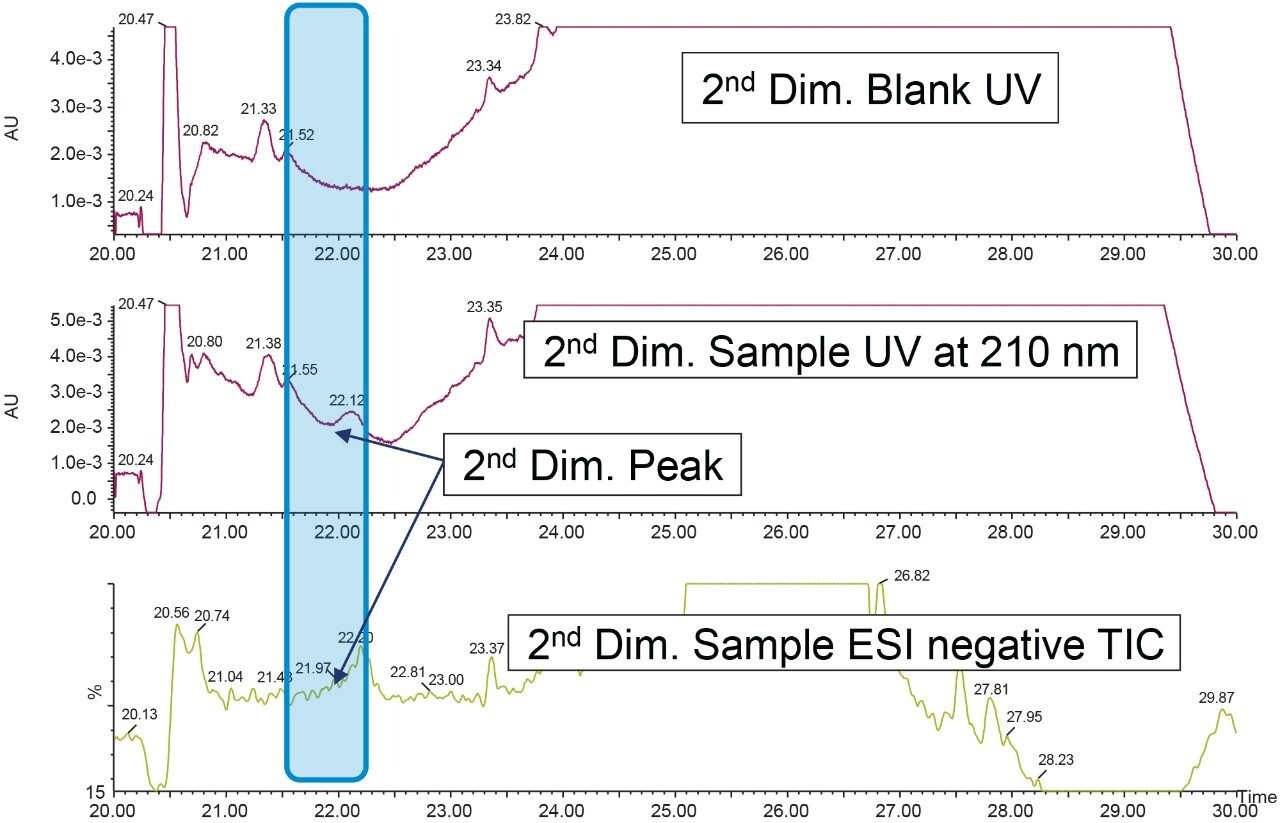
In this application note, we are demonstrating how to get the mass information of trace level impurities using online sample concentration. Mass spectral detection of peaks from non-MS compatible buffers is challenging due to non-volatility of mobile phases. The ACQUITY UPLC System with 2D LC Technology configured for heart-cutting which can directly transfer a selected peak from a non-ms compatible chromatographic method to a mass detector for mass spectral analysis with no fraction collection and no redevelopment of the method. Configuring the system for at-column dilution will further give the flexibility of doing online sample concentration which makes it possible to get the mass spectral information for trace level impurities.
Orthophosphoric acid is often used for better performance on lower wavelength chromatography, but is not mass spectrometry (MS) compatible. To overcome this challenge, alternative MS compatible chromatographic methods need to be developed to make it MS compatible. Furthermore, this MS friendly method doesn’t assure or give the confirmation of mass identification of the same peak as observed in the non-MS compatible mobile phase. Two-dimensional liquid chromatography (2D LC) embracing mainly heart-cutting LC offers new opportunities for mass spectral detection of pharmaceuticals.
Heart-cutting 2D LC is an effective way to get mass information from a non-MS compatible mobile phase. It typically transfers one fraction of interest from the first dimension to a trap cartridge for the removal of non-volatile buffer and then transfers it to the second dimension. The instrumentation setup is simple and data analysis is straightforward. A distinct advantage of heart-cutting is the second dimension method run time is independent of the sampling rate from the first dimension; therefore a relatively longer method can be used to increase resolution and sensitivity. These factors are particularly important for trace level analysis. In this application note, we are demonstrating how to get the mass information of trace level impurities using online sample concentration.
UPLC conditions
Pump: |
ACQUITY UPLC QSM |
Column: |
ACQUITY UPLC |
HSS C18 SB 1.8 μm, 2.1 x 100 mm |
|
(P/N: 186004119) |
|
Detection: |
UV @ 210 nm |
Column temp.: |
40 °C |
Sample temp.: |
10 °C |
Injection volume: |
5 μL |
Mobile phase A: |
0.1% Orthophosphoric acid in water |
Mobile phase B: |
Acetonitrile |
Flow rate: |
0.5 mL/min |
LC gradient: |
Start at 5% B and hold for 3.75 min, |
linear ramp to 50% B for 10 min, |
|
and return to initial condition by 12 min |
|
Run time: |
15 min |
Diluent: |
Methanol |
Sample concentration: |
2.5 mg/mL |
Pump: |
ACQUITY UPLC BSM |
Column: |
ACQUITY UPLC |
CSH C18 1.7 μm, 2.1 x 50 mm |
|
(P/N: 186005296) |
|
Column temp.: |
50 °C |
Mobile phase A: |
Water |
Mobile phase B: |
Acetonitrile |
Flow rate: |
0.6 mL/min |
Mobile phase: |
Water |
Trap column: |
Oasis HLB 2.1 x 30 mm Direct Connect HP |
ESI (+) |
ESI (-) |
---|---|
Capillary: 3 KV |
Capillary: 2.8 KV |
Cone: 40 V |
Cone: 40 V |
Source temp.: 150 °C |
Desolvation temp.: 550 °C |
Desolvation gas: 950 L/hr |
Cone gas: 50 L/hr |
Cone gas: 50 L/hr |
Chromatography software: MassLynx v4.1
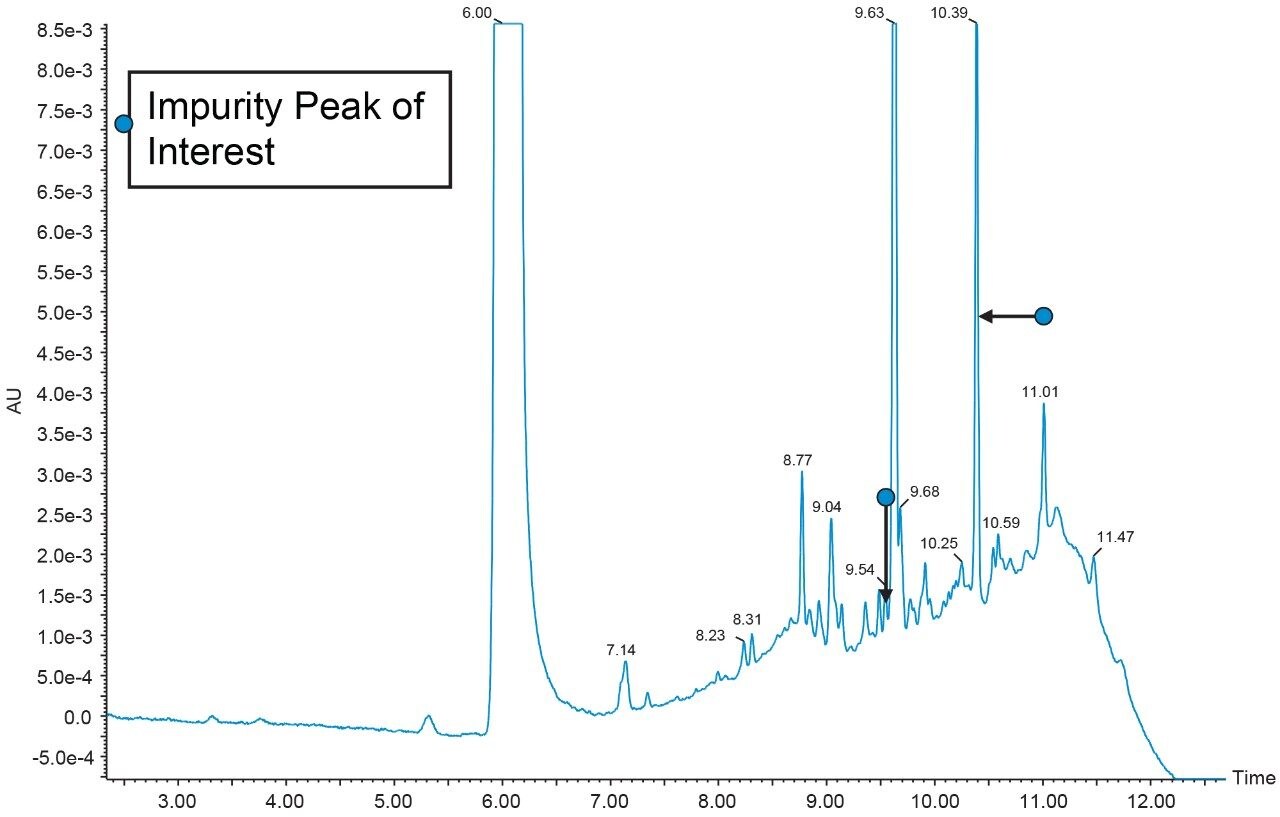
The non-MS compatible 1D method was run with UV detection.
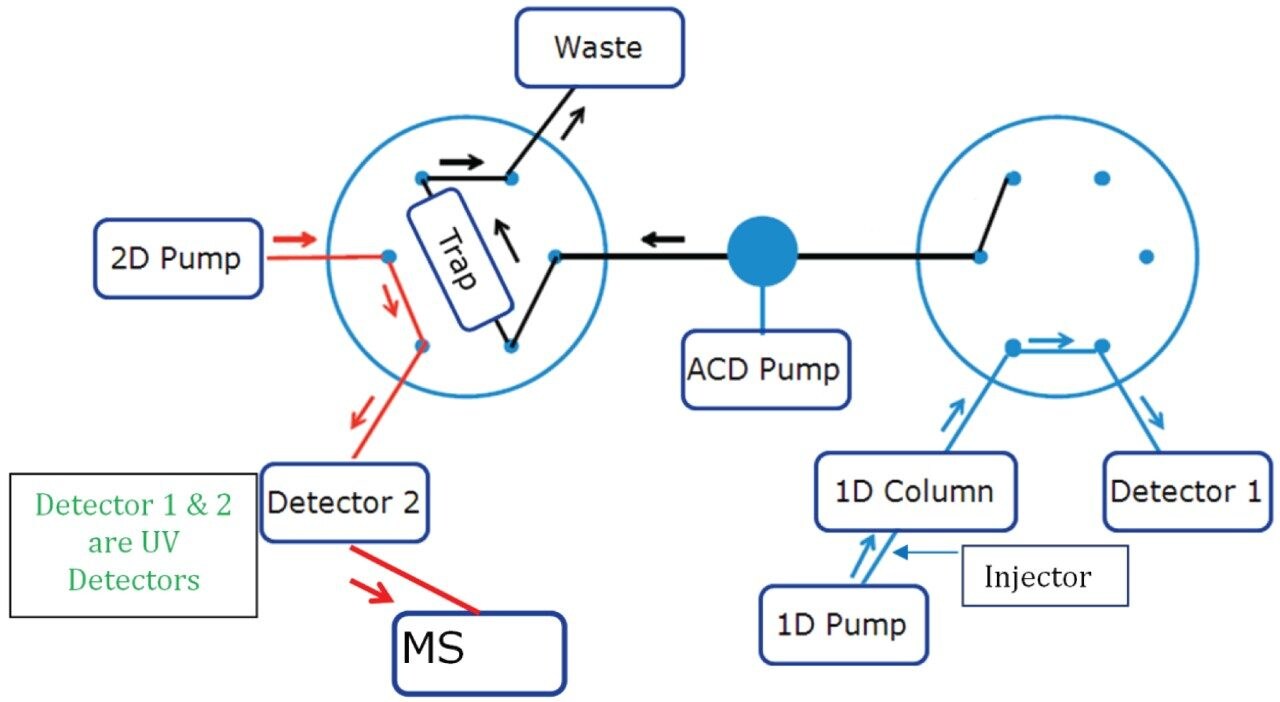
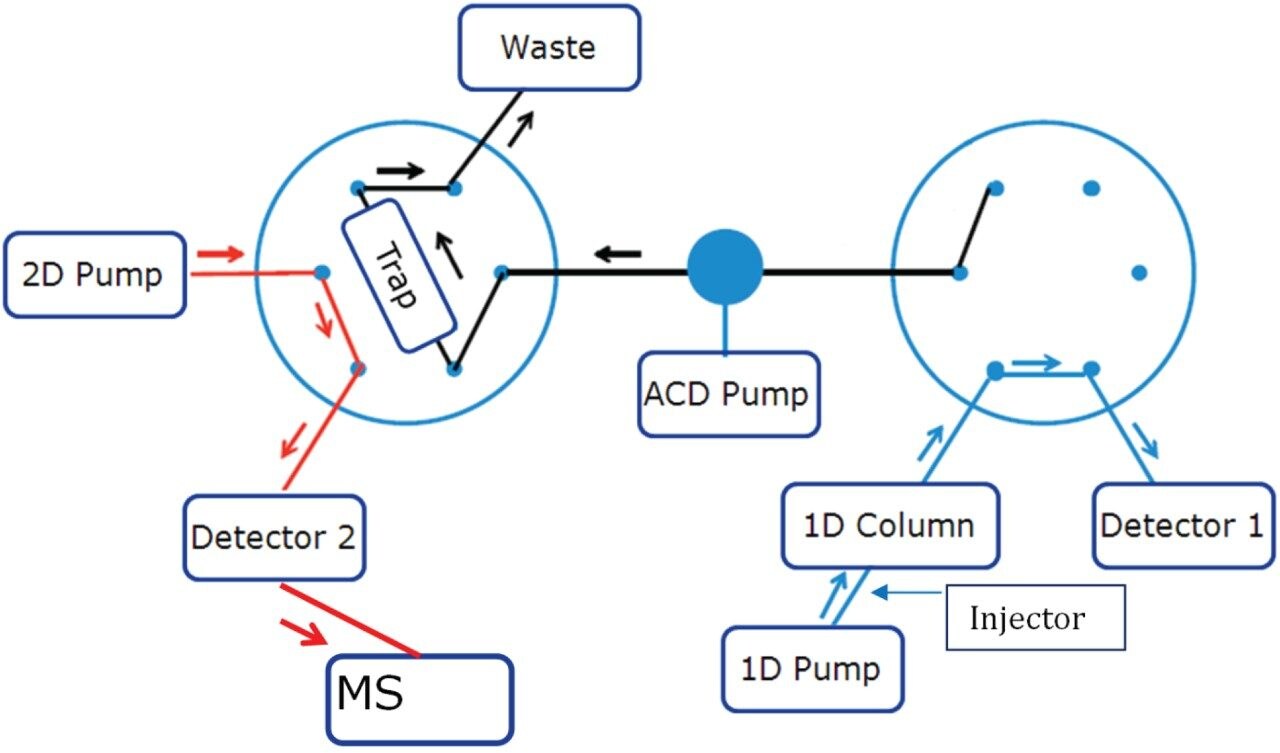
Just before the peak of interest starts eluting from the ACQUITY UPLC Column, entered in the method as a timed event, the following steps occur:
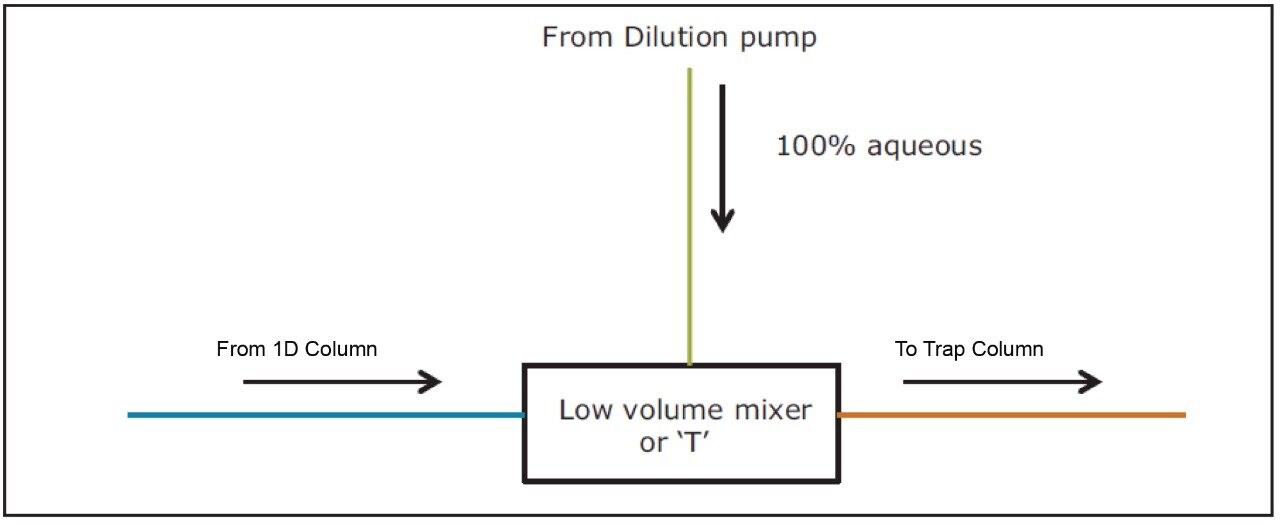
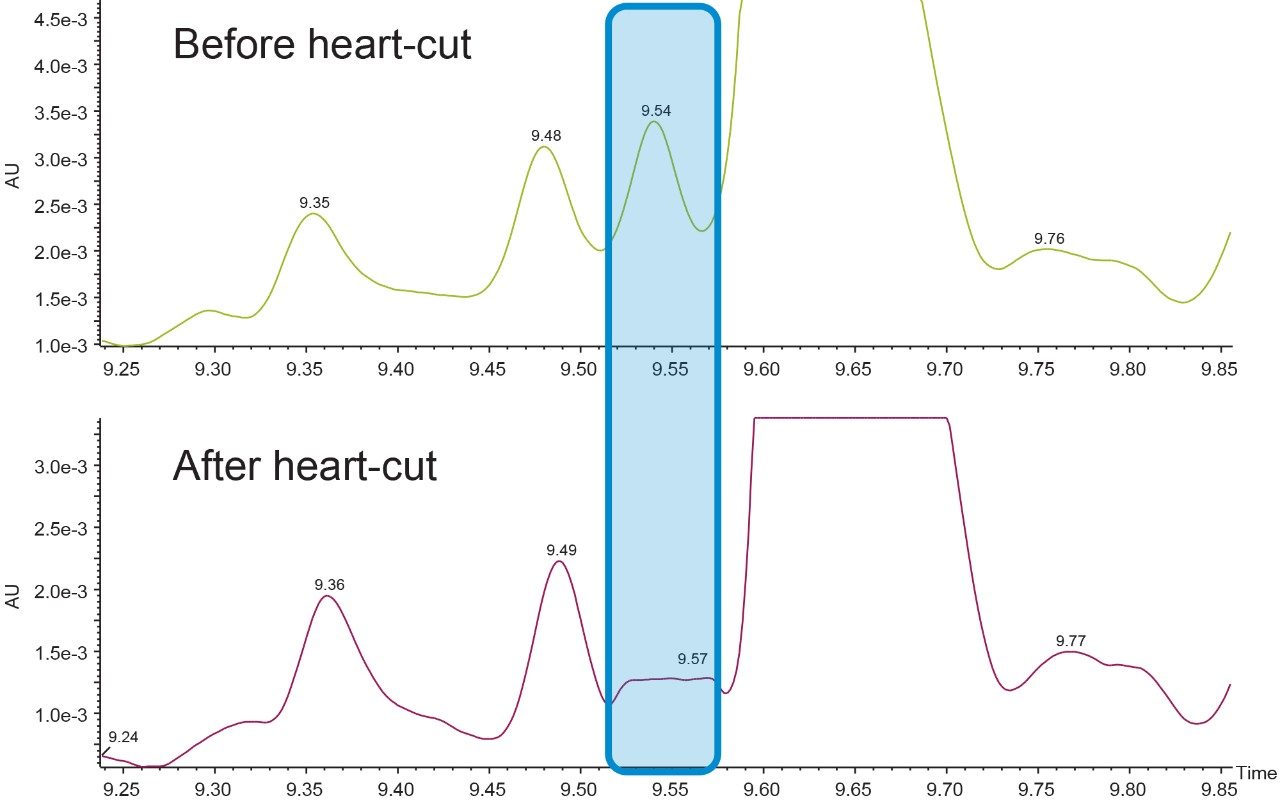
1. Flow from the first dimension column was diverted to a mixer using a two position switching valve.
2. Flow from the dilution pump was delivered to the mixer which mixes with the first dimension mobile phase diluting the organic composition and takes the analyte to a trap column and retains the analyte to the trap column.
3. Switching valve was turned back to initial position to continue obtaining the first dimension chromatogram while keeping the dilution pump flow on to washout the non-MS compatible mobile phase from the first dimension and for achieving narrow band for eluate on the trap column.
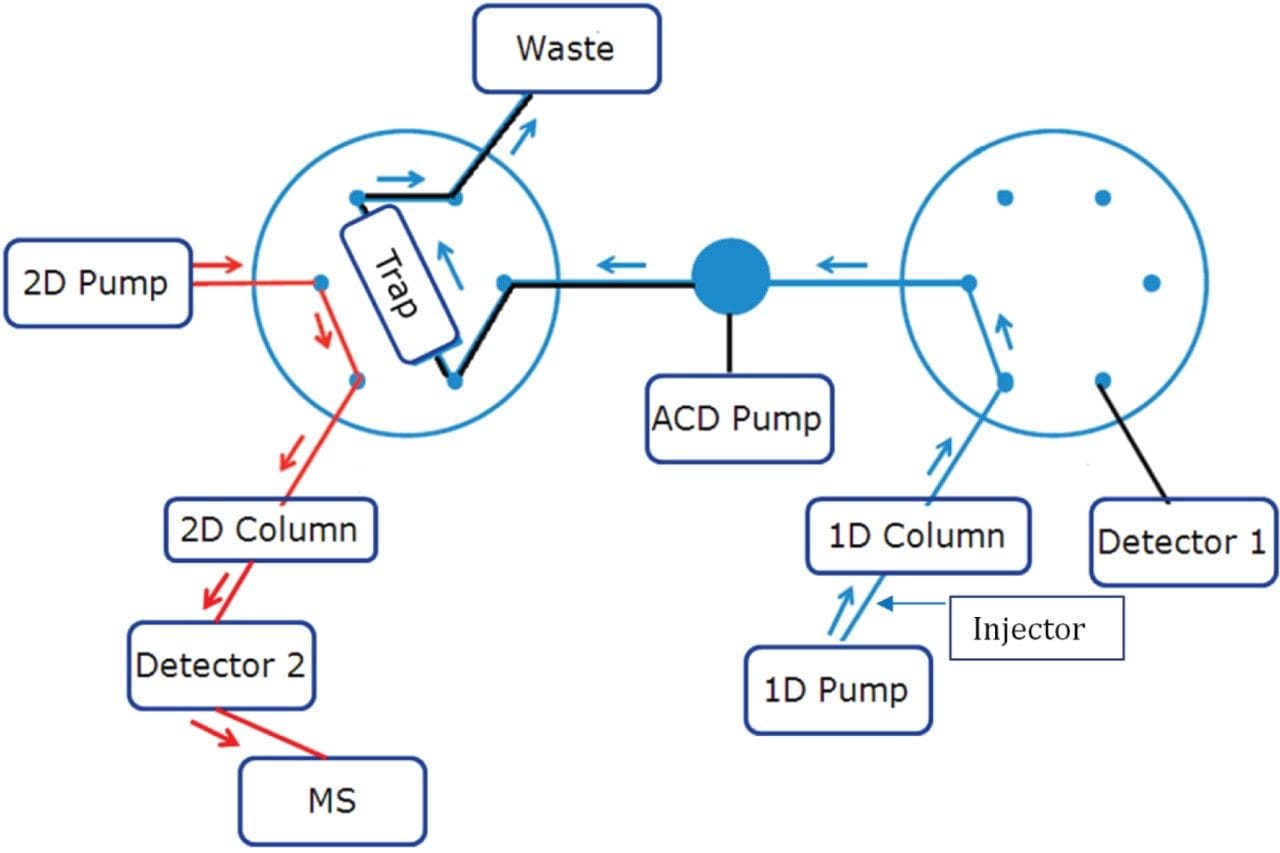
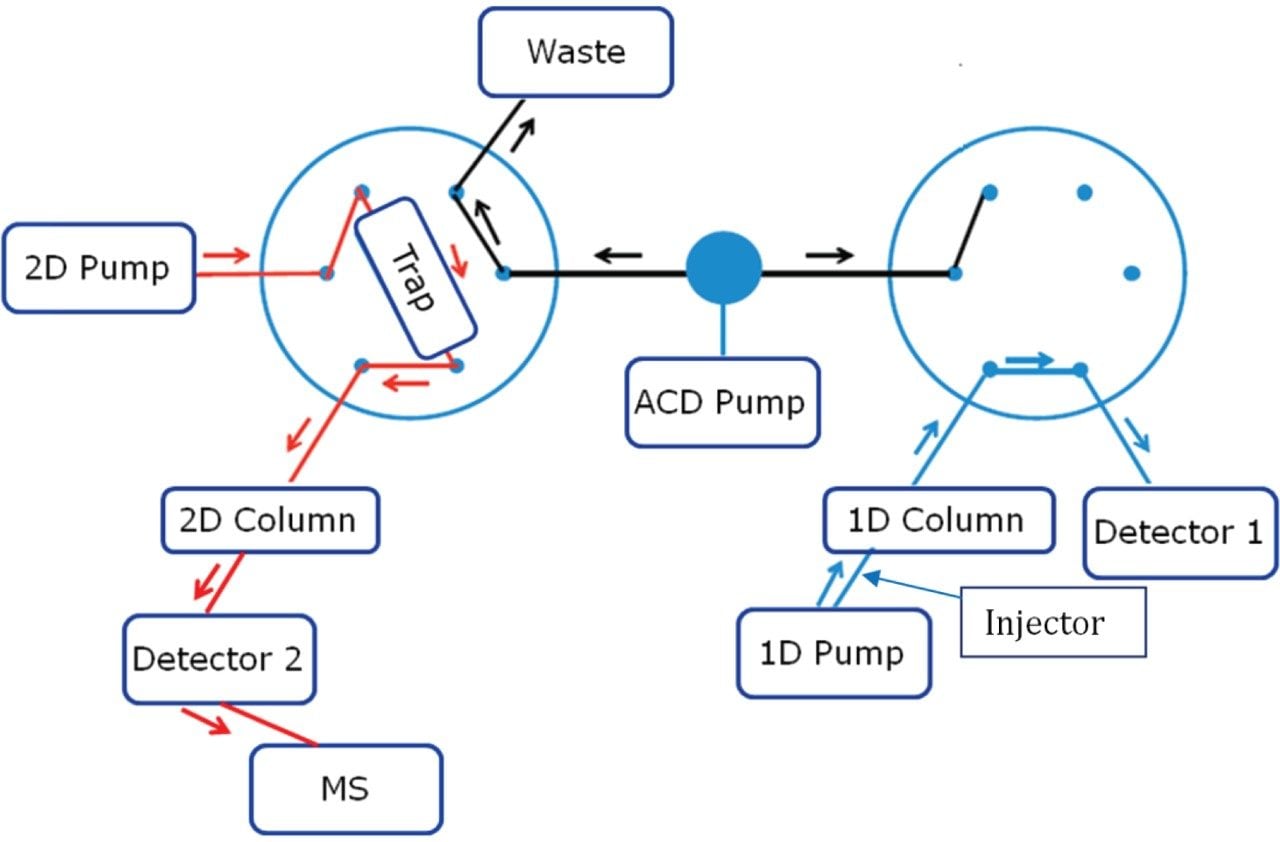
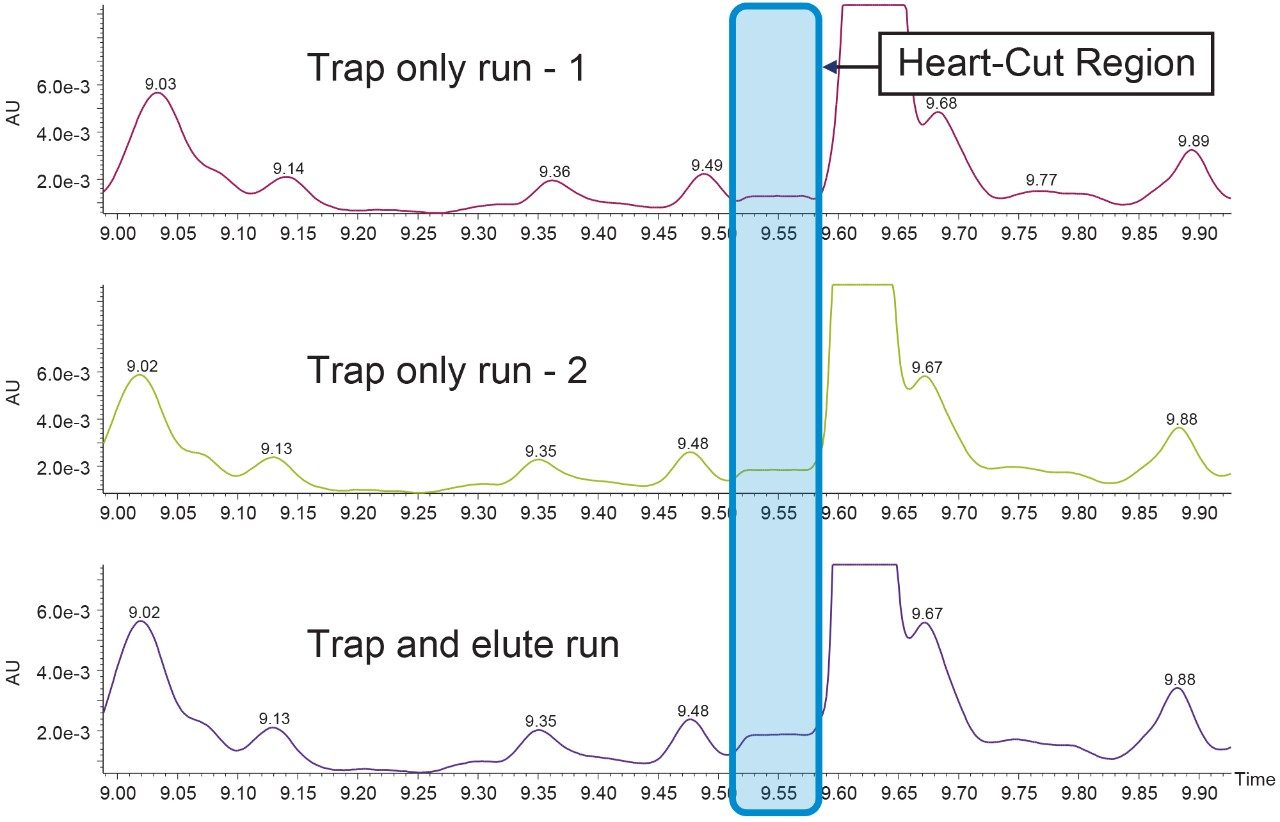
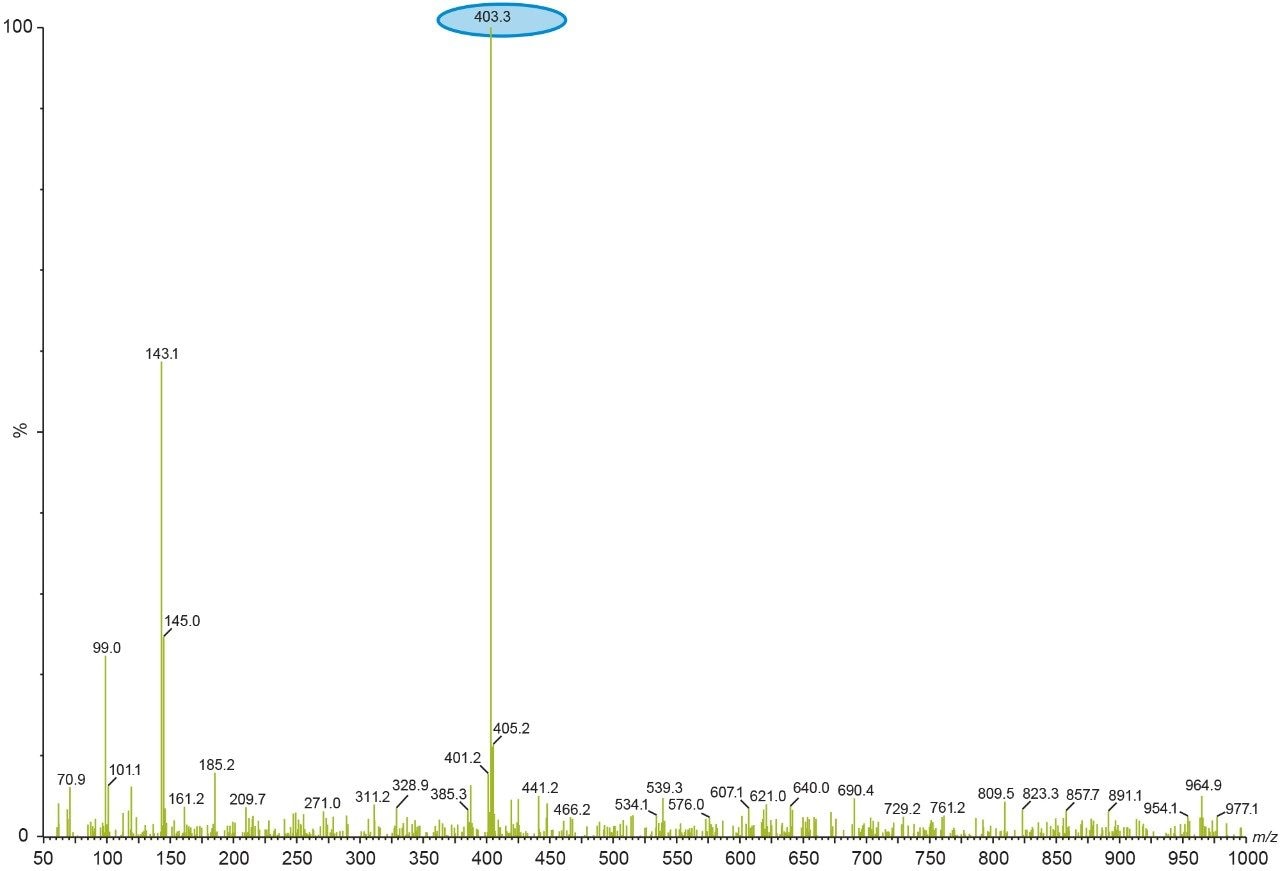
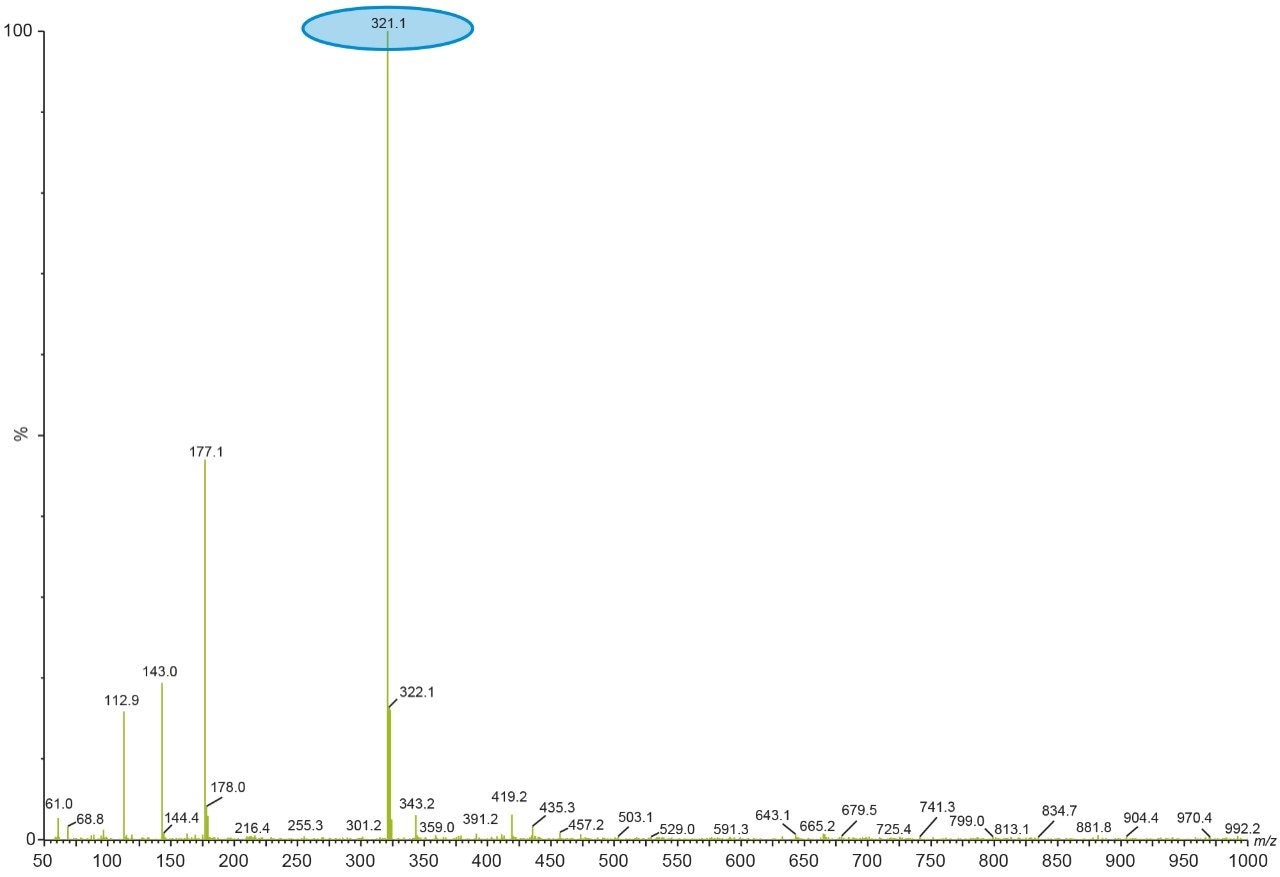
This process was repeated by making multiple first dimension injections and the peak of interest gets concentrated on the trap column. Here the selection of the trap column chemistry is very important, as it should be able to retain all the analyte. After making enough analyte load on the trap column, a second dimension pump with a MS compatible mobile phase was used to elute the analyte from the trap column and subsequently through a second dimension column for mass detection. The Xevo TQ Detector monitors the eluate in full scan mode to collect the full mass spectral information.
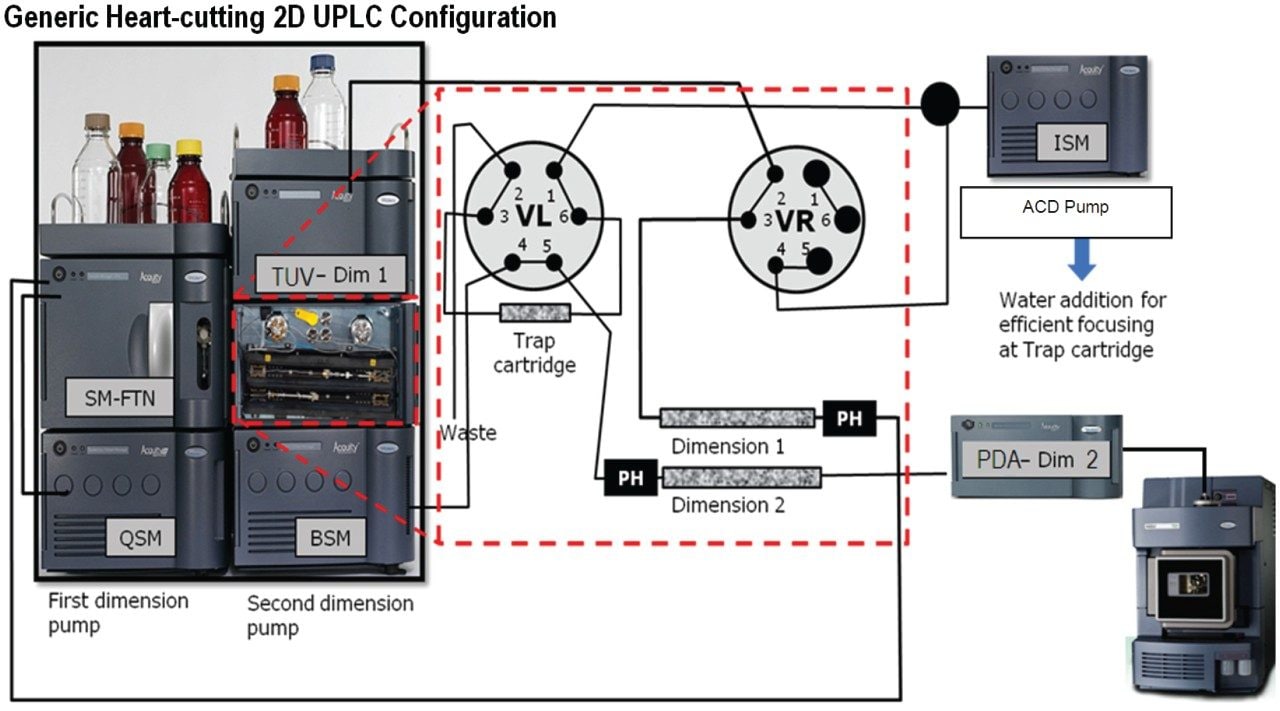
To execute these steps in the above protocol, a specific configuration of fluidic connections was made using the two, 2-position, 6-port valves of the ACQUITY UPLC Column Manager.
As mentioned, online sample concentration was done by making multiple first dimension injections and heart-cutting the peak of interest from each run and stacking it on the trap column. In this experiment, we are doing a total of three injections each for two peaks of interest. The first two injections will be only to trap the peak of interest on the trap column and the third injection will be a trap and back-flush run.
Figures 3 through 8 show the column manager plumbing and describe the key events associated with various steps in the peak transfer process.
Step 1: Initial condition (Left Valve Position 1, Right Valve Position 1)
Step 2: Trapping of peak of interest (Left Valve Position 1, Right Valve Position 2)
Step 3: Washing out the 1st dimension Mobile Phase (Left Valve Position 1, Right Valve Position 1)
Steps 1 through 3 are repeated by making injection on the first dimension column and the peak of interest is diverted and stacked on the trap column.
The third injection, which was going to be the trap and elute run was done and the steps from 1–3 are repeated as same as the first two injections. After giving enough time for the ACD pump to remove the non-MS compatible mobile phase from the first dimension and to equilibrate and focus the peak of interest from three different runs on the trap column, the following steps were used to back-flush the concentrated peak from the trap column to a second dimension column with a MS compatible mobile phase pumped through the 2D pump.
Step 4: Back-flush elution from trap column to second dimension column (Left Valve Position 2, Right Valve Position 1)
After this step, the complete gradient program is passed through the trap column to elute the trapped components to second dimension separation column with a MS compatible mobile phase pumped by the second dimension pump.
During a ‘heart-cut’, a specific volume of the non-MS compatible mobile phase, containing the peak of interest, was transferred to a trap column. If that ‘cut’ contains a high percent of organic, the analyte will be washed away through the trap column due to poor retention. By adding an additional aqueous dilution flow to the ‘cut’ volume prior to the trap column, the organic composition can be significantly reduced. A proper selection of trap column chemistry is very important to trap peaks which are eluting at higher organic concentrations.
A repeated run of the first dimension method is done to confirm the RT of the peaks to be analyzed on second dimension configured with Mass Spectrometer.
The RT window of the peak of interest (shown in Figure 8) has been noted and a two inlet method are made, Inlet method 1 for heart-cutting and trap, inlet method 2 for heart-cut, trap, and black flush elution. Two runs are made with inlet method 1 and a third run with inlet method 2 in a sequence.
After checking the reproducibility data of the heart-cut from first dimension (Figure 9), the analysis is done by injecting blank in the first dimension with the same experimental procedure mentioned above. The second dimension UV chromatogram of both blank and sample injection is used to compare and identify the peak of interest (Figure 11).
720006238, March 2018