• Application Note

Improving Quantitative Analysis of Red Wine Using the Xevo G2-XS QTof with SONAR Data Independent Acquisition (DIA)

Improving Quantitative Analysis of Red Wine Using the Xevo G2-XS QTof with SONAR Data Independent Acquisition (DIA)

  • Lauren Mullin
  • Yunpeng Zhen
  • Robert S. Plumb
  • Waters Corporation

This is an Application Brief and does not contain a detailed Experimental section.

Abstract

In this application brief we describe the use of a novel data independent acquisition (DIA) mode known as SONAR for generation of highly selective HRMS spectra on Waters Xevo G2-XS QTof.

Benefits

  • Provides flexible targeted and non-targeted analysis of phenolic compounds of interest in red wine.
  • Improved MS/MS spectral clarity afforded by SONAR without the need for method development or prior knowledge of the sample.
  • Provides data for quantitation and identification in a single injection.

Introduction

In recent years, there has been an increased use of non-targeted approaches for the characterization of food and beverages to complement quantitative targeted analyses. Application of these techniques to the analysis of wine have been employed to assess previously unknown contents of wine lees,1 patterns in glycosylated simple phenols across wine grape hybrid varieties,2 and metabolic profiling of pest resistant genotypes against their susceptible ancestor vines.3 In addition to generating quality high resolution mass spectrometry (HRMS) data, it is also important to ensure that the known analytes in these types of experiments can be quantified within relevant concentration ranges.

In this technology note we describe the use of a novel data independent acquisition (DIA) mode known as SONAR4,5 for generation of highly selective HRMS spectra on Waters Xevo G2-XS QTof. Targeted quantitative assessment of this technique is shown for three known phenolic compounds present in red wine: trans-resveratrol, catechin, and p-coumarin, highlighting the diverse applicability of SONAR acquisition.

Results and Discussion

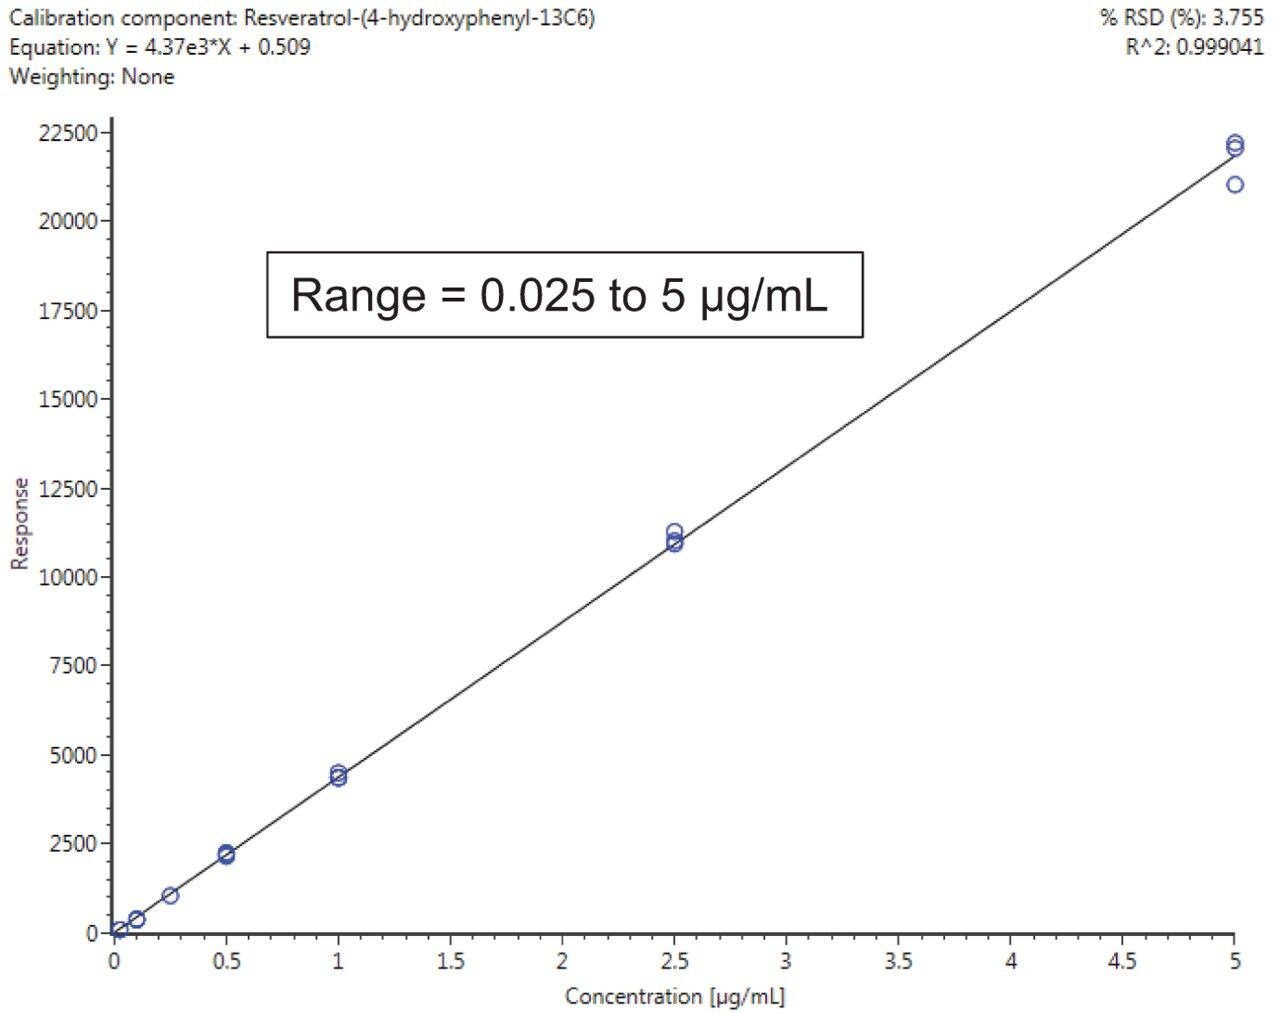
Eight red wine samples were purchased at a local retailer from various grape varieties were used in this study to assess linearity, LOD/Qs, and spectral clarity to aid in the identification of known compounds. Data was acquired using 10 μL injections and a SONAR window of 30 Da over the quadrupole mass scanning range of 100 to 700 m/z. Collision energy was set to 6 eV for ion transmission in the passive state, and a ramp of 20 to 45 eV for high energy. The Tof acquisition mass range was 50 to 1200 Da at an acquisition rate of 0.2 sec. Wine samples were prepared by initial 1:1 dilution with DI water, and centrifuged at 15,000 rpm followed by an addition 1:4 dilution with DI water. Diluted samples were then spiked with 13C-isotopically labeled standards of +/- catechin 2,3,4, 13C3, p-coumaric acid 1,2,3 13C3, resveratrol-(4-hydroxyphenyl-13C6), as internal standards and then as a matrix matched calibration curve.

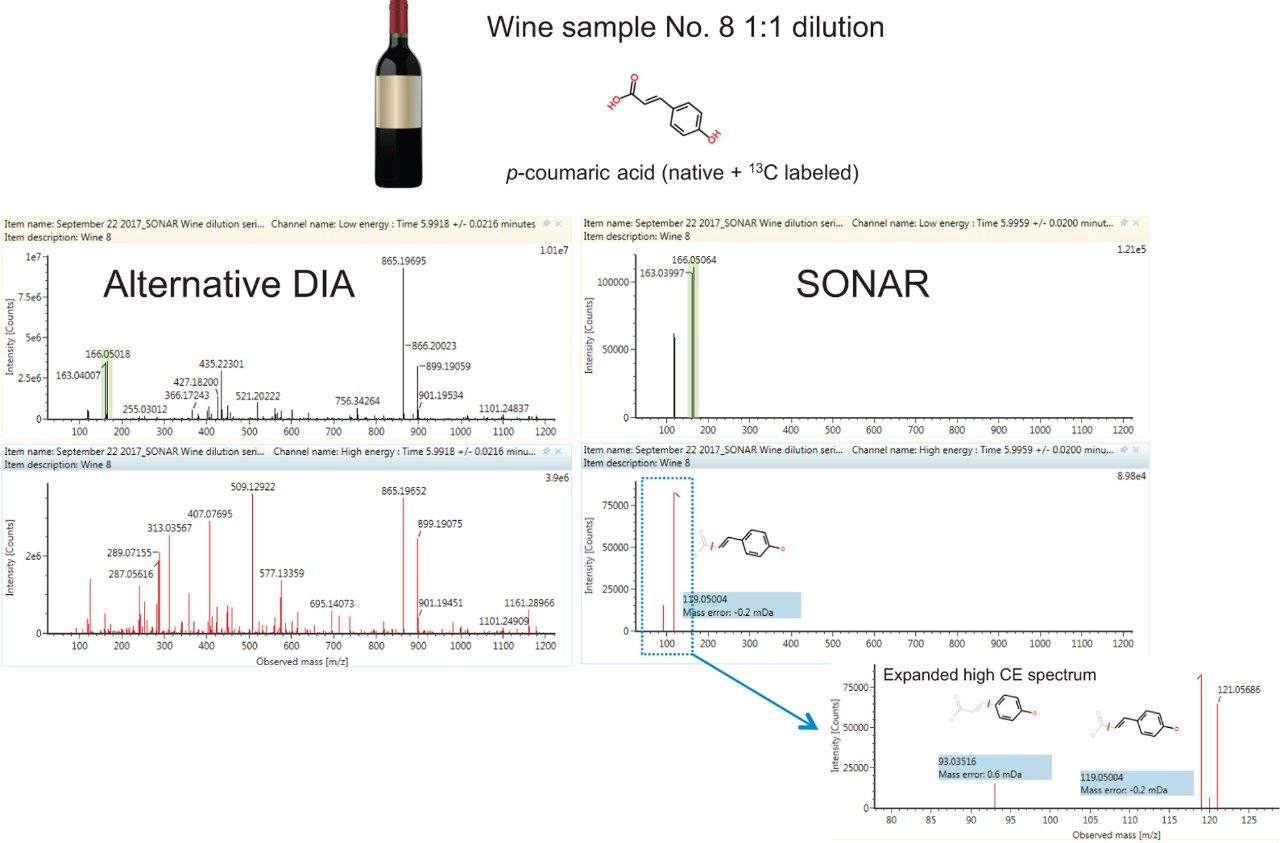
Figure 1 shows a comparison of observed spectra for p-coumaric acid in its native form and as a labeled standard in a 1:1 wine dilution. Data is filtered using the Spectrum view in UNIFI Software for the SONAR acquired data. A much cleaner spectra was obtained using this mass filter acquisition approach as demonstrated when we compared the SONAR approach to traditional DIA. Data was acquired using the same parameters with the exception of using a non-resolving quadrupole for ion transmission. The spectral clarity afforded by SONAR is what would be expected from an MS/MS experiment without the need for method development or prior knowledge of the sample.

Spectra for p-coumaric acid (both native and labeled) in red wine sample with enhanced selectivity as compared to full-spectral acquisition. Explanded high collision energy (CE) spectrum shows exact mass fragment structures and mass errors.
Figure 1. Spectra for p-coumaric acid (both native and labeled) in red wine sample with enhanced selectivity as compared to full-spectral acquisition. Explanded high collision energy (CE) spectrum shows exact mass fragment structures and mass errors.
13C-isotopically labeled resveratrol standard dilution series and linearity in a matrix matched (diluted wine 1:5) calibration curve.
Figure 2. 13C-isotopically labeled resveratrol standard dilution series and linearity in a matrix matched (diluted wine 1:5) calibration curve.

Calibration results for the labeled standards spiked into the wine samples as a matrix matched curve are summarized in Figure 2 for resveratrol-(4-hydroxyphenyl-13C6) and Table 1 for all compounds. Criteria for LOD/Qs were peak-to-peak signal-to-noise (S/N) ratios of 3 and 10 respectively, as well as a +/-5 ppm mass error tolerance.

Chromatographic peak widths were observed to be approximately 7 sec., with at least 12 points across the peak ensuring reliable quantification. Responses of the native forms of trans-resveratrol, catechin, and p-coumarin are shown in Figure 3. Measured concentrations from the labeled standard curves are shown as an average across the triplicate injections in each sample. As can be seen, the concentrations found in the diluted samples are generally within the calibration range, highlighting the relevance of the established quantification range achieved using SONAR for this application.

Responses of native phenolic species in wine samples with quantified concentrations against their isotopically-labeled calibration curves. Catechin responses were very high, across all wine samples, with the responses for p-coumarin and trans-resveratrol shown in the closeup. Concentrations in each wine are shown in the color coded table, with quantification possible for each analyte in every sample with the exception of trans-resveratrol in Wines 1 and 7.
Figure 3. Responses of native phenolic species in wine samples with quantified concentrations against their isotopically-labeled calibration curves. Catechin responses were very high, across all wine samples, with the responses for p-coumarin and trans-resveratrol shown in the closeup. Concentrations in each wine are shown in the color coded table, with quantification possible for each analyte in every sample with the exception of trans-resveratrol in Wines 1 and 7.
Summary of isotopically labeled standard calibration curve data for SONAR 30 Da window acquisition.
Table 1. Summary of isotopically labeled standard calibration curve data for SONAR 30 Da window acquisition.

Conclusion

In addition to providing highly specific and selective spectra from a DIA approach, the SONAR acquisition parameters implemented in this work are suitable for the quantification of targeted phenolic compounds of interest in red wine. Combined, these highlighted benefits express flexibility in high quality assessments of sample composition for both targeted and non-targeted analyses.

References

  1. Delgado de la Torre MP, Priego-Capote F, and Luque de Castro MD. (2017) Characterization and Comparison of Wine Lees by Liquid Chormatography-Mass Spectrometry in High-Resolution Mode. J. of Agri. and Food Chem. 63: 1116–1125.
  2. Barnaba C, Dellacassa E, Nicolini G, et al. (2017) Targeted and untargeted high resolution mass approach for a putative profiling of glycosylated simple phenols in hybrid grapes. Food Res. Int. 98: 20–33.
  3. Ruocco S, Stefanini M, Stanstrup J, et al. (2017) The metabolomic profile of red non-V.vinifera genotypes. Food Res. Int. 98: 10–19.
  4. Heywood D and Craven K. SONAR: Delivering MS/MS Data from a DIA Experiment. Waters White Paper no. 720006033en, July 2017.
  5. Gethings L, Hughes C, Richardson K, et al. Metabolomic Workflow Utilizing Rapid Microbore Metabolic Processing (RAMMP) in Conjunction with SONAR. Waters Application Note no. 720006072en, August 2017.

720006135, December 2017

Voltar ao início Voltar ao início