This application note discusses a comparative study between the ESI and UniSpray sources coupled to ACQUITY UPC2 for the analysis of a range of Active Pharmaceutical Ingredients (APIs).
A combination of UniSpray and ACQUITY UPC2 can result in significant increase in sensitivity for the analysis of some pharmaceutical compounds.
UniSpray expands the range of ionization sources available for analysis involving atmospheric pressure ionization MS techniques to facilitate the analysis of the broad range of analytes involved in pharmaceutical method development.
UniSpray-ACQUITY UPC2 increases the scope for method development and impurity analysis by providing orthogonal selectivity and specificity.
The manufacture of drug products is regulated by a number of national authorities with a strong emphasis on the purity of the drug substance. For new drugs that are about to be launched onto the market there is a regulatory requirement to identify impurities in the drug substance at a level of 0.1% or above.1 The most common approach in the pharmaceutical industry has been the use of reverse phase liquid chromatography (RPLC) with atmospheric pressure ionization (API) mass spectrometry (LC-MS).2 A number of compounds can be challenging, in that certain ones can show poor MS response. Additionally, some compounds are water sensitive and co-elution can be a major obstacle in some instances.
At typical LC flow rates (0.1 to 1 mL/min) investigations have shown that electrospray, (ESI) a form of atmospheric pressure ionization that produces large droplets with relatively low surface charge, is inefficient in producing gas phase ions which results in poor desolvation efficiencies.3 The ESI process uses a heated high velocity spray from a charged capillary tip typically held at 3 kV. UniSpray (USI) is a novel ionization source option similar to the ESI source. It is comprised of a high velocity nebulized spray from a grounded capillary closely positioned to a stainless steel cylindrical target rod (impactor pin), which is typically held at 1 kV. A schematic of the UniSpray source is shown in Figure 1.
The ion signal is optimized when the impact point of the spray on the target rod is off-center (Figure 2). The downstream gas flow from the nebulizer follows the curvature of the surface of the target rod; this is known as the Coanda effect.4 Under these conditions the ions and droplets are then directed toward the inlet orifice of the sample cone. One major difference between the two sources is that in the UniSpray source the high potential is applied to the impactor, whereas in the ESI source the voltage is applied to the spray capillary tip.
Using LC-MS, an increase in sensitivity has been observed for UniSpray compared with ESI in some instances.5 It is thought that this increase in sensitivity in UniSpray can be attributed to the creation of smaller droplets when the eluent spray impacts with the target rod followed by enhanced desolvation from the smaller droplets. These two techniques have similar effects of ionization, producing predominantly [M+H]+ or [M-H]- ions, yet their mechanisms appear to be subtly different.
Convergence Chromatography (CC) is a chromatographic technique similar to RPLC but instead of the weak mobile phase being aqueous it is replaced with supercritical carbon dioxide (CO2). Supercritical CO2 can be paired with a large number of different co-solvents to increase the solvating power. CO2 is miscible with the whole range of the eluotropic series opening up a very large choice of solvent selectivity. Methanol, isopropranol, ethanol, and acetonitrile are the most commonly used co-solvents.
The use of RPLC can be prohibitive for the analysis of water sensitive compounds. The use of ACQUITY Ultra Performance Convergence Chromatography (UPC2) which is easily hyphenated with MS is a sensible, efficient alternative.
Analytical method development of a drug product or drug substance can be very challenging because of selectivity and the possible presence of low level impurities. The broad range of analytes involved in pharmaceutical method development includes polar, non-polar, labile, and neutral compounds. The use of the UniSpray source because of the potential increase in response and the ability to analyze a broader range of compounds has the capability of offering efficiency gains to the method development process. The use of ACQUITY UPC2 as a complementary analytical technique to RPLC provides orthogonal selectivity and specificity which offers confidence in the quality of the product. Similar to RPLC, when using ACQUITY UPC2 some compounds can also show poor MS response, therefore it may be beneficial to investigate the use of the different ionization sources.
This application note discusses a comparative study between the ESI and UniSpray sources coupled to ACQUITY UPC2 for the analysis of a range of Active Pharmaceutical Ingredients (APIs).
The makeup flow required when using UPC2 is added post column prior to the splitter. The flow from the splitter goes both into the MS source and waste via a dynamic back pressure regulator. A schematic is shown in Figure 3. The original UniSpray probe consists of a single stainless steel capillary (130 µm I.D. × 560 mm long) from the outlet of the fluidics to the spray point inside the ion source enclosure.
For coupling with ACQUITY UPC2, the original UniSpray probe has been redesigned to prevent depressurization of the supercritical fluid occurring too early, which could result in sample loss to the probe walls. This probe is similar in design to the ESI probe but the wider bore PEEKSIL needle (usually 130 µm) has been replaced with a narrower bore PEEKSIL section (50 µm I.D.). The new probe consists of a PEEKSIL section (50 µm I.D. × 500 mm long) that bridges between the splitter and the inlet of the source; a stainless steel capillary section (50 µm I.D. × 210 mm long) is swaged onto the source end of the PEEKSIL. These improvements resulted in increased peak intensity and an improved robust performance.
When using ACQUITY UPC2 it is not possible to pass the flow from the splitter through the fluidics because of pressure considerations. For tuning purposes each of the APIs was prepared in the same solvent as the makeup flow (methanol, 2% water, and 0.1% formic acid). Using the ESI source 10 µL/min of each analyte was passed into the MS directly via the fluidics and both the single ion recording (SIR) and multiple reaction monitoring (MRM) parameters were optimized using IntelliStart. These parameters were used for all the experiments.
Concentrations of 10 ng/mL and 100 ng/mL solutions of the APIs listed in Table 1 were prepared in methanol. The samples were analyzed using the SIM and MRM conditions shown in Table 2 and run in triplicate.
System: |
ACQUITY UPC2 |
Column: |
ACQUITY UPC2 BEH 1.7 μm, 2.1 x 100 mm |
ABPR: |
2000 psi |
Column temp.: |
40 °C |
Sample temp.: |
15 °C |
Injection volume: |
2 μL |
Flow rate: |
2 mL/min |
Mobile phase A: |
CO2 |
Mobile phase B: |
Methanol |
Gradient: |
5% to 95% B at 1.5 min held until 2.1 min then 5% B |
Run time: |
3 mins |
Make up solvent: |
Methanol, 2% water, and 0.1% formic acid |
Make up flow: |
0.4 mL/min |
LC system: |
ACQUITY UPLC |
Column: |
ACQUITY UPLC BEH C18, 1.7 μm, 2.1 x 100 mm |
Column temp.: |
40 °C |
Flow rate: |
0.5 mL/min |
Injection volume: |
2 μL |
Solvent A: |
0.1% Formic acid in water |
Solvent B: |
0.1% Formic acid in acetonitrile |
Gradient: |
5% to 95% B at 1.5 min held until 2.6 min then 5% B |
Time: |
3.5 mins |
Data management: |
MassLynx software |
All the samples shown in Table 1 were run on the Xevo TQ-S micro using both the ESI and UniSpray source coupled to an ACQUITY UPC2 inlet.
From the preliminary full scan experiments all the analytes showed [M+H]+.
Both SIR and MRM experiments were run as shown in Table 2.
The resulting chromatographic peak areas were measured and the ratios of the responses of UniSpray to ESI are shown in Table 4.
As seen from Table 4, a concentration of 10 ng/mL ketoconazole showed little gain in the response between the ESI and UniSpray sources but all the other samples showed significant increases with the UniSpray source when compared to ESI. Compared with the electrospray response, enhancement gains of over ten were observed with the UniSpray source from acetaminophen, diclofenac, and trazodone. At this concentration, enhancements seen from both the SIR and MRM experiments were fairly consistent with each other (Figure 4).
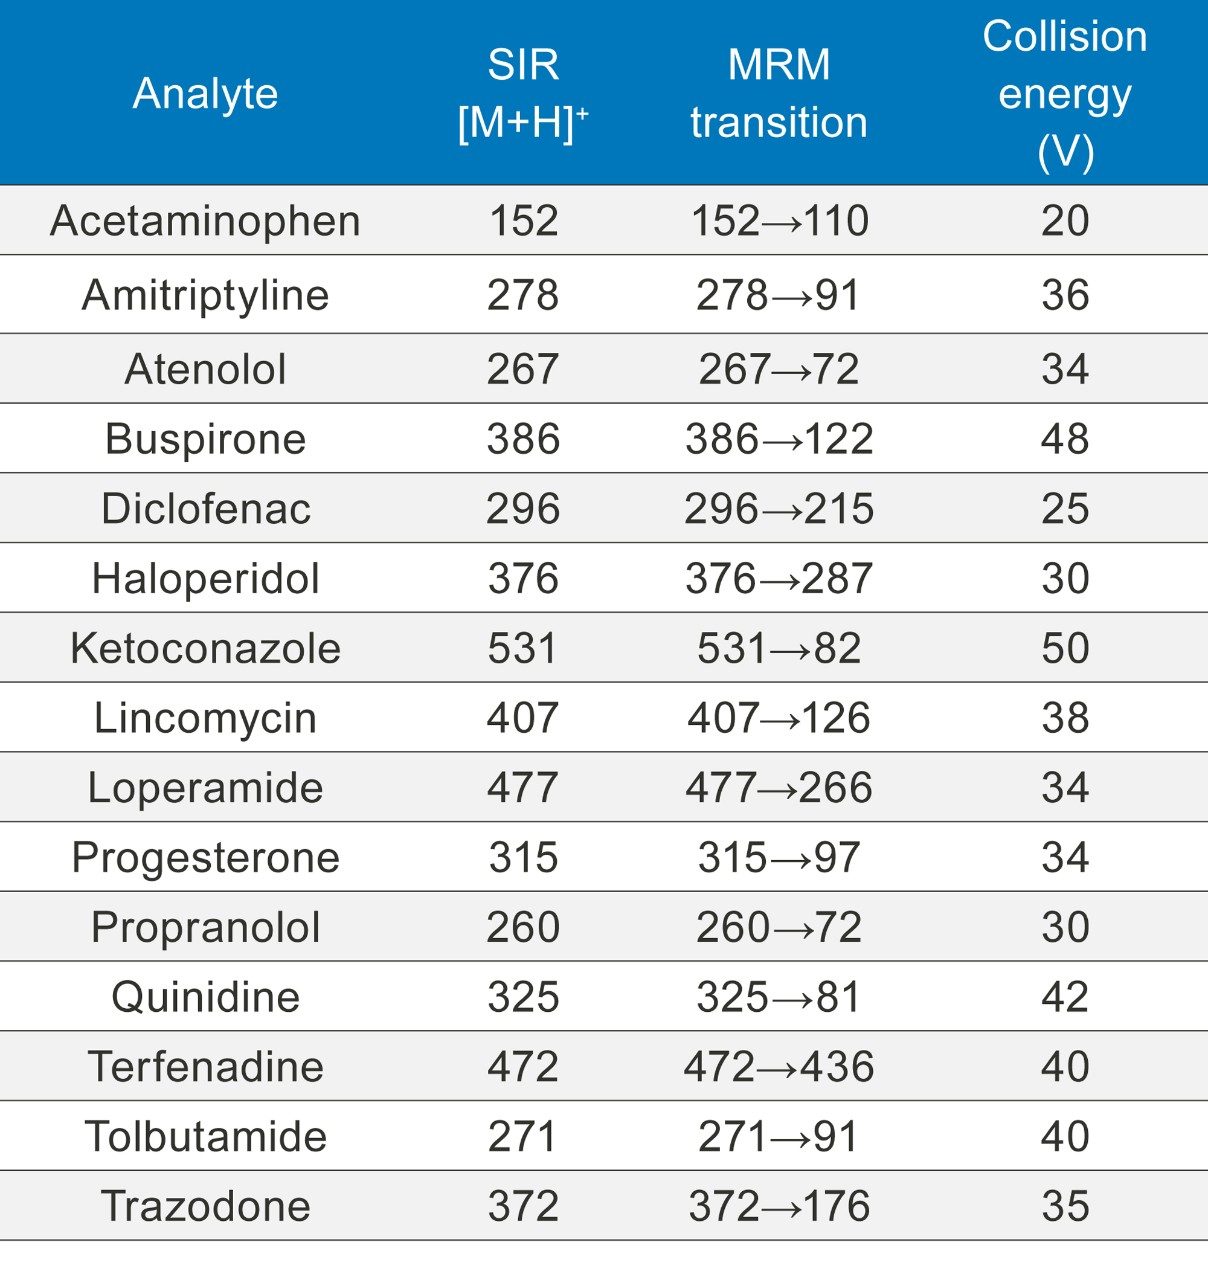
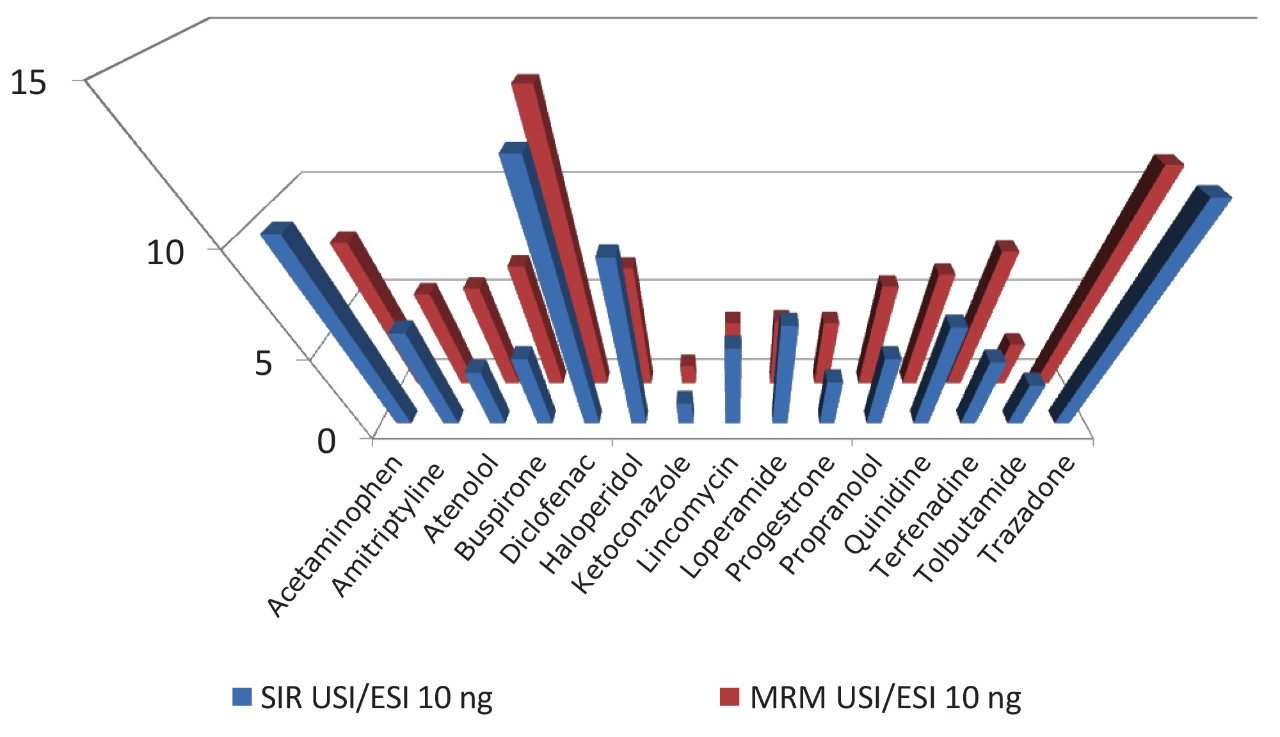
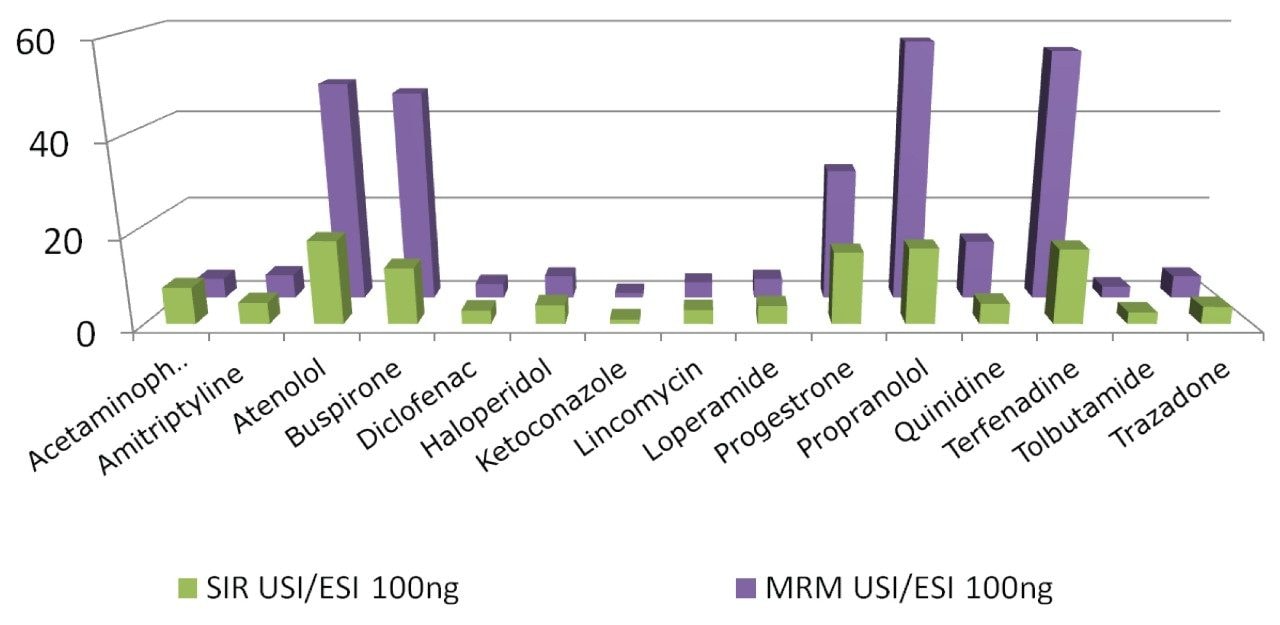
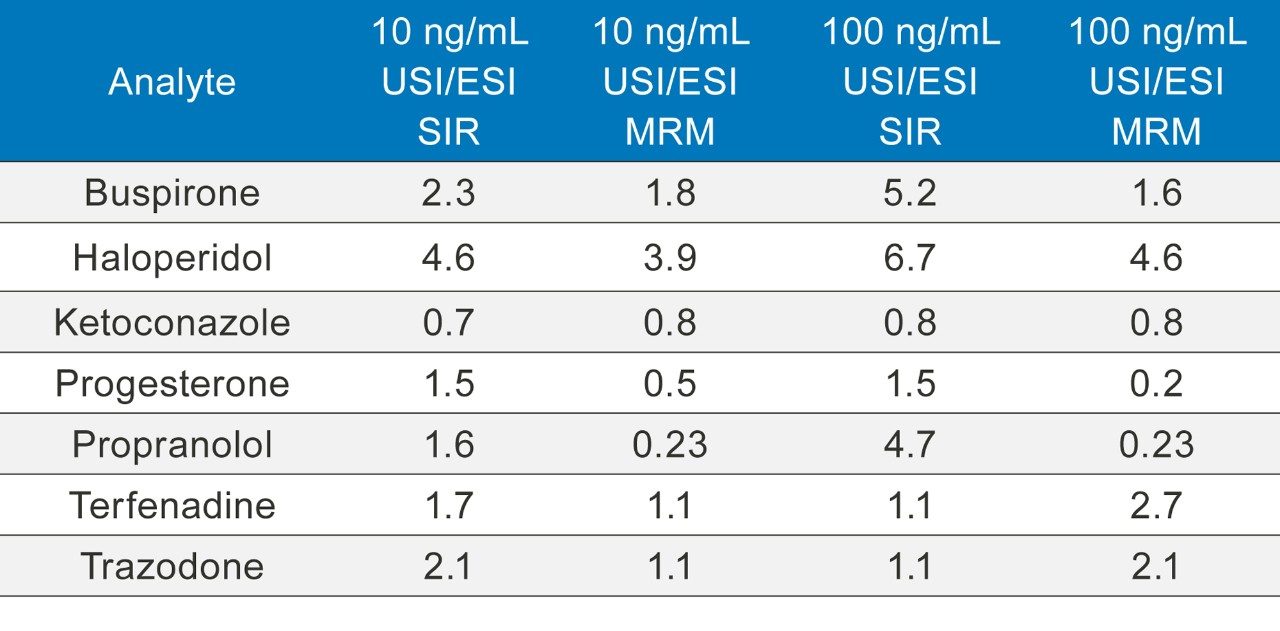
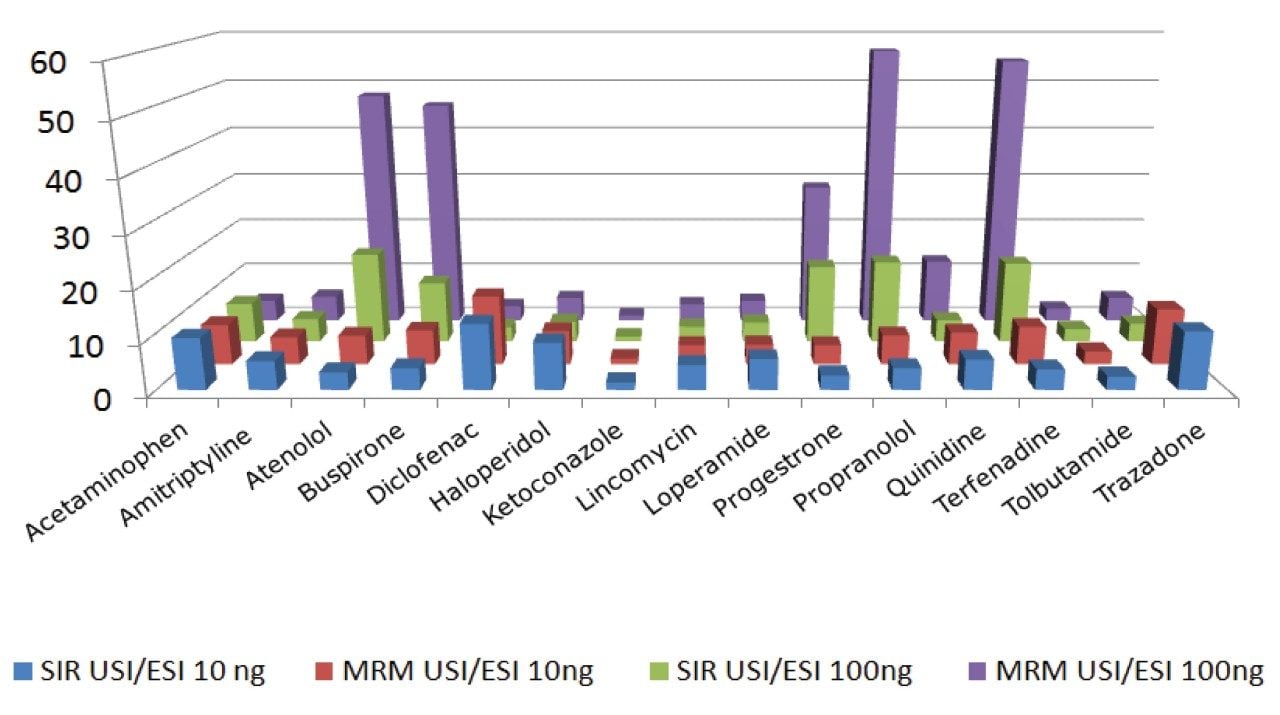
Similarly, all the analytes at the higher concentration, with the exception of ketoconazole, showed an increase in response from the UniSpray source for both SIR and MRM experiments (Figure 5.) The increase in response from diclofenac at the higher concentration was only 3 compared to 13 at the lower concentration as seen from Table 4. This was consistent in both SIR and MRM modes. This is difficult to explain because all the other analytes showed at least the same or increased responses. It is possible in the case of diclofenac that signal suppression was taking place at the higher concentration.
Atenolol, buspirone, progesterone, propranolol, and terfenadine in the higher concentration samples displayed distinctly elevated enhancement values when compared to the lower concentration samples (Figure 6). There was also more variability between the SIR and MRM responses at the higher concentration as shown by Figure 5. This marked difference between the SIR and MRM values was thought to be due to the effect of the double mass filtering shown by MRM experiments, which results in greater selectivity. As a consequence, the detected signal to noise ratio (S/N) measurement is higher, resulting in overall greater sensitivity from the MRM experiments.
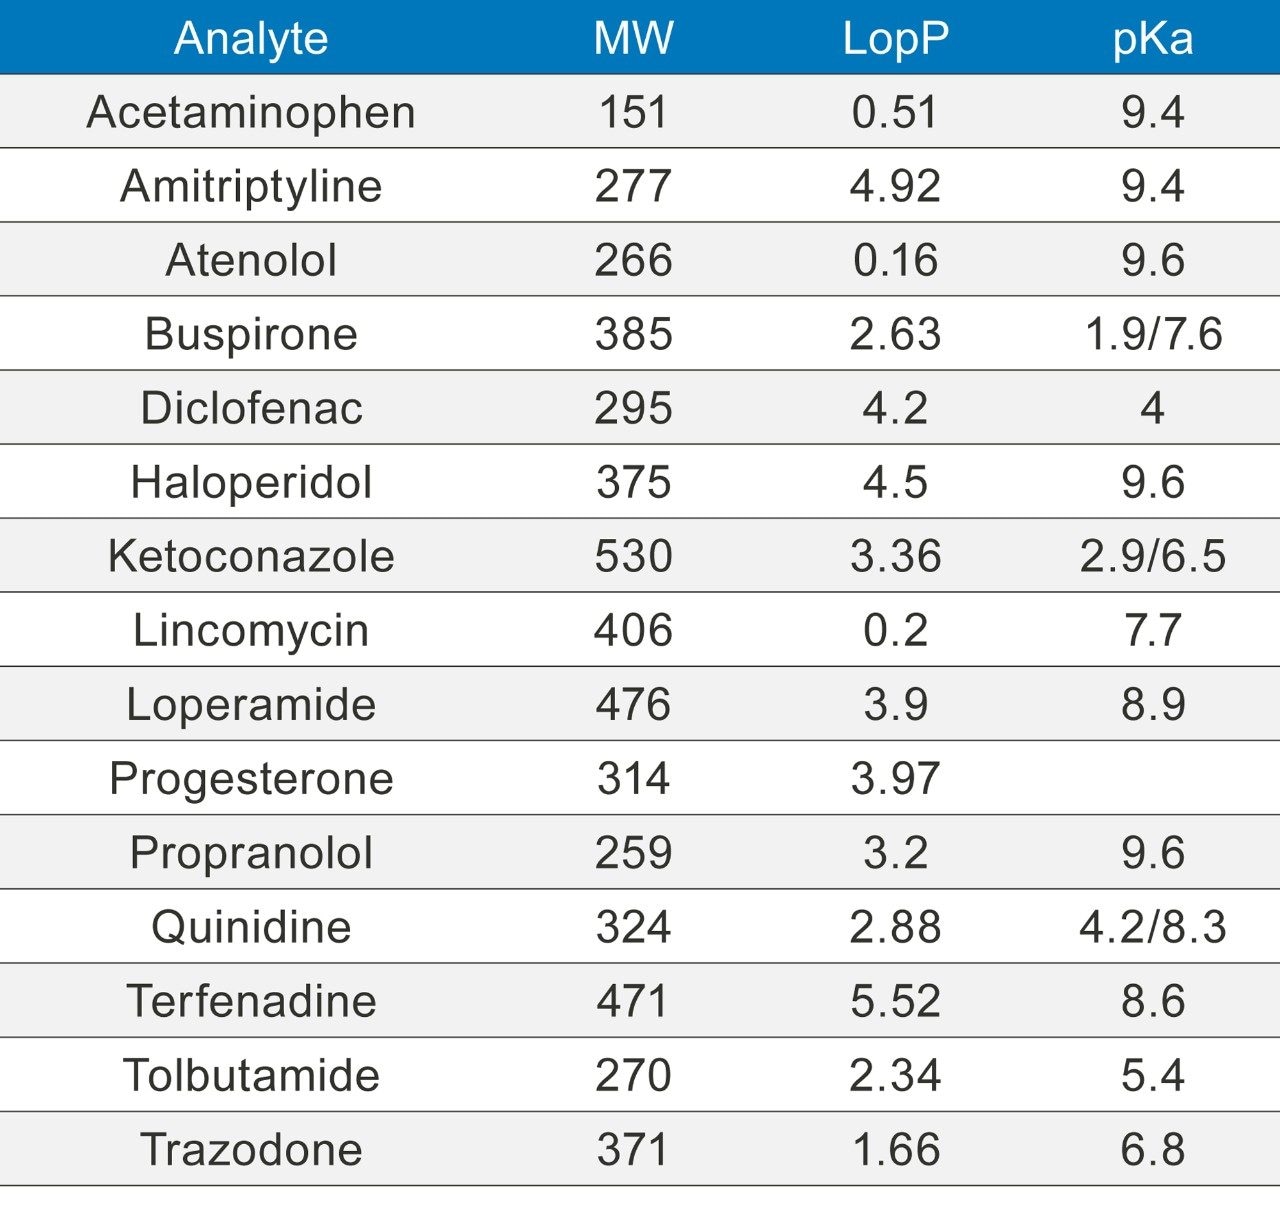
No correlation could be established between the observed enhanced responses from the UniSpray source with molecular weight, logP, and pKa of the APIs. This implies the enhancement effects of the UniSpray source are largely attributed to the ionization mechanism not to the chemical structure of the analyte.
To improve our understanding of the complex ionization mechanism involved in the UniSpray source, the ACQUITY UPC2 inlet was replaced by Ultra Performance Liquid Chromatography (UPLC), and using a limited number of the compounds (as seen in Table 5) the exercise was repeated using the same two concentrations and the same experimental conditions.
When coupled to UPLC, the UniSpray source showed an enhanced response when compared to the ESI, although the enhancements observed were even more favorable when coupled to the UPC2 inlet (Table 5). The UPLC experiments demonstrated more consistency in the responses for both the SIR and MRM experiments and the two concentrations of the APIs.
On installation of the UniSpray source the initial optimization of the analyte flow is crucial to the enhanced response shown. The efficiency of the source is maximized when the analyte flow is off center of the right hand side of the locator pin. The downstream gas flow from the nebulizer follows the curvature of the pin and is directed towards the inlet of the MS (Figure 2). This effect is believed to assist in the formation of much smaller droplets which allows for more efficient desolvation and as a result more ions are sampled by the MS.
The combination of USI coupled with UPC2 shows an increase in sensitivity when compared to the UniSpray source coupled to UPLC. This enhancement is attributed to the fact that ACQUITY UPC2 uses supercritical CO2 as the weak mobile phase in place of water. When CO2 is mixed with the modifier and makeup flow, the super critical phase is not maintained but the high pressure is preserved during the period of the chromatographic analysis. When the high pressure flow reaches the capillary tip, it undergoes a rapid expansion and is released as a gas. This phenomenon is believed to modify the solvent formation at the capillary tip and as a result much smaller primary droplets are produced than during the process with UPLC. Another factor which is thought to contribute to the enhancement shown by the ACQUITY UPC2 is the fact that a minimal amount of water is used in the mobile phase in ACQUITY UPC2 which allows the desolvation process to be more efficient because of lower surface tension and higher volatility of the solvent.
720006286, May 2018