

For research use only. Not for use in diagnostic procedures.
- Main
-
For research use only. Not for use in diagnostic procedures.
Anthony Midey, Lisa Towers, Emmanuelle Claude, Joanne Ballantyne, Robert Plumb
Waters Corporation, United States
Published on November 12, 2026
For research use only. Not for use in diagnostic procedures.
This application note showcases the applicability of the XevoTM TQ Absolute XR Mass Spectrometer coupled to a DESI XS source for drug metabolism and pharmacokinetics (DMPK) applications, allowing imaging of targeted analytes from in-vitro and in-vivo assays. In this study, we perform targeted DESI mass spectrometry imaging (MSI) to map the effects of methapyrilene administration on liver as a function of dosage and time. Rats were dosed at two concentrations of the drug and sacrificed at various timepoints post dose. Ion images show detection and visualization of the drug, its major metabolites, and key endogenous metabolic markers of methapyrilene-induced liver damage showing clear trends with dose and time. Distinct localization of the drug and related compounds in the rat liver provided complementary spatial information to previous LC-MS analysis of urine. Endogenous metabolic changes allow correlation between drug or metabolite localization and metabolic changes. DESI MS imaging enables both drug and drug metabolite distribution to be determined, may highlight endogenous pathways affected by drug administration leading to more detailed investigations of specific areas or structures within the affected organs, it provides more granularity and precision to DMPK/toxicology studies.
In drug discovery, early studies on lead compounds are designed to identify compounds likely to have appropriate DMPK properties. Candidates that show promising results in-vitro are progressed to in-vivo studies where typically their pharmacokinetic properties are determined using LC-MS analysis on plasma, urine, or homogenized organ tissue. Once a drug candidate has progressed to in-vivo studies, a deeper understanding of the disposition of emerging candidate drugs and their metabolites in organs and tissues can be gained.
As a candidate progresses further through the DMPK pipeline, unexpected localization is investigated using radio-labeling and whole-body autoradiography. This can be costly and is usually only reserved for the late-stage candidates. If during this step, it is found that the compound localizes somewhere unexpected and/or causes unexpected negative biological effects elsewhere within the organism then it may require discontinuation and the resources utilized to progress the compound to late-stage development could be wasted.
MSI is a powerful tool enabling a user to identify exogenous or endogenous compounds and provide visualization of spatial localization within a tissue or organism.
DESI MSI utilizes a spray of charged microdroplets to desorb and ionize molecules from a tissue section surface. Sample preparation is kept to a minimum, and often analysis is conducted on a fresh-frozen tissue sample after a cryosectioning step. MSI using DESI requires significantly less sample preparation than extraction of analytes from tissues for LC-MS. Significantly, DESI-MS has the great advantage over tissue homogenization that the spatial distribution information, lost when tissues are extracted for LC-MS, is retained. Once a tissue has been sectioned, DESI analysis needs no further sample preparation, meaning fewer steps where losses of analytes may occur, for example due to extraction inefficiency or through adherence to vessels, which cannot be monitored without the use of radiolabels. Another advantage of DESI-MSI is that, during analysis, there is minimal disruption or damage to the surface of the tissue, allowing for multiple analyses of the same tissue area or the ability to utilize the same tissue section for orthogonal techniques such as histological staining. This enables a deeper dive and more complete picture when investigating the biological effect of a drug when compared to using homogenized tissue extracts for analysis by LC-MS methods. MSI is much more cost effective than radio-labeling each potential drug candidate, and as such, MSI can be employed earlier within the drug development and candidate selection to investigate compound localization and discount harmful compounds sooner, potentially saving time and resources on failed late stage candidates.
In addition to investigating the tissue localization of the drug and its metabolites without the need to radio-label the drug, DESI can also detect localized endogenous lipidomic or metabolomic changes. Such data may be useful in both drug discovery and development, highlighting correlations between tissue concentrations of the drug or its metabolites and endogenous metabolite changes. DESI MSI enables expected metabolic changes to be verified within specific areas or structures within the target organs, alongside confirmation of presence of the drug and/or its metabolites. In addition, it can be used to highlight unexpected toxicological pathways in target organs and find off-target pharmacological or physiological changes in other areas of the organism, giving increased confidence in any investigation with significantly more tissue structure granularity than can be achieved with techniques requiring tissue homogenization.
Methapyrilene is a histamine H1 receptor antagonist (antihistamine) and anticholinergic brought to market in the 1950s as an oral anti-allergy medication. It was quickly discovered to be an effective over-the-counter sleep aid and subsequently included in insomnia medications and routinely used to help infants form a consistent sleep pattern.1 Although the compound has now been withdrawn from general sale, methapyrilene remains a model compound for DMPK studies, demonstrating hepatotoxic and carcinogenic properties (attributed to the thiophene ring) after long-term administration to rats.2-4
Male Wistar rats were orally dosed with methapyrilene in three dose groups: 0 mg/kg/day (vehicle/control), 50 mg/kg/day, and 150 mg/kg/day for five consecutive days. Urine was collected overnight (16 hours) from each dose group: day 0-1, day 2-3, and day 5-6 post-dose. Animals in the three groups were sacrificed at 2, 4, and 6 days after the first dose to obtain liver samples for sectioning and MSI.
For LC-MS, metabolite profiling of the urine sample preparation was as follows: 50 µL of urine was diluted with 200 µL of acetonitrile-methanol (90:10), vortexed to mix, and centrifuged to remove any particulates. The supernatant was diluted 10x into LC-MS grade water prior to transfer into autosampler vials for analysis. Untargeted LC-MS screening of the extracts was performed using MSE data independent analysis (DIA), where successive low collision energy and high collision energy MS full scan spectra were acquired.
For DESI MSI, fresh-frozen rat livers were cryosectioned at 10 µm thickness and thaw mounted onto standard glass microscope specimen slides, the sections were analyzed with no further treatment. DESI targeted imaging using multiple reaction monitoring (MRM) was performed on a Xevo TQ Absolute XR Mass Spectrometer coupled to a DESI XS source, equipped with a high-performance sprayer (HPS) and a heated transfer line (HTL). Images represent the MS/MS product ion intensity from a defined precursor at each pixel coordinate in the defined acquisition area, acquired for every MRM in the experimental method for every pixel.
|
MS system: |
SELECT SERIES™ MRT |
|
Polarity: |
Positive ESI |
|
Column: |
2.1 CORTECS™ C18 Column 1.6 µm |
|
Column temperature: |
40 °C |
|
Mobile phase A: |
Water, 0.1 % formic acid and 1 mMol ammonium formate |
|
Mobile phase B: |
Acetonitrile:Water (95:5), 0.1 % formic acid (v/v) and 1 mMol ammonium formate |
|
Flow rate: |
600 µL/min |
|
Gradient: |
99% A 0-1 minute, 99-85% A 1-3 minutes, 85-50% A 3-6 minutes, 50-1% A 6-9 minutes, 1% A 9-10 minutes, re-equilibrate 10-12 minutes |
|
Capillary voltage: |
1.0 kV |
|
Source temperature: |
150 °C |
|
Desolvation temperature: |
300 °C |
|
Nitrogen flow: |
50 L/Hr cone, 600 L/Hr desolvation |
|
Scan range: |
50-1200 Da |
|
Collision energy: |
Ramp 10-50 eV |
|
Lock mass: |
200 pg/mL Leucine-Enkephalin (LeuEnk) every 30 s |
|
MS system: |
Xevo TQ Absolute XR Mass Spectrometer |
|
Polarity: |
Positive DESI |
|
Capillary voltage: |
0.65 kV |
|
Cone voltage: |
30 V |
|
Source temperature: |
120 °C |
|
Nitrogen flow: |
0.9 bar |
|
Solvent: |
98% methanol:2% Water 0.01% formic acid (v/v), with 200 pg/mL Leu-Enkephalin |
|
Solvent flow rate: |
2 µL/min |
|
Heated transfer line temperature: |
30 °C for drug analysis/300 °C for lipid analysis |
|
Pixel size: |
75 µm |
|
MS scan speed (dwell time): |
3 scans per second |
LC-MS data were processed using MassMetaSite™ (Mass Analytica) with a 0.5 ppm mass accuracy filter and drug metabolites identified through the following mechanisms: the loss of the thiophene ring, oxygenation, demethylation, and N or O glucuronidation.
MSI data were acquired and processed through MassLynx™ Software (v4.2) prior to being visualized in High-Definition™ Imaging (HDI™) Software (V1.9.1).
A) Discovery DMPK LCMSE
As described in the method section, the male Wistar rats were divided into three groups: a control (vehicle – no drug), an oral dose of methapyrilene at 50 mg/kg/day for five days, and an oral dose of methapyrilene at 150 mg/kg/day for five days. Methapyrilene and its key metabolites detected in urine utilizing LC-MSE functionality elucidated the associated MS/MS transitions required for a tandem quadrupole MS analysis workflow. Livers from the sacrificed animals were sectioned and analyzed by DESI-Xevo TQ Absolute XR Mass Spectrometer using MS/MS precursor to product ion transition based upon the LC-MSE discovery experiments.
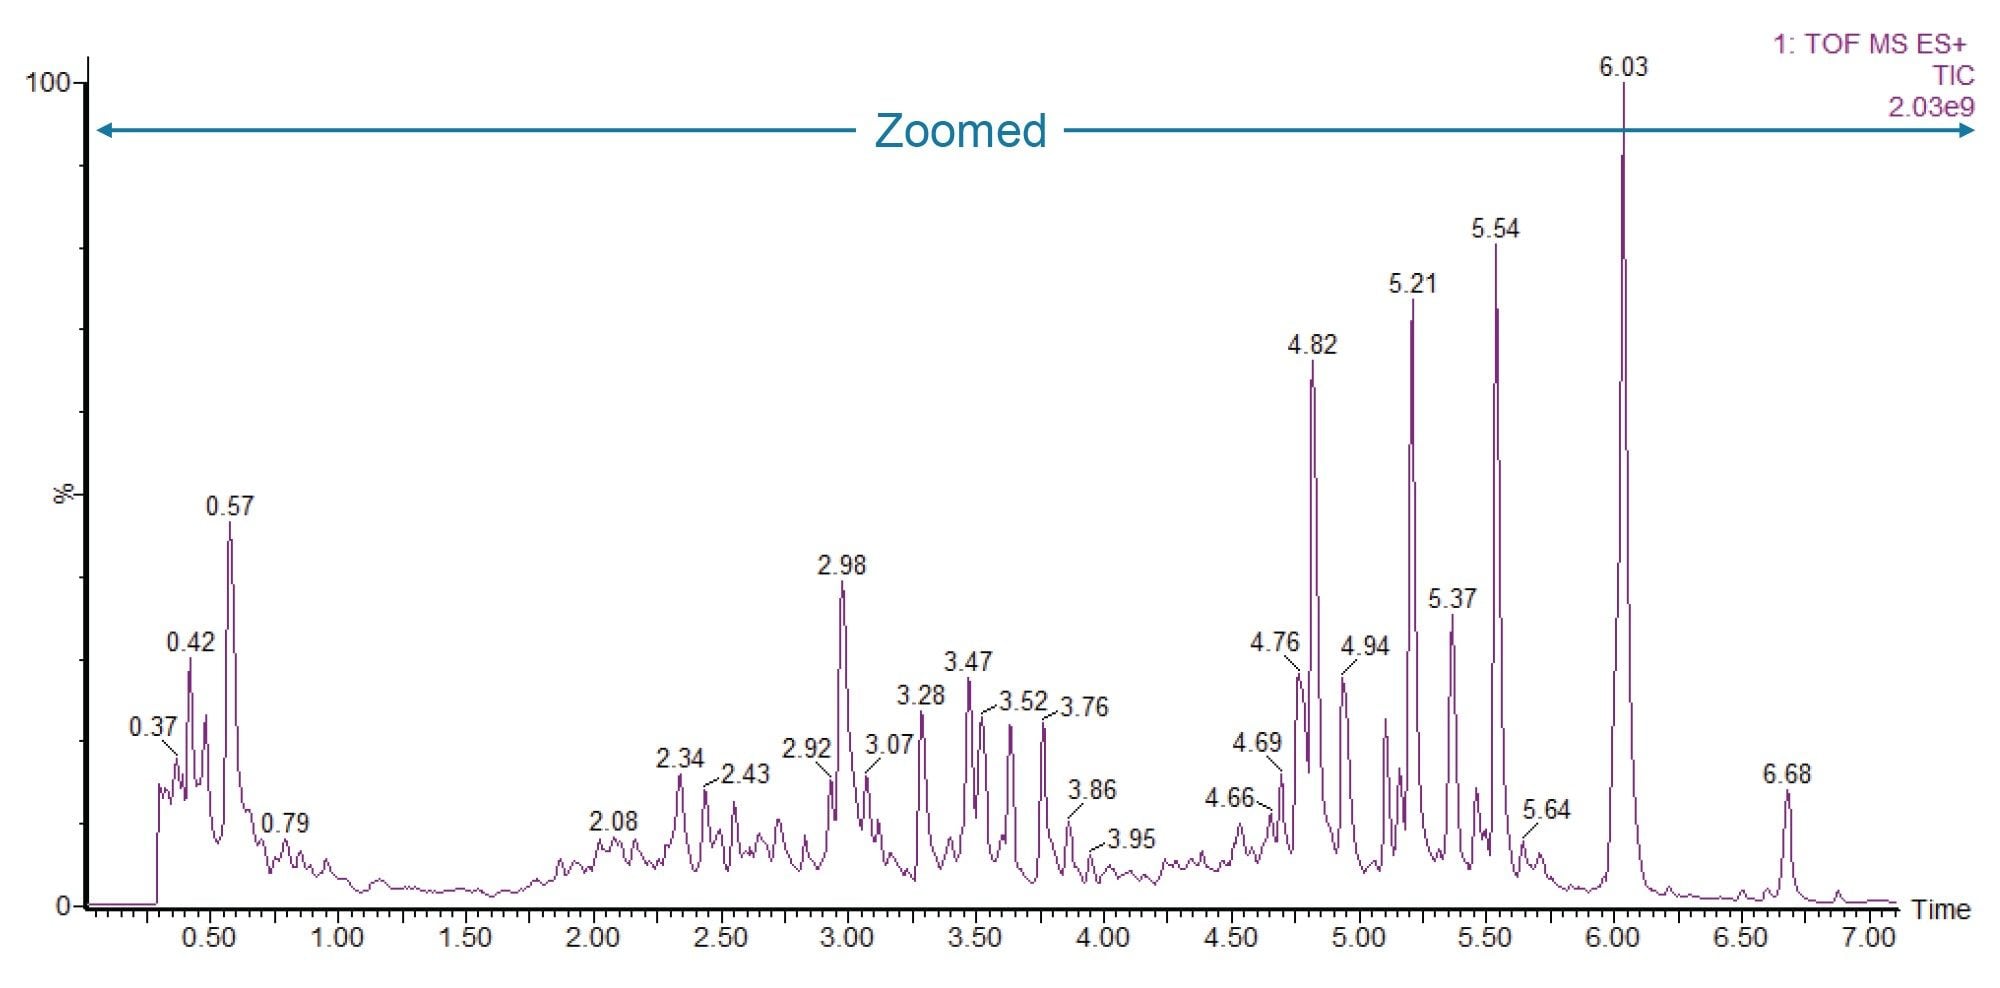
The LC-MS analysis of urine found methapyrilene and multiple drug metabolites within day 2-3 and day 5-6 overnight collections, with minimal detection in the day 0-1 overnight collection.5 An example total ion chromatogram (TIC) zoomed in to display the compounds eluting during the first seven minutes of acquisition can be seen in Figure 1.
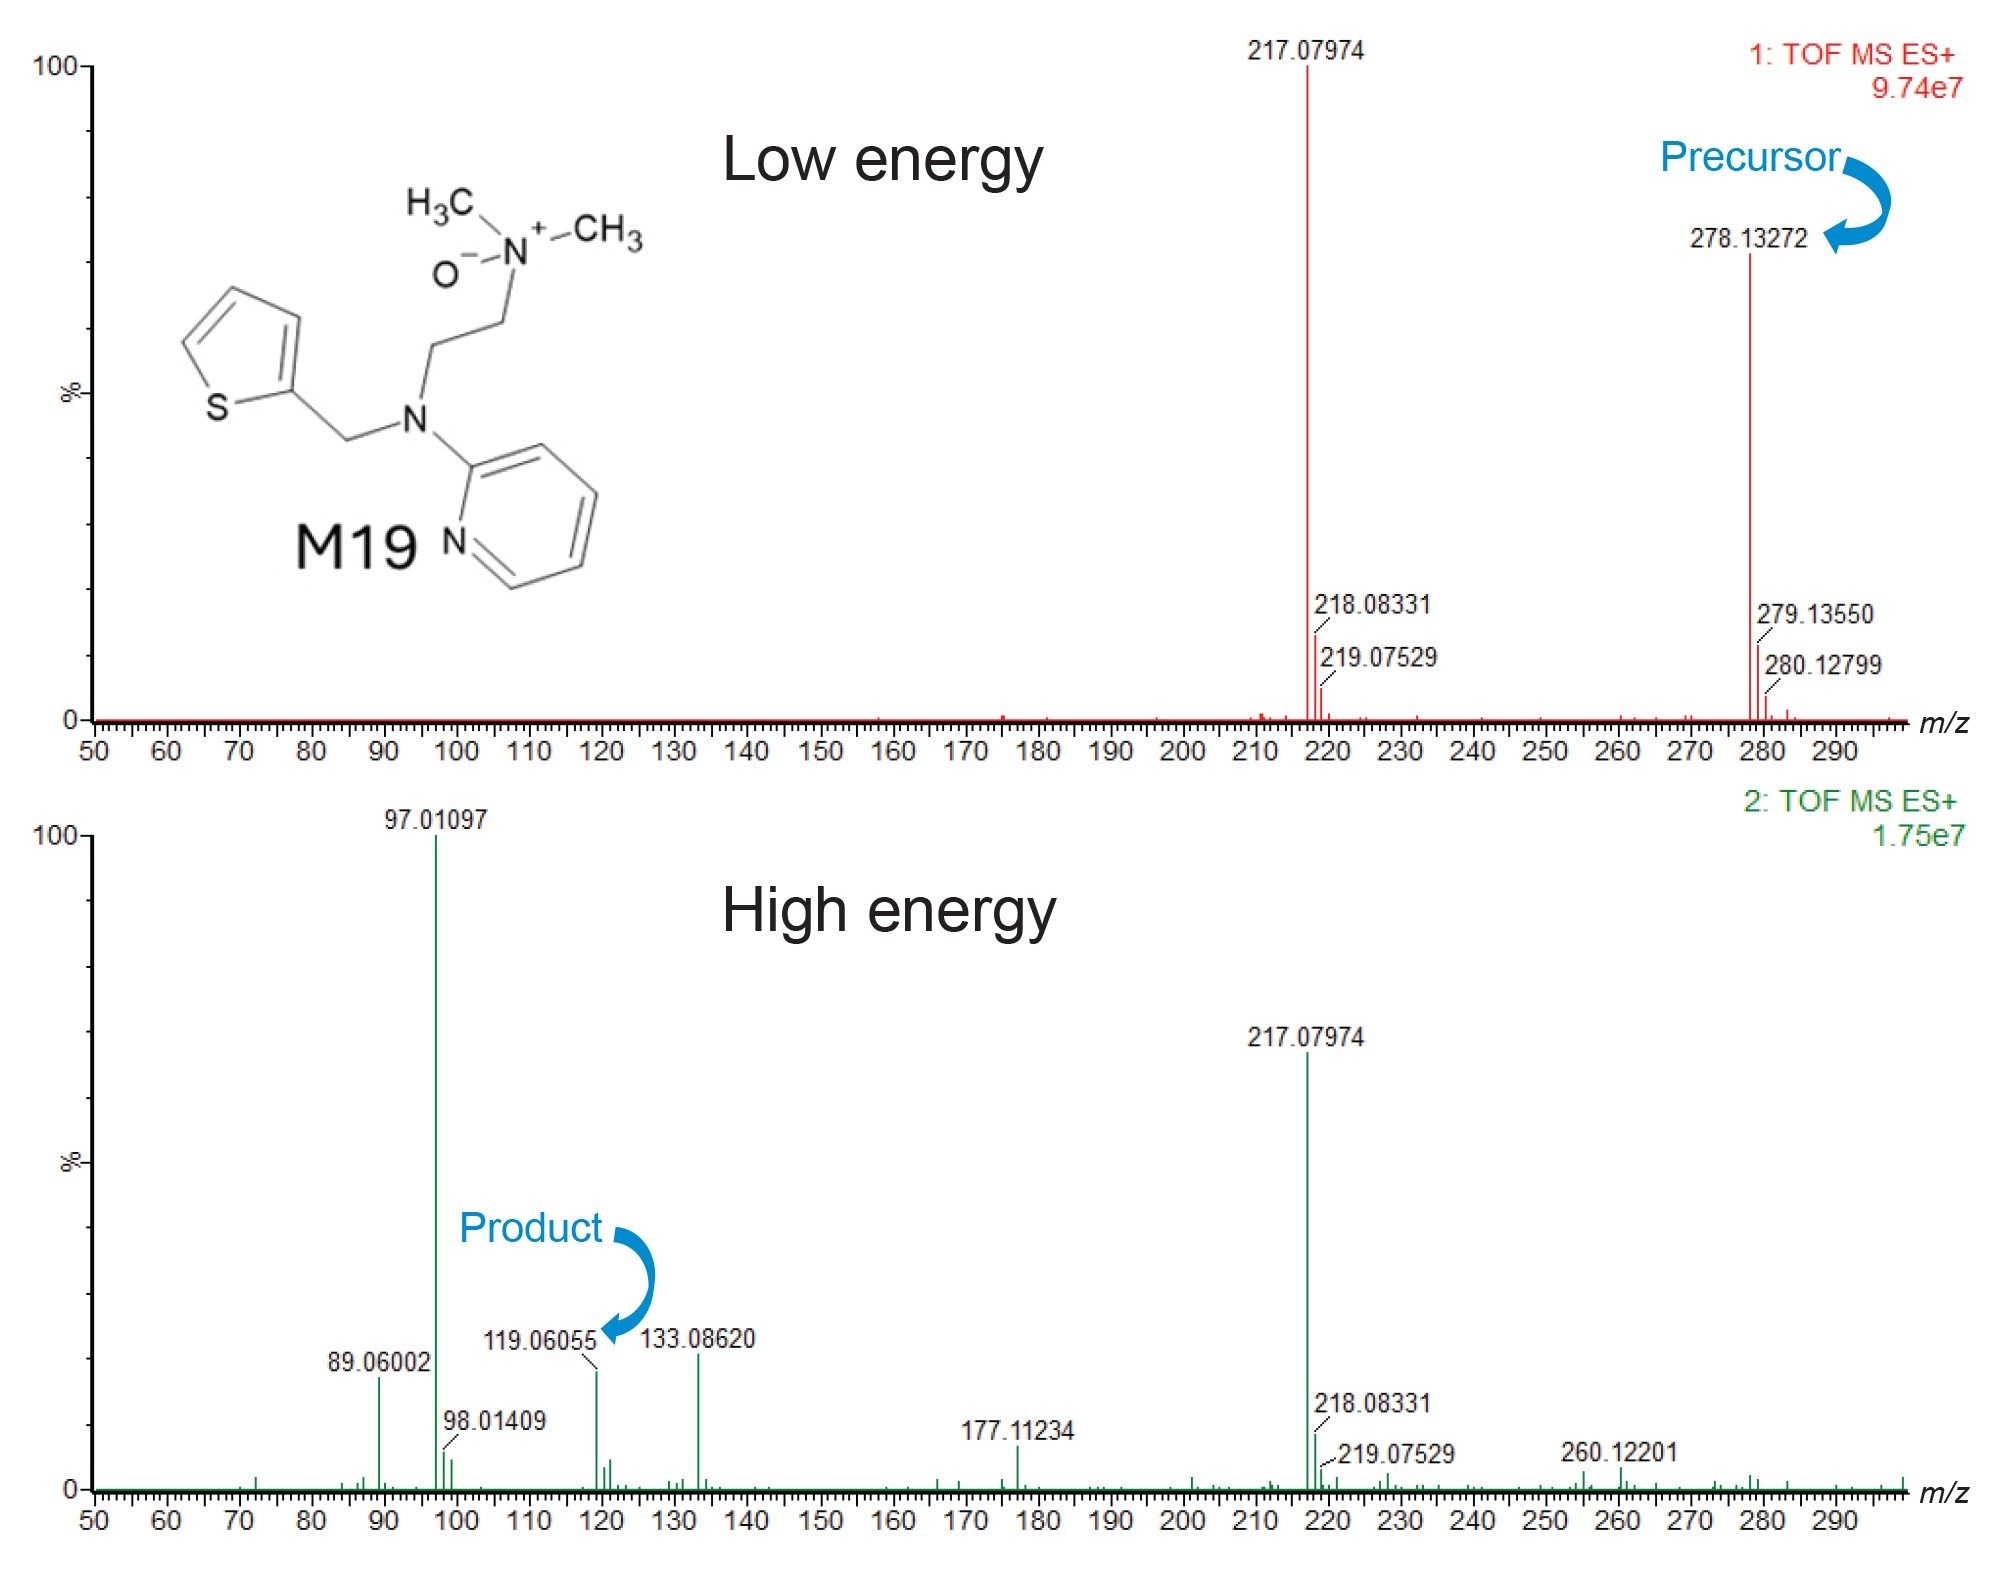
From this LC-MSE analysis, fragmentation data were available for each of the observed metabolites. Figure 2 shows an example set of extracted mass spectra from this analysis. The methapyrilene metabolite ‘M19’ detected in Figure 2 was formed through N-oxidation on the tertiary amine of the drug. The top spectrum (red) is the low collision energy mass spectrum showing the ‘M19’ precursor mass of 278.13272 (with a 1.87 ppm mass accuracy). The bottom spectrum (green) is the high collision energy MSE mass spectrum, and it shows the product ions generated from the fragmentation of this metabolite, in particular a fragment at 119.06055, which has been identified as the pyridine ring connected to the aliphatic chain (with a 0.25 ppm mass accuracy).
B) Targeted DMPK DESI Imaging
The liver tissue sections were subsequently imaged with DESI MSI on a tandem quadrupole MS using a transition list generated from the MSE fragmentation data for methapyrilene and its observed exogenous and endogenous metabolites.
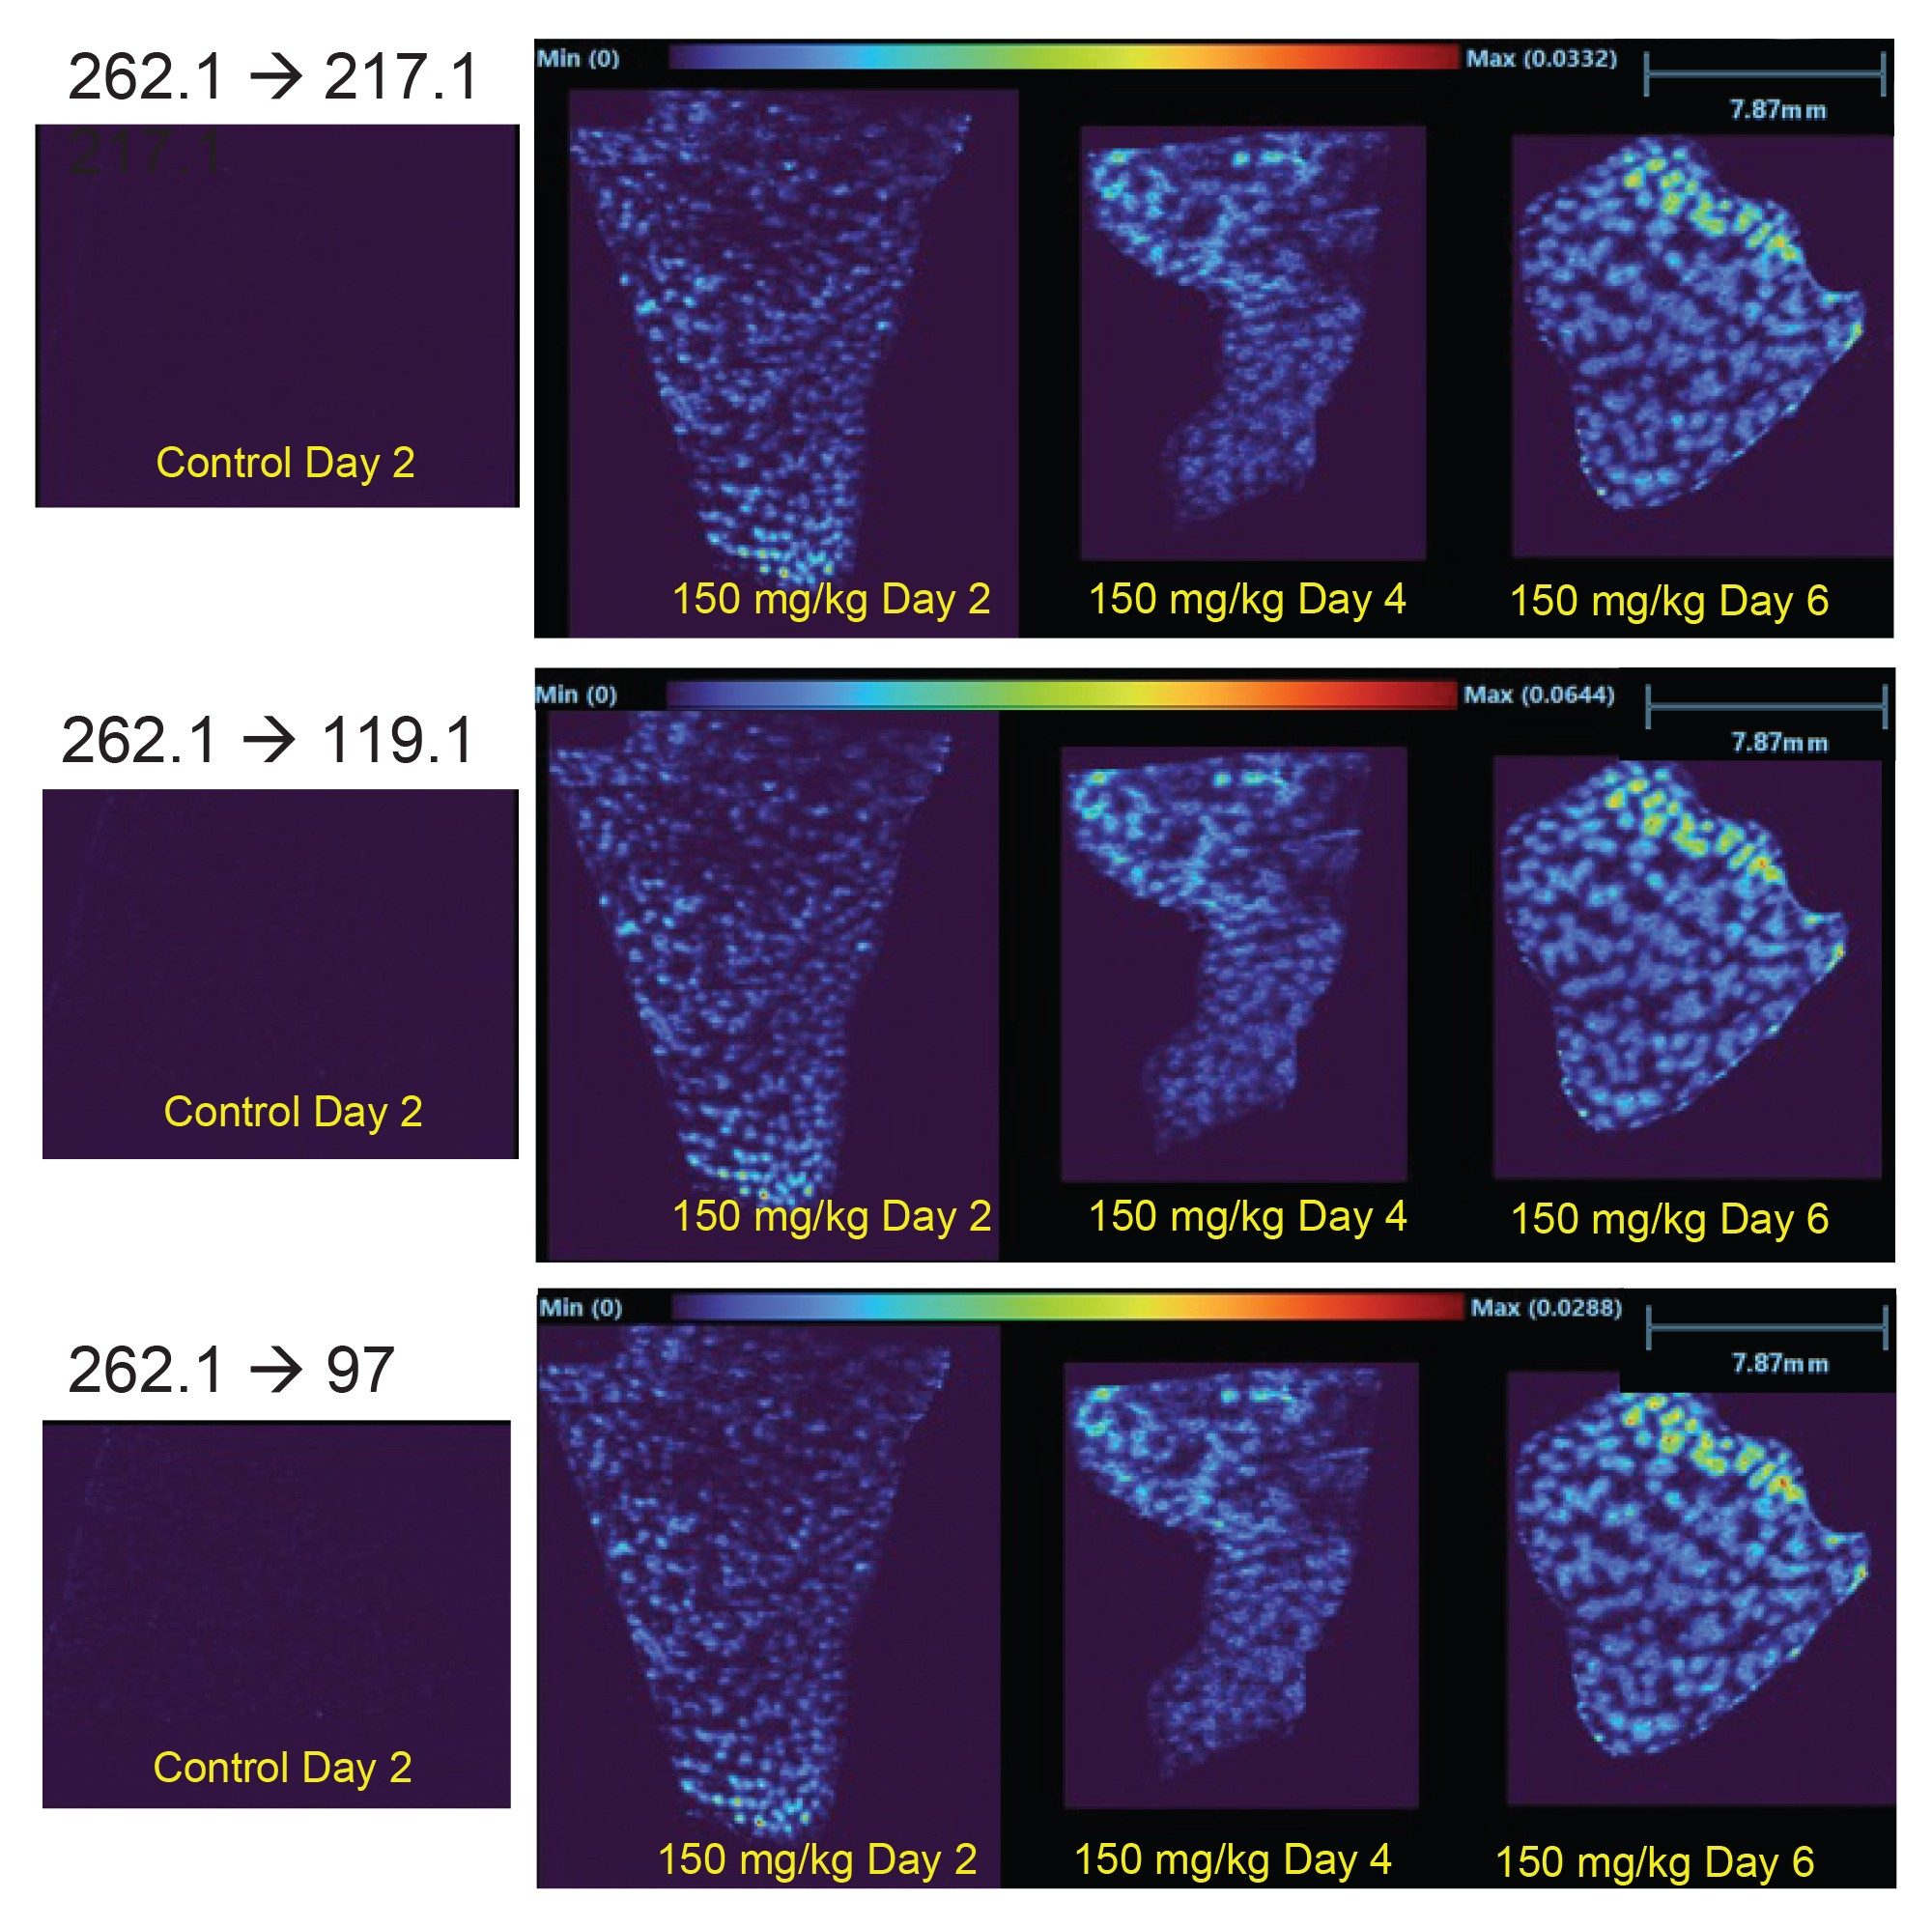
The DESI analysis monitored for the un-metabolized methapyrilene, which was only detected in the 150 mg/kg/day dosed livers. For the methapyrilene, three MS/MS transitions were utilized. All three transitions successfully detected the drug within the dosed livers seen in the individual images in Figure 3. Precursor ion m/z 262.1 fragmented to the product ions: m/z 217.1, 119.1, and 97.0. As with the ‘M19’ metabolite, the drug appears to localize to the damaged areas of tissue seen in the photographic image as nodules. The methapyrilene has concentrated within the tissue much more gradually over the course of the study compared to the ‘M19’ metabolite over the six days.
The ion images of livers from animals dosed at 50 mg/kg/day did not show any detectable methapyrilene for any of the three MS/M transitions this is demonstrated in Figure 4, showing an ion image formed from the sum of all three transitions at the 50 mg/kg/day dose vs. the 150 mg/kg/day dose. This difference suggests that the metabolic removal at 50 mg/kg/day was sufficient to prevent build-up of the drug but not sufficient to prevent the methapyrilene concentration building up during the 150 mg/kg/day dosing regime. This suggests that the methapyrilene has been fully metabolized prior to sacrifice of the animals receiving the lower dose but that the metabolism of the drug within rats is slower than the higher dosing regime.
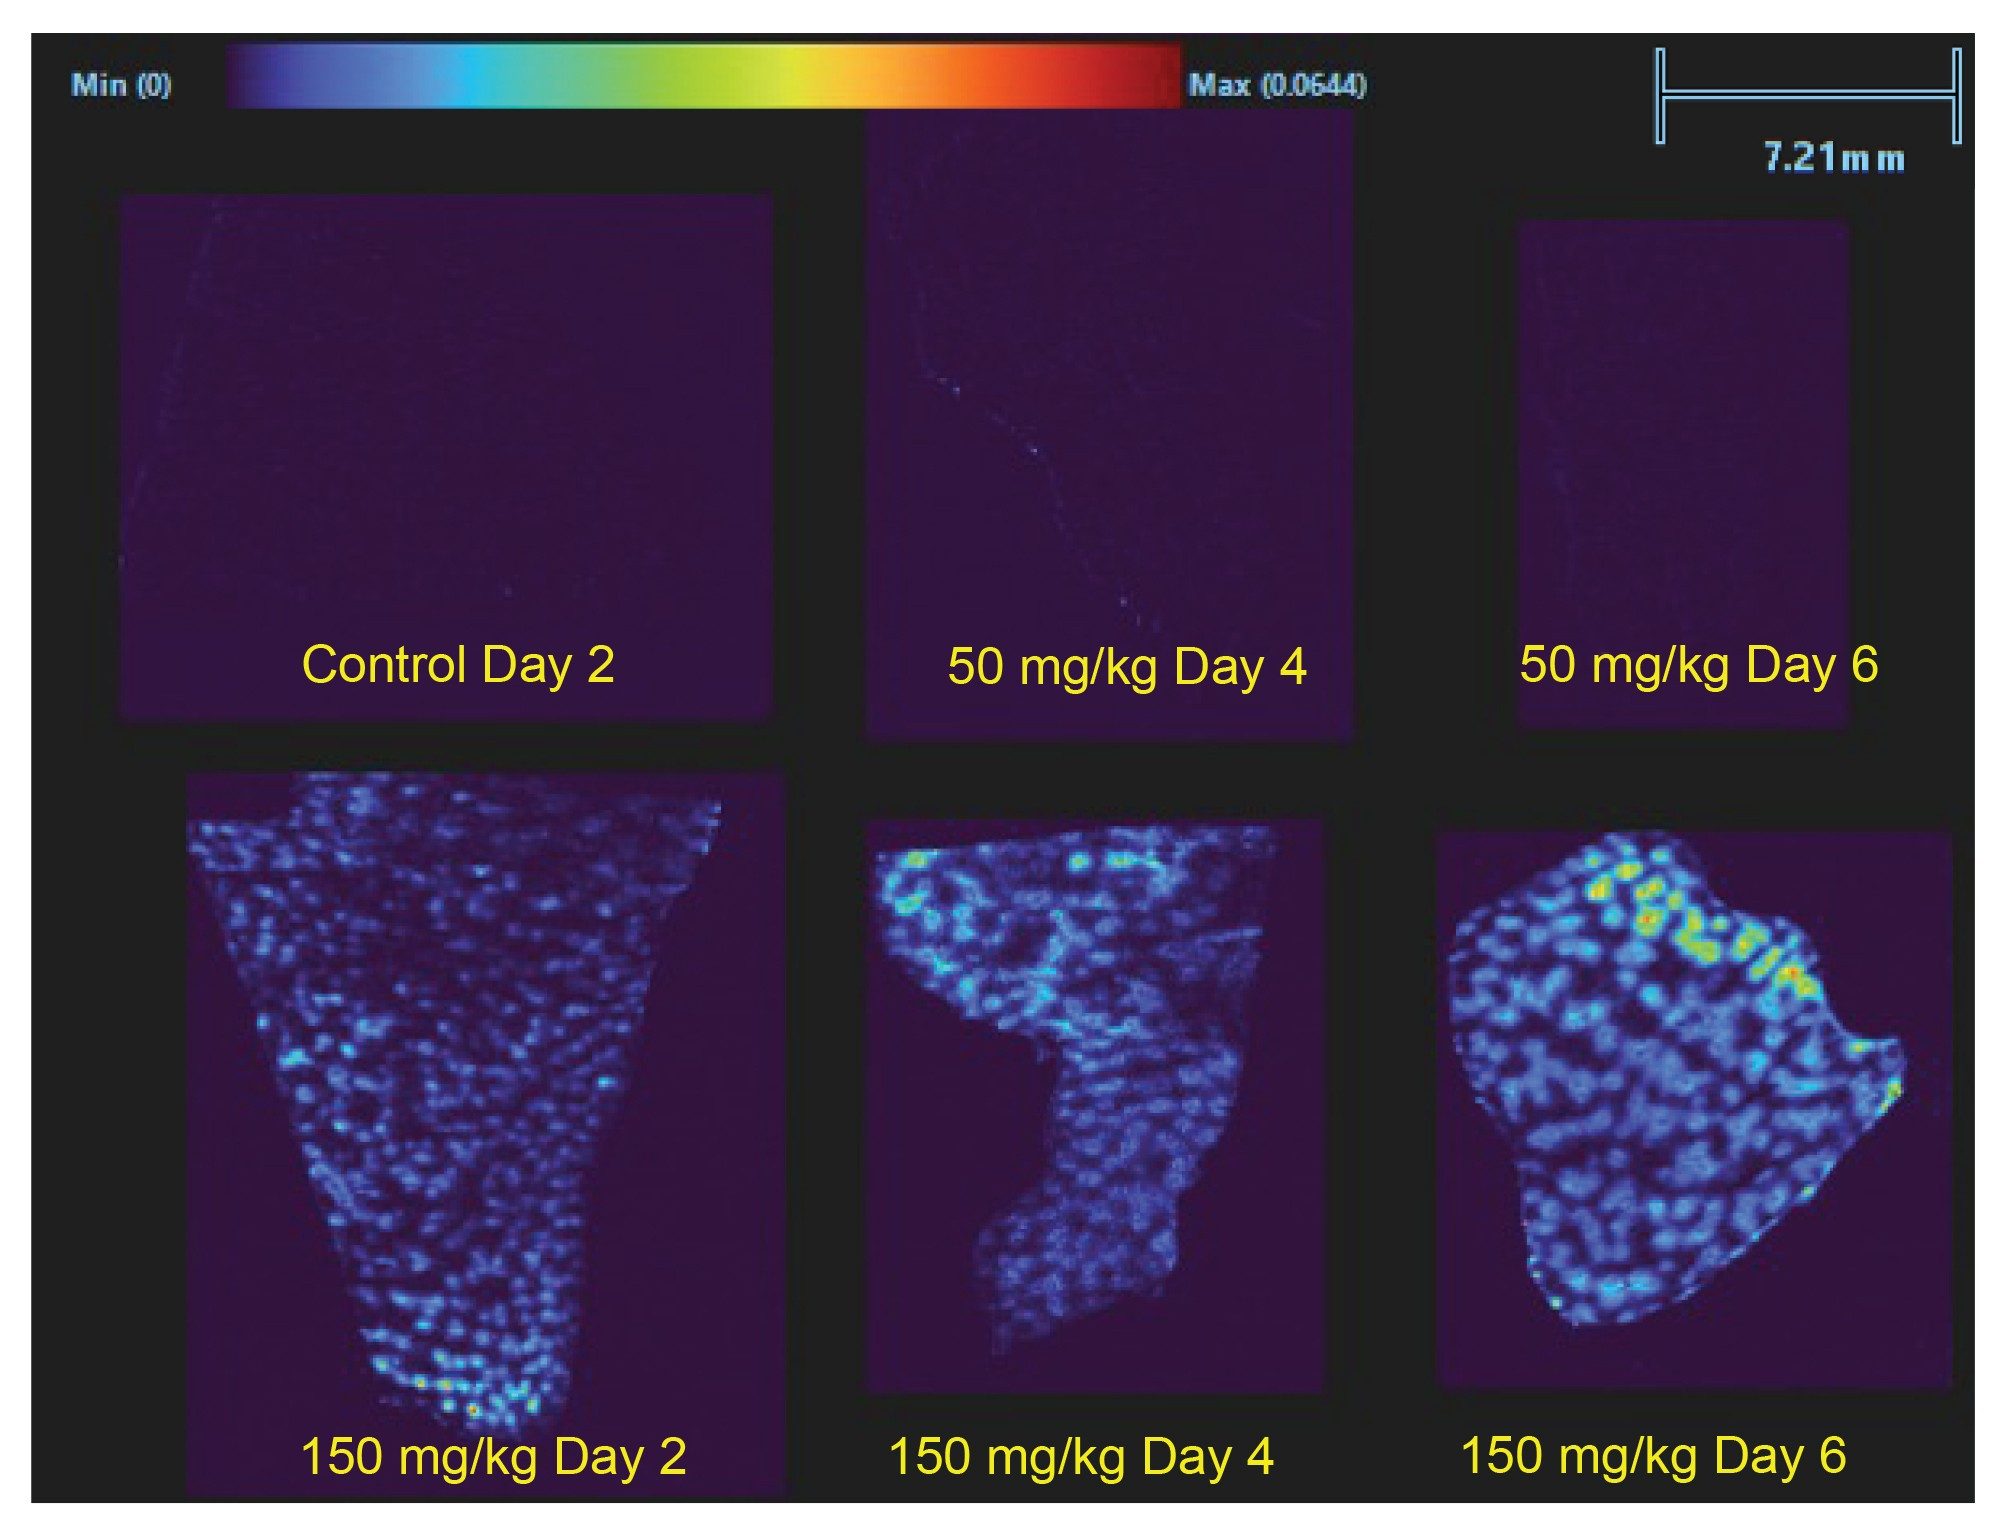
In addition to detecting the methapyrilene, DESI experiments also successfully detected the drug metabolites, the most notable being the ‘M19’ metabolite described within the LC-MS analysis. When the ion images for the ‘M19’ metabolite MS/MS transition (from the three groups and time points) were compared (Figure 5), there is a very small amount of an interfering endogenous signal in the control liver and the intensity does not visually appear to increase - from this background level - in the animals dosed at 50 mg/kg/day. However, in the livers taken from the animals dosed at 150 mg/kg/day, this metabolite is clearly accumulating within the livers as its intensity increases over the study time, with day 6 showing a significant concentration of the metabolite, suggesting that the metabolite production is more rapid than its removal rate from the liver. In the ion images ‘M19’ distribution does not appear homogenous across the liver but seems to be concentrated in defined structures visible in the photographic images of liver sections prior to DESI analysis in Figure 3 (right). The 50 mg/kg day 4 liver section (top) showed a relatively uniform ‘healthy’ tissue and the 150 mg/kg day 4 section (bottom) shows a tissue with granular appearance attributed to areas of potential necrosis or damage from the methapyrilene.
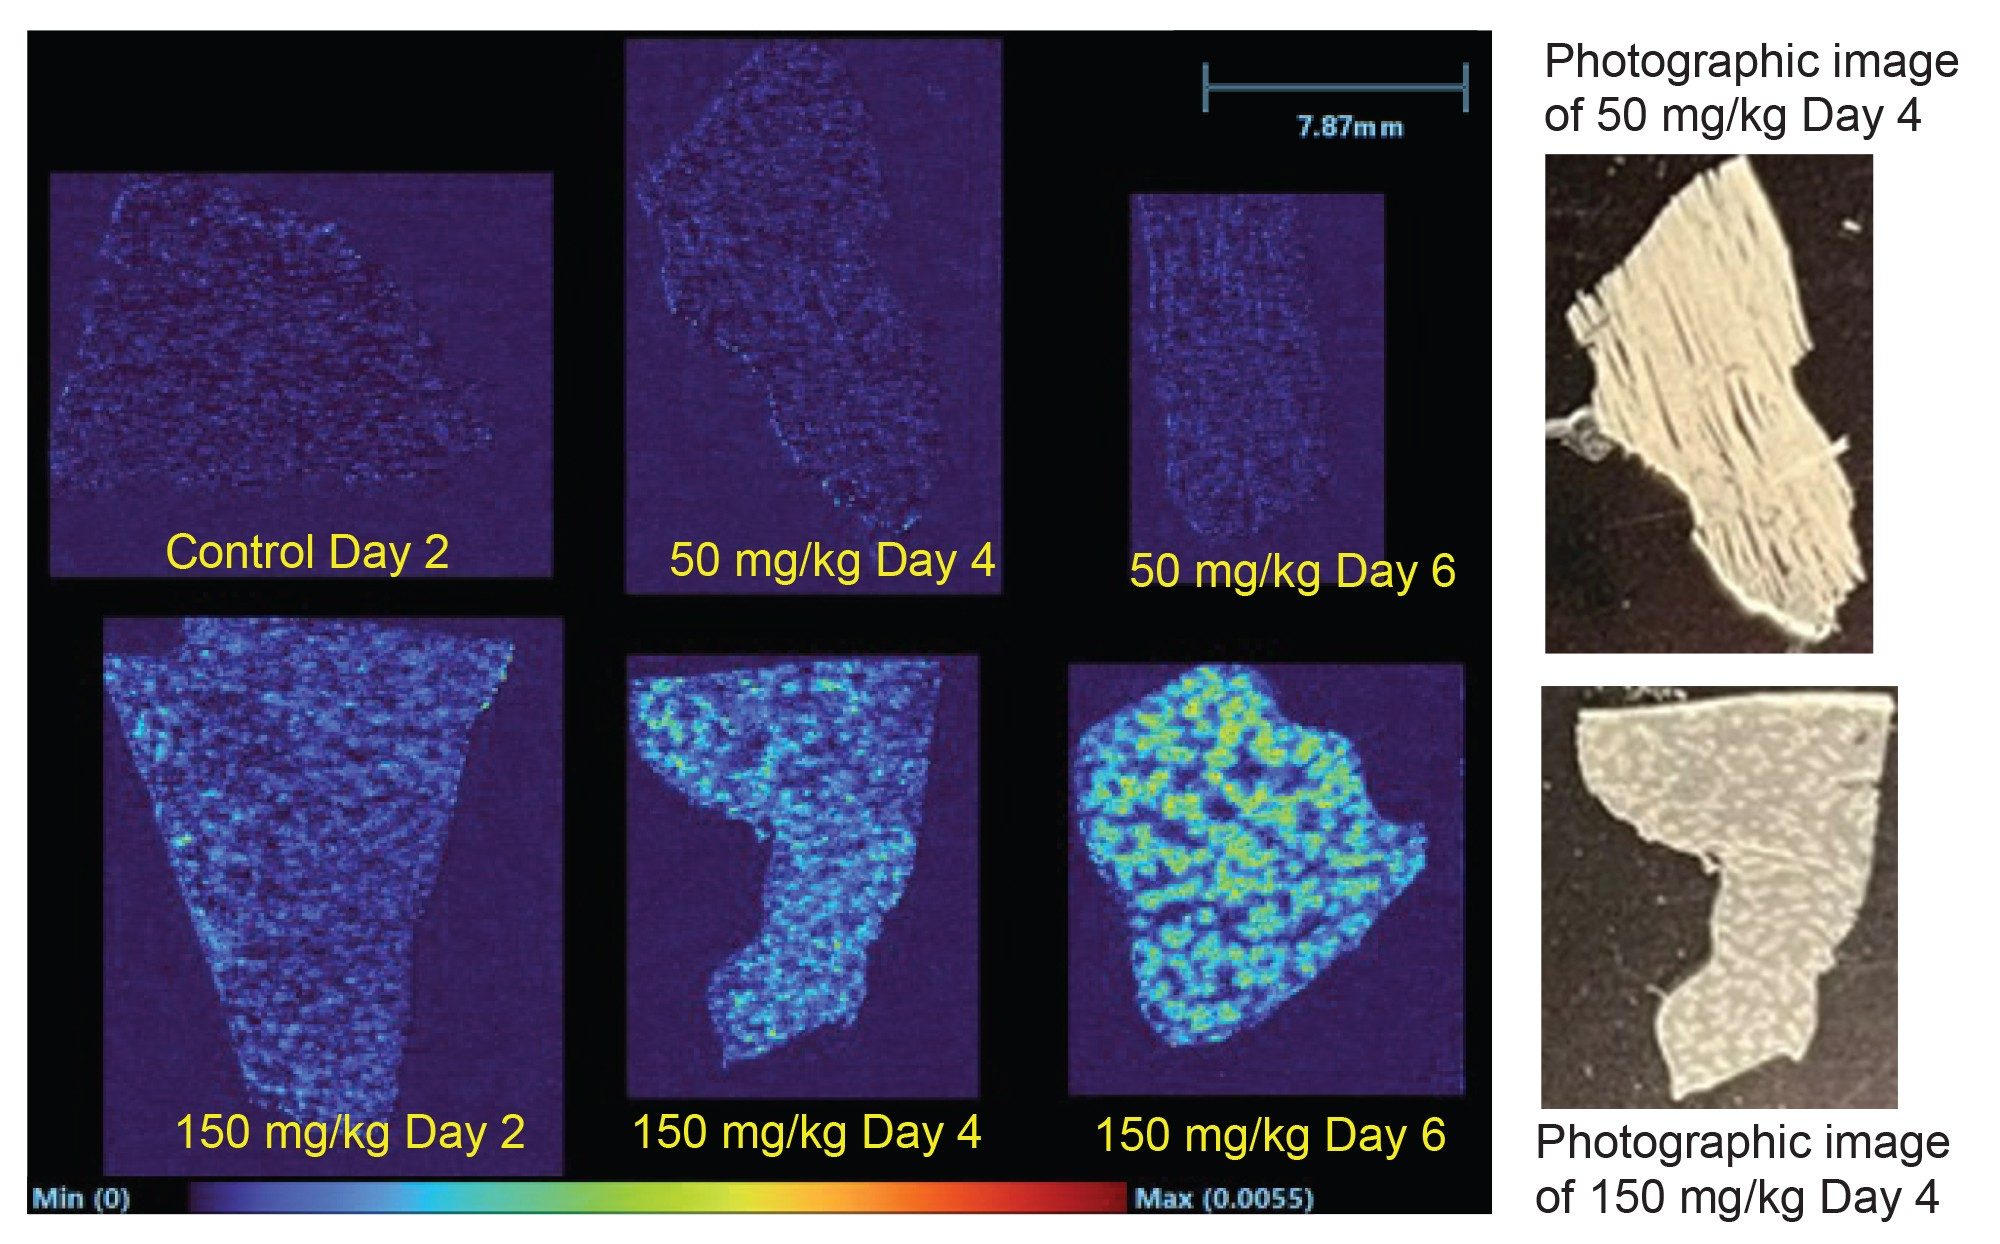
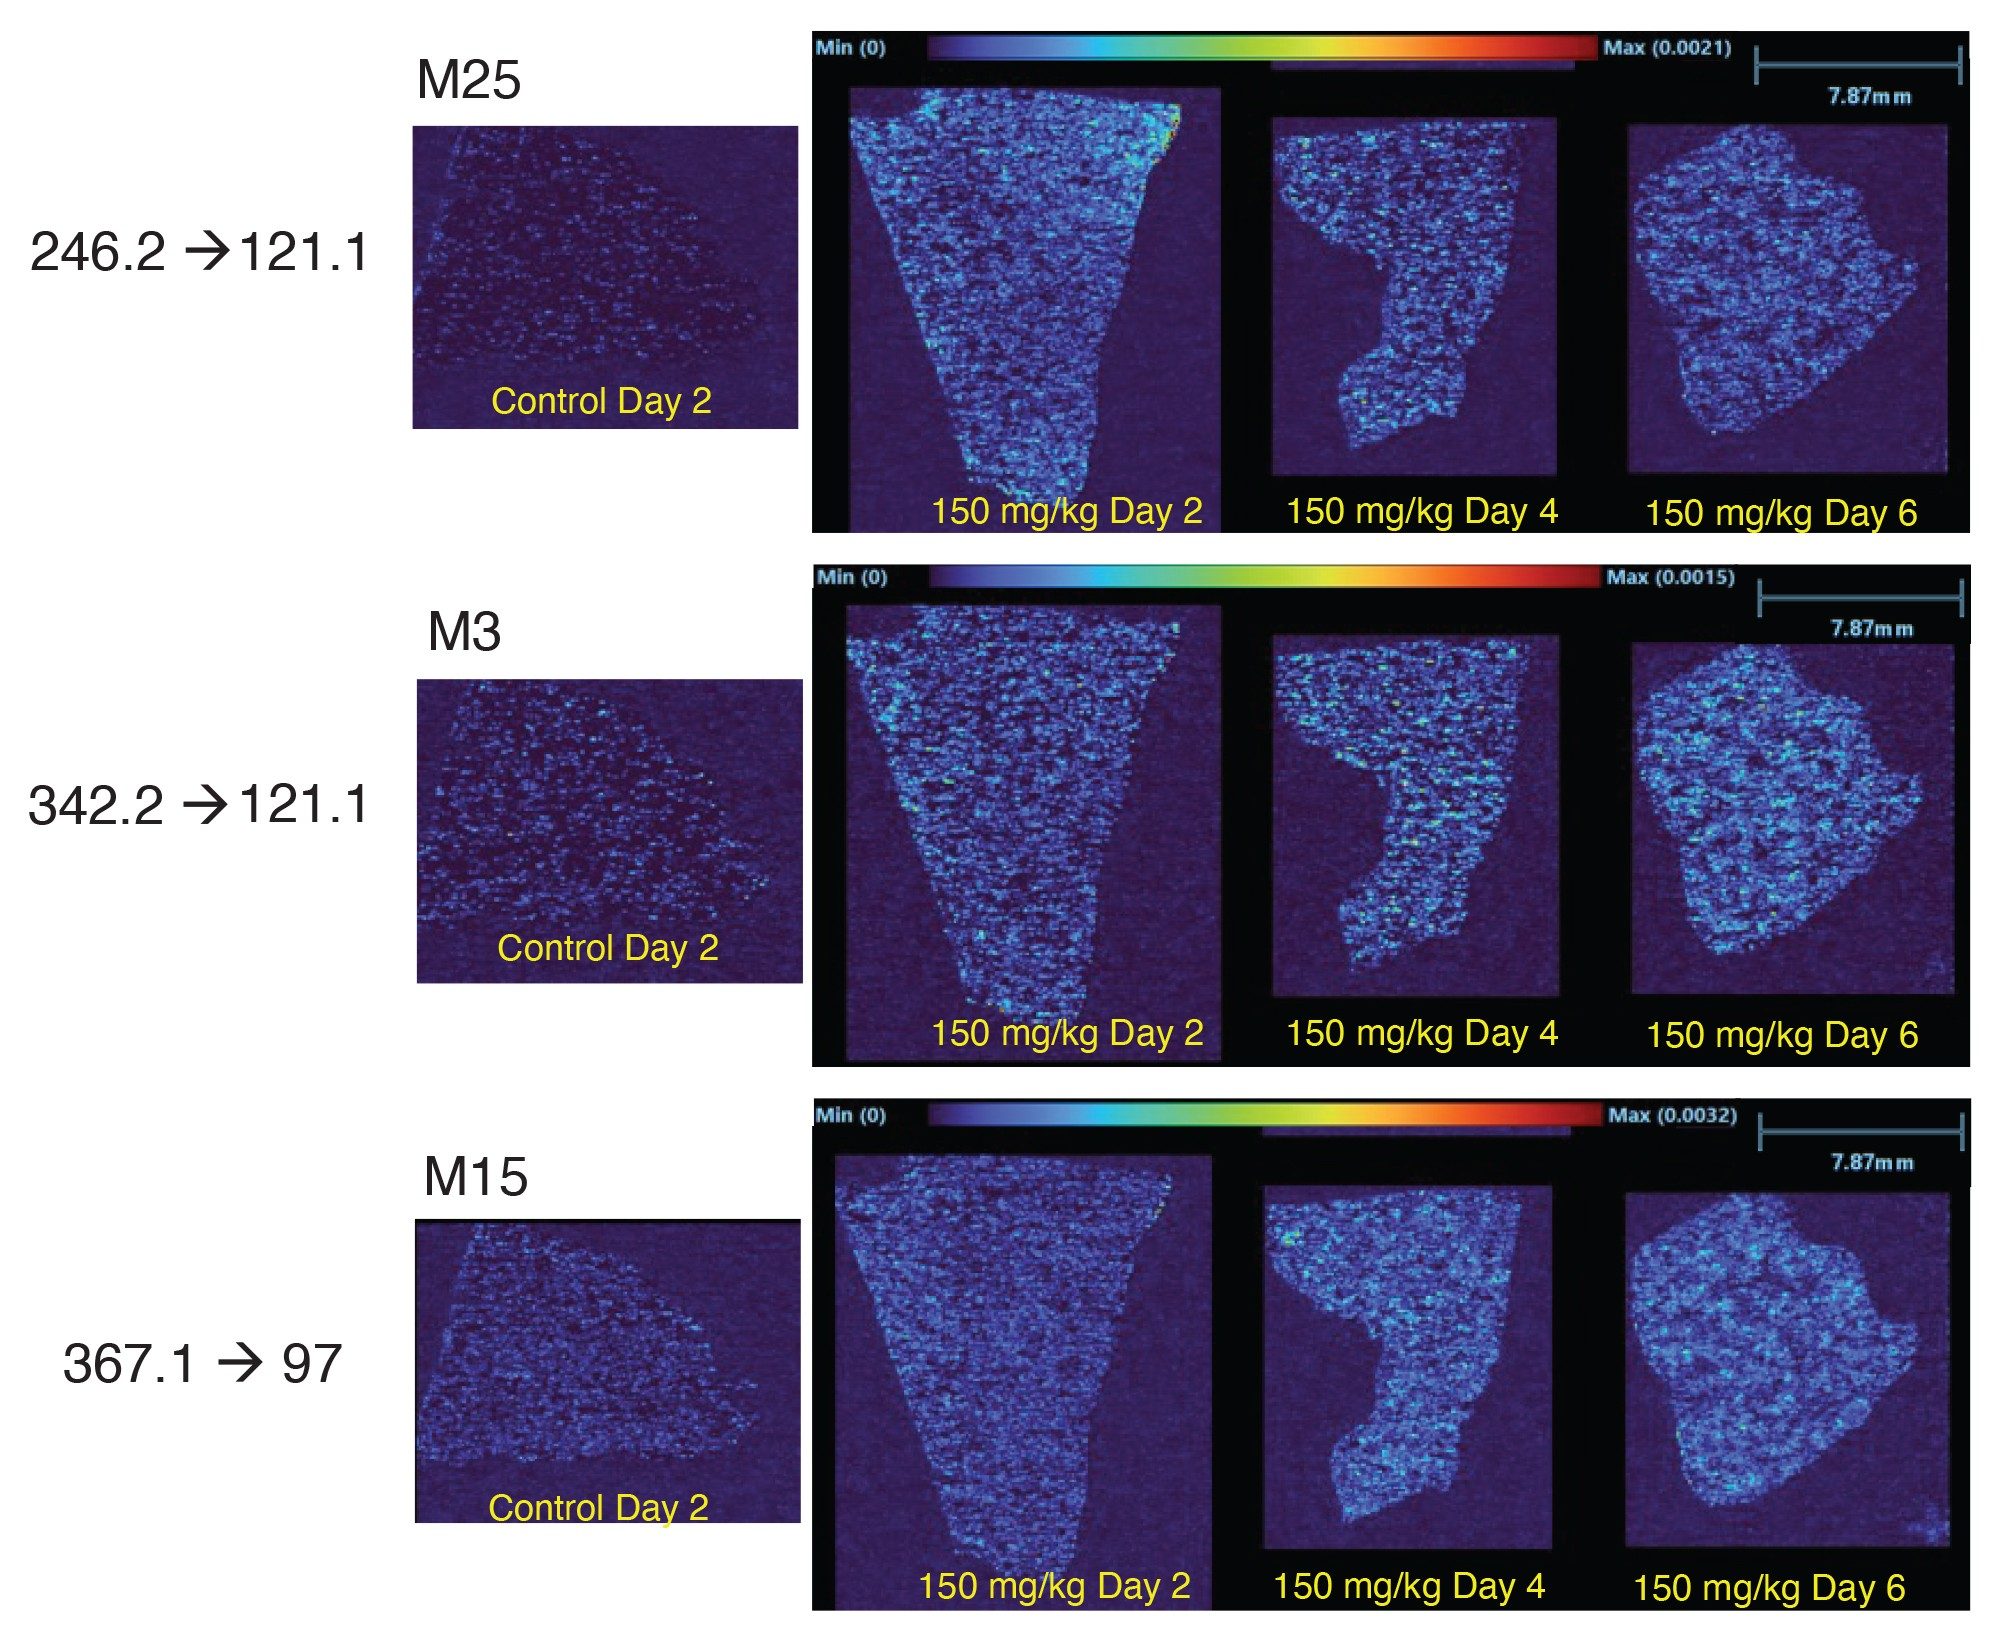
Additional methapyrilene metabolites were also detected by DESI in the livers of the 150 mg/kg/day dosed animals. However, their concentration appears lower than that for ‘M19’, and they remain relatively constant over the dosing regime, suggesting they do not concentrate over time within the liver. It can also be noted that these other drug metabolites are far more homogenously distributed in the liver. These drug metabolites ‘M25’, (Normethapyrilene, m/z 246.2 → m/z 212.1), ‘M3’ (loss of thiophene ring and n-glucuronidation, m/z 242.2 → m/z 212.1), and ‘M15’ (loss of aliphatic chain and tertiary amine, m/z 367.1 → m/z 97.0) are shown in Figure 6 for the control liver and three livers dosed at 150 mg/kg/day, from animals sacrificed at day 2, 4, and 6.
C) Drug Effect on the Metabolome
In addition to investigating the distribution of a drug and its metabolites, DESI MSI can also be used to look for endogenous metabolic changes due to the theraputic actions. When the analysis was performed on a tandem quadrupole mass spectrometer, the MRM list with endogenous metabolites was generated. The method included MS/MS transitions that identified these key metabolites. The MS scan speed was adjusted to maintain an acceptable dwell time to balance between total acquisition time and sensitivity (>5 ms dwell time).
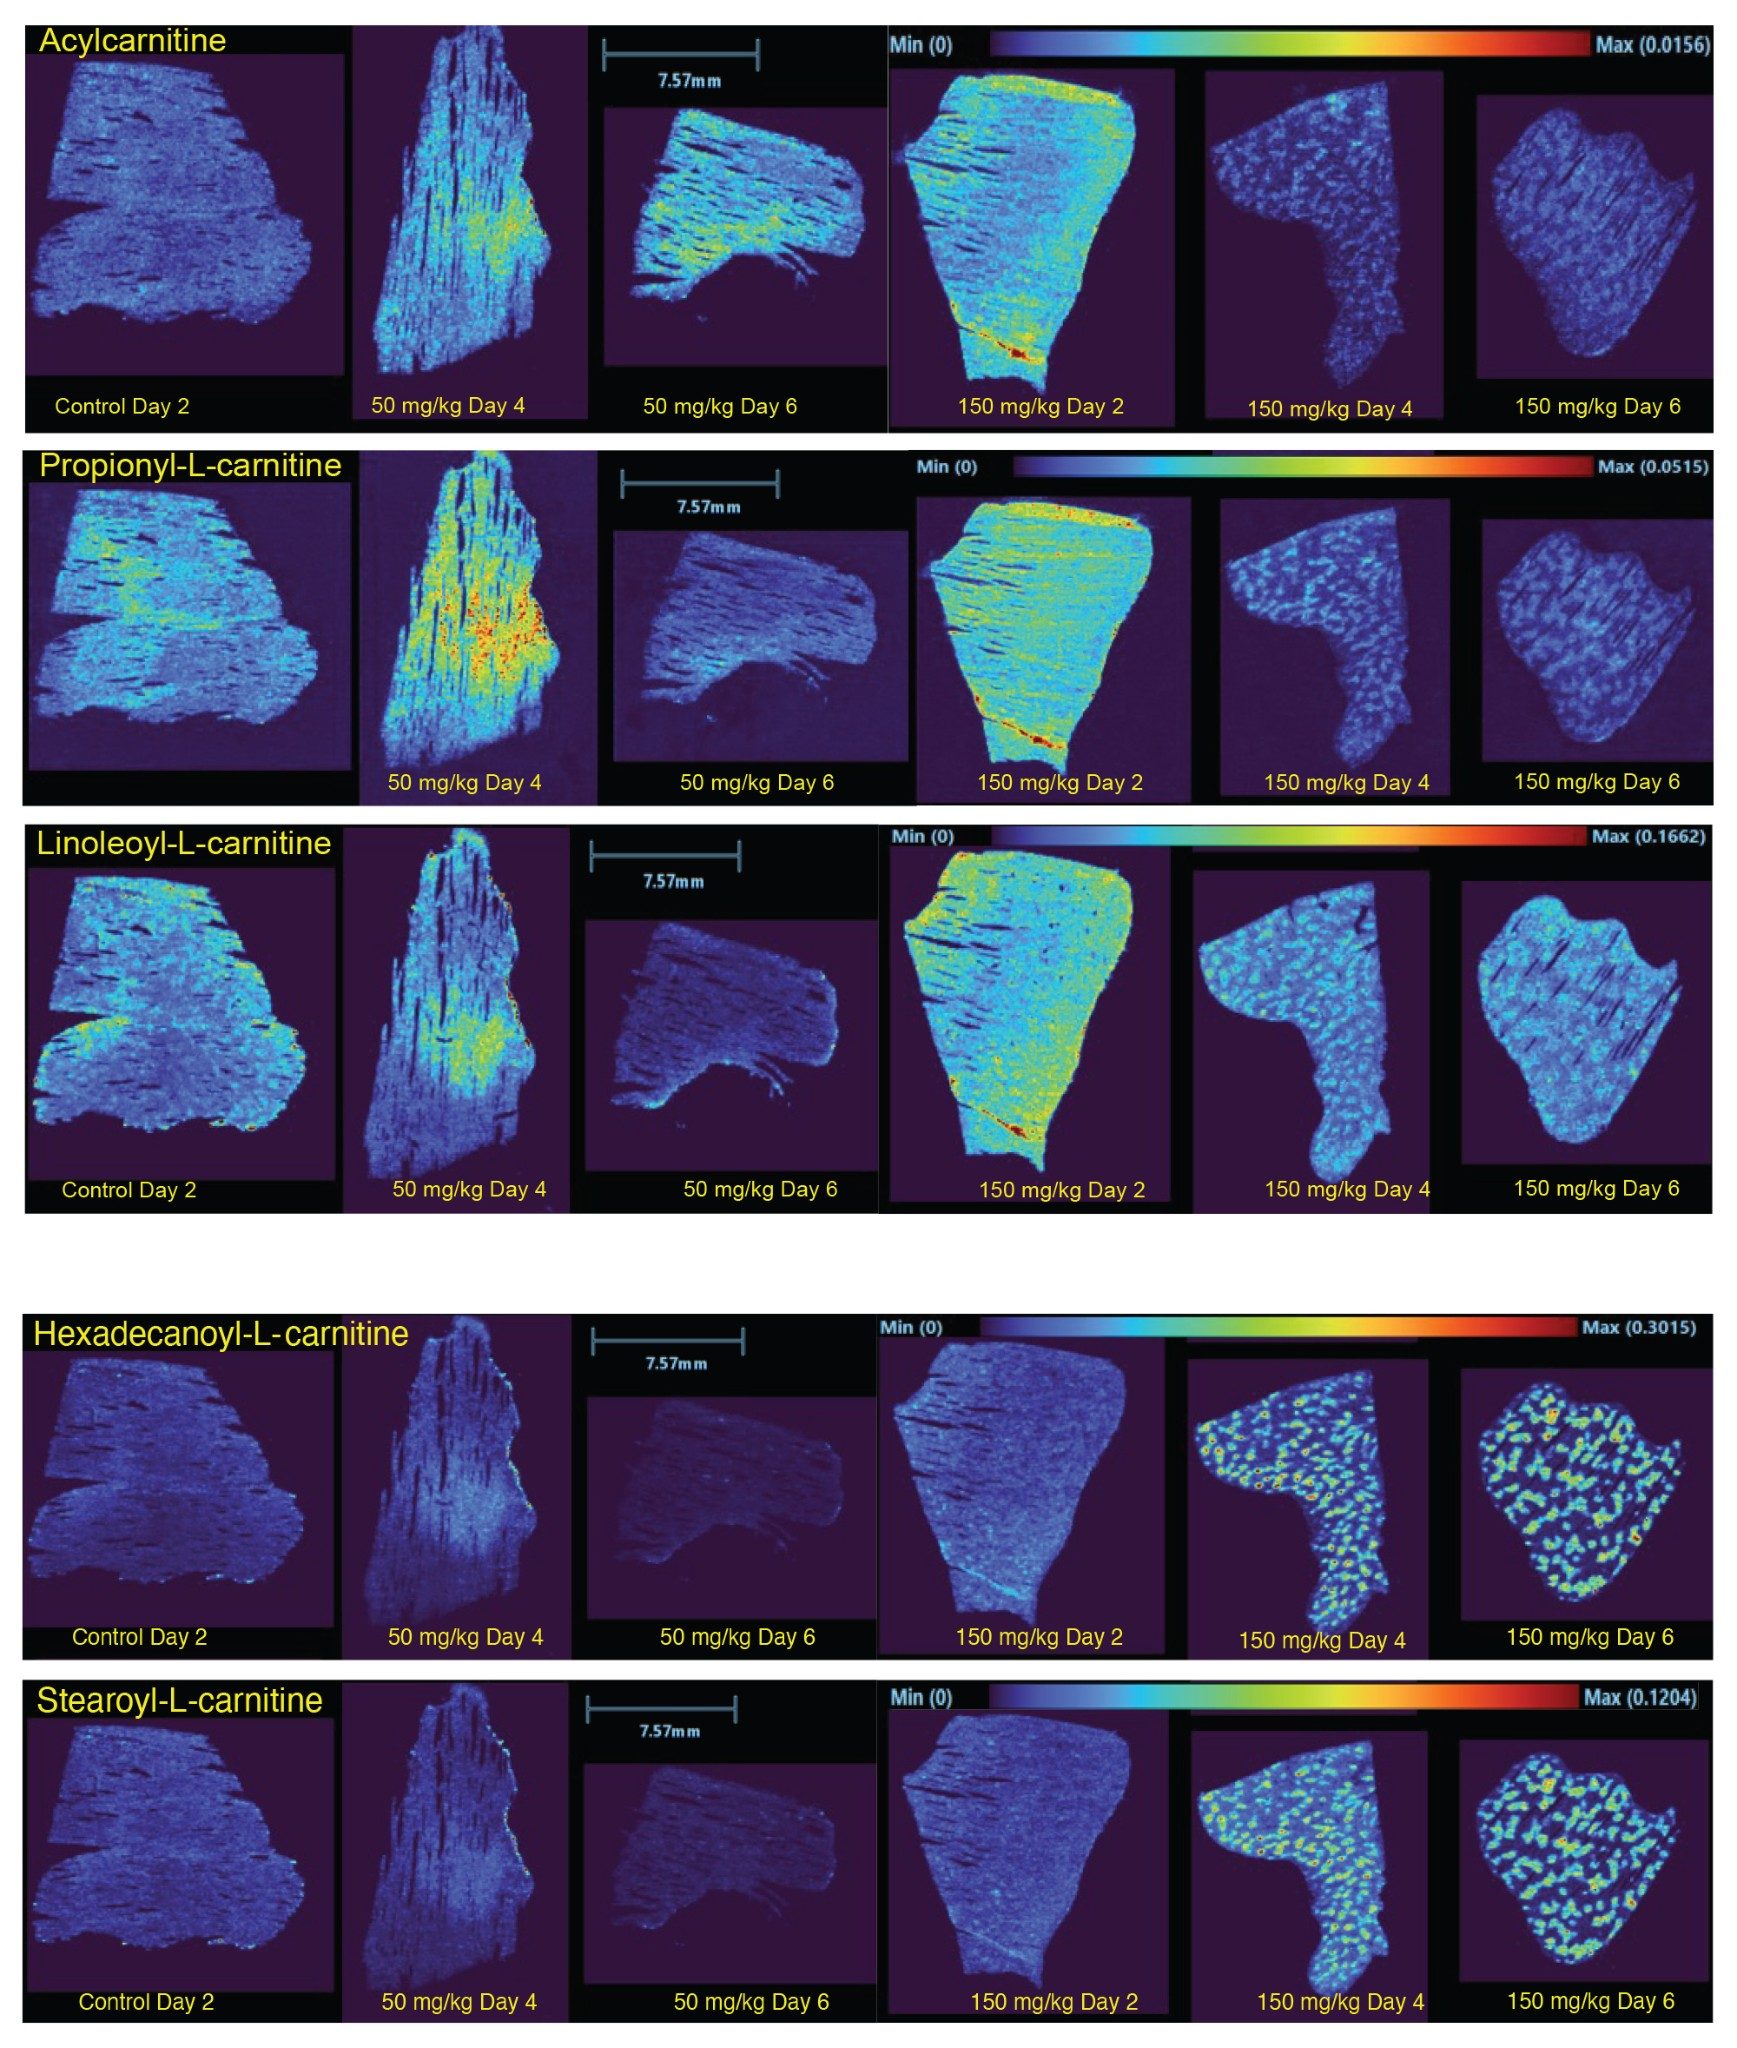
For the methapyrilene analysis described within this application, the selection of endogenous metabolite and lipid MS/MS transitions were analyzed in positive ionization mode. From these compounds screened, there were notable endogenous metabolite changes observed in relation to the methapyrilene dosing, particularly affecting the carnitine pathways. Carnitines showed variable dysregulation over the drug dosage and time course. Some were upregulated in the early exposure, then reduced after prolonged dosage, suggesting a downregulation or breakdown of these compounds after longer exposure to the methapyrilene. Figure 7 shows ion images generated from MRM transitions targeting three dysregulated carnitines: Acylcarnitine, Propionyl-L-carnitine (C3), and Linoleoyl-L-carnitine (C18:2) showing this dysregulation across the dosage regime. Other carnitines showed an upregulation after longer exposure to the high dose of methapyrilene, with little to no change in their relative concentration in the lower dose compared to the control. Ion images of two of these upregulated carnitines, hexadecanoyl-L-carnitine (C16) and stearoyl-L-carnitine (C18), are also shown in Figure 7 with a very localized distribution around the nodules. This trend might indicate that the livers of the high dosed animals were using a lot more stored energy than the control liver.
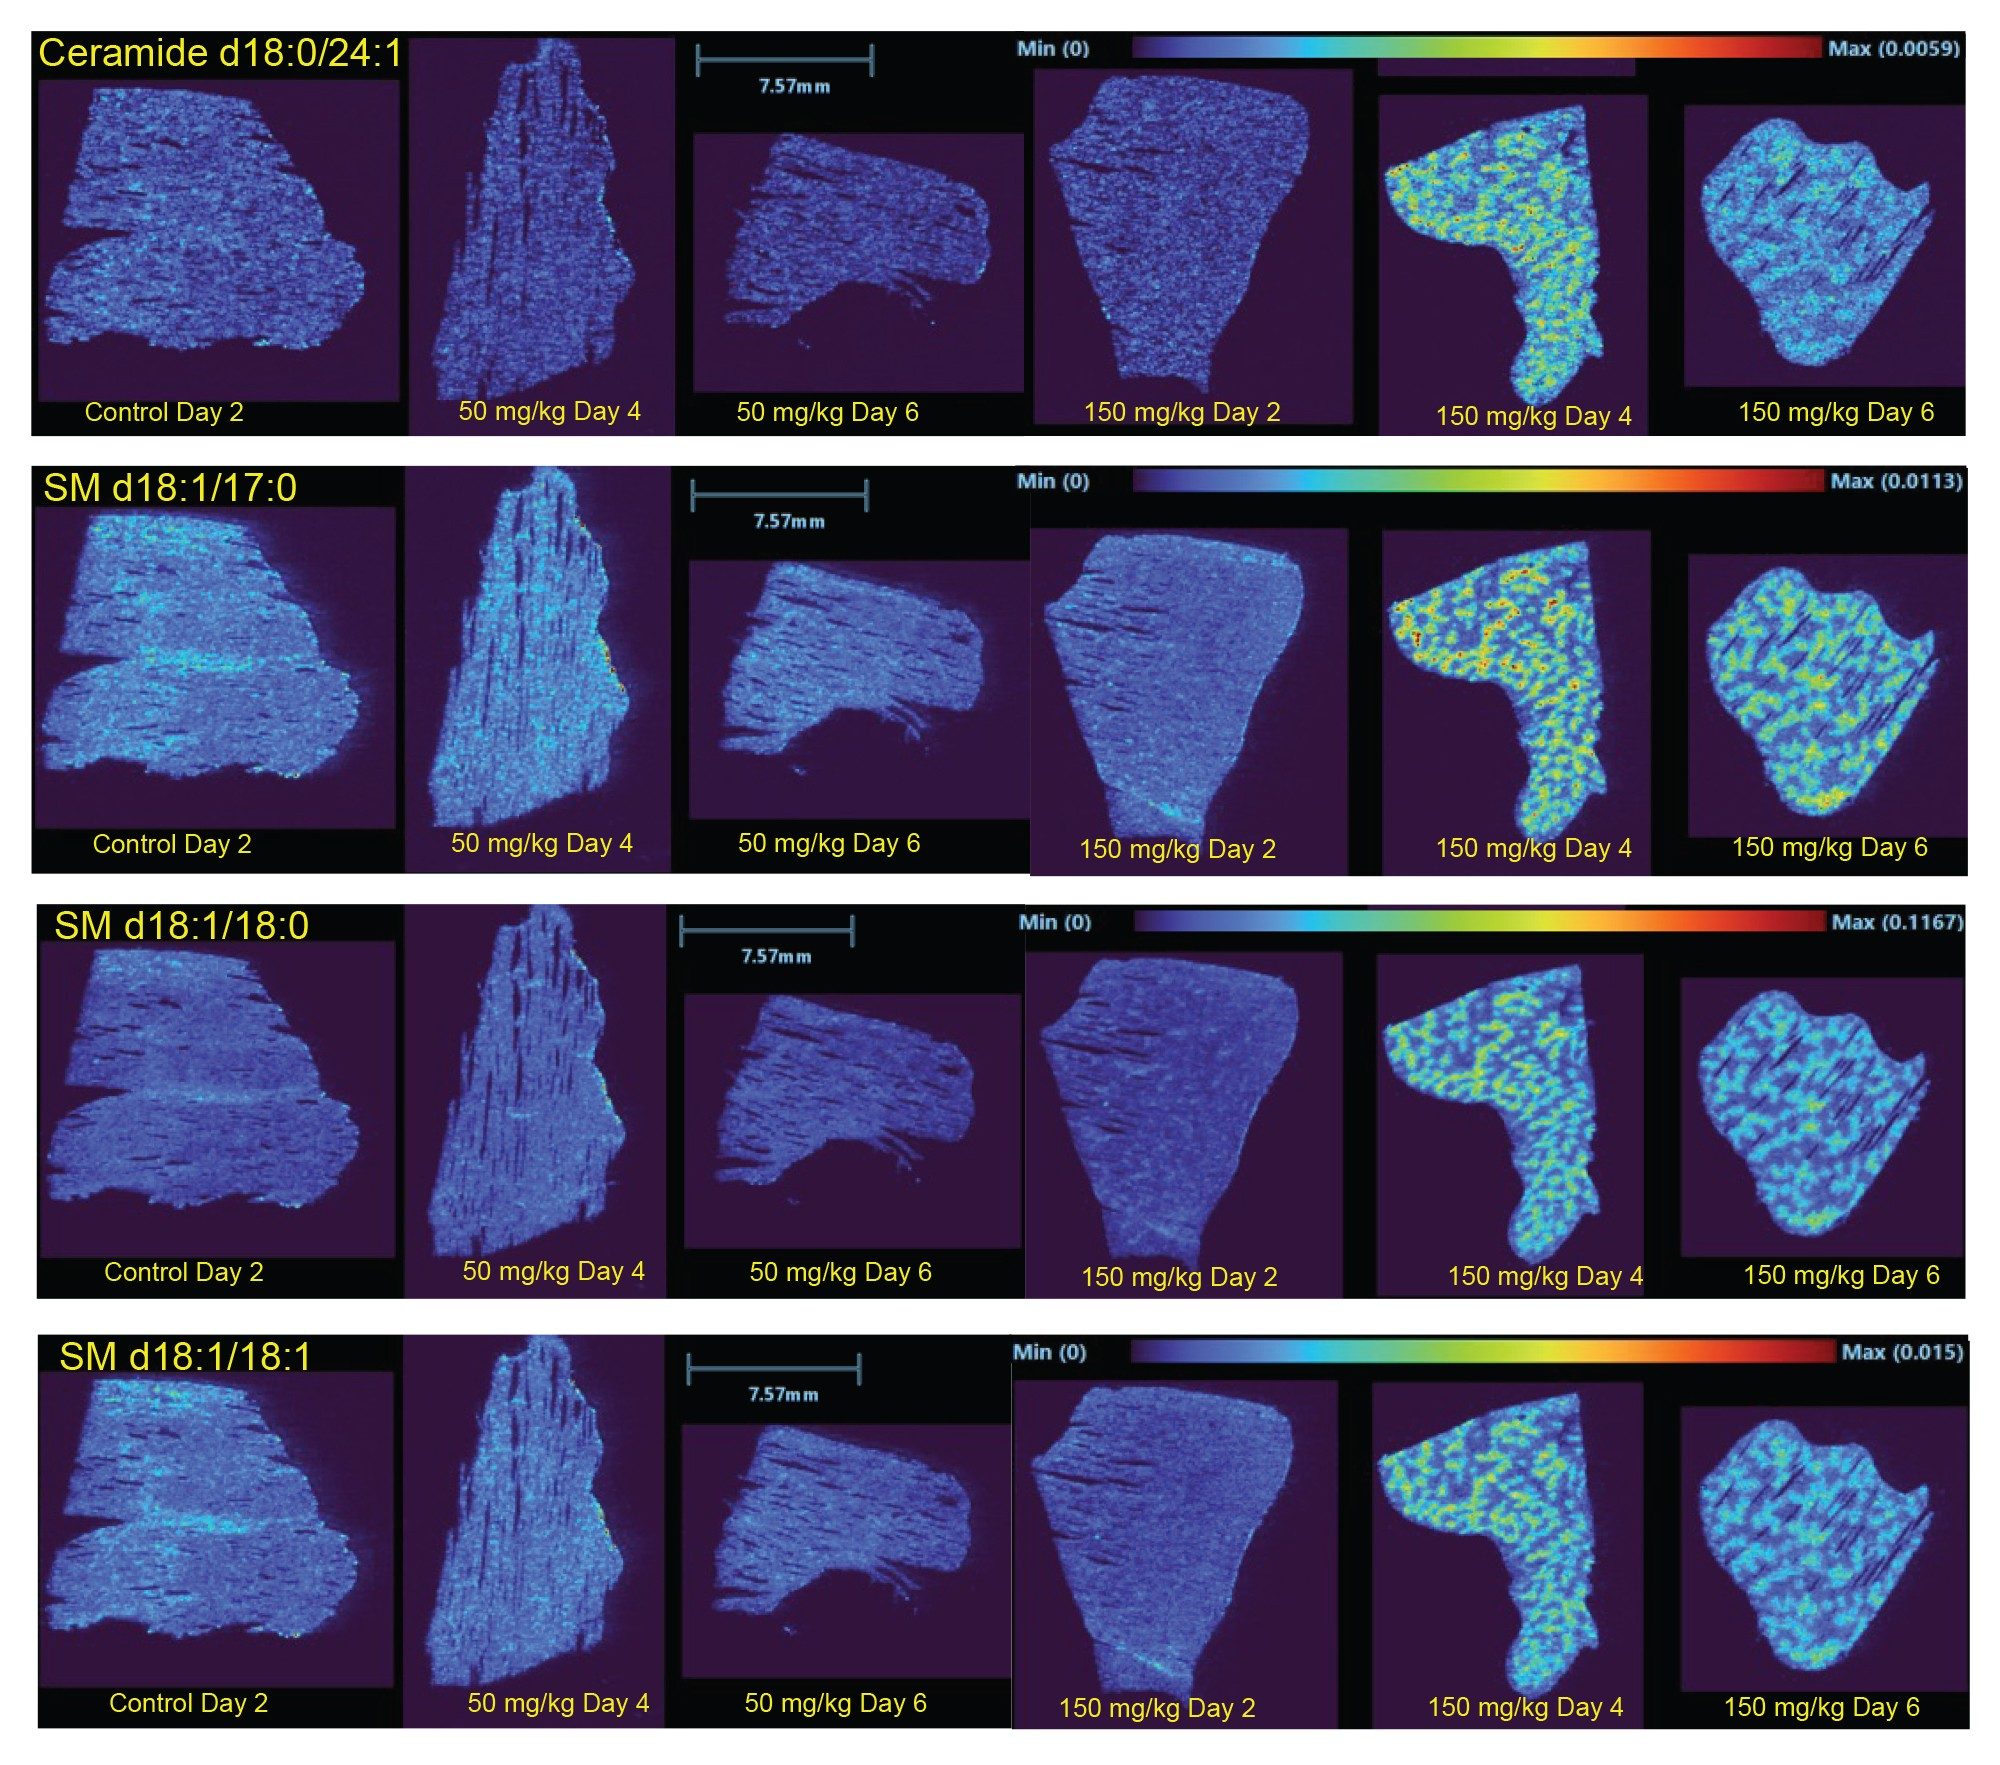
Another group of notable endogenous compounds affected by methapyrilene dosing were sphingolipids, where their relative concentration was much higher in the livers of animals given the high dose of methapyrilene. Alternatively, little to no change between the control and the low dose methapyrilene occurred. As with the methapyrilene drug and its metabolites, the high-dose changes appeared in the same pattern, accumulating in the nodules of potentially damaged areas within the liver structure. The increase in sphingolipid signal may be due to upregulation as an indicator of the liver stress response or possibly cell membrane breakdown in these regions, releasing the membrane lipids. Some example ion images of variuos sphingolipids are shown in Figure 8: Ceramide (d18:1/24:1), SM (d18:1/17:1), SM (d18:1/18:0), and SM (d18:1/18:1).
Here, DESI MSI has been demonstrated as an excellent complementary tool for DMPK analyses, enabling visualization of the localization and distribution of a drug and its metabolites within a tissue. MSI also detected endogenous metabolic and lipidomic changes related to the drug distributions and dosing regime, tying biological alterations to the effects of the dosed drug. DESI analysis eliminated the need for sample homogenization, meaning drug and drug metabolite distributions along with endogenous changes could be visualized at a sub-organ level, providing more granularity and precision to DMPK studies.
Shapiro, R. N. The use of methapyrilene hydrochloride as a sedative and somnifacient agent. The Journal of Pediatrics. 1956, 48 (3), 314–317.
Graham, E. E. Identification of the thiophene ring of methapyrilene as a novel bioactivation-dependent hepatic toxicophore. The Journal of Pharmacology and Experimental Therapeutics. 2008, 326 (2), 657–671.
Habs, M.; Shubik, P.; Eisenbrand, G. Carcinogenicity of methapyrilene hydrochloride, mepyramine hydrochloride, thenyldiamine hydrochloride, and pyribenzamine hydrochloride in Sprague-Dawley rats. Journal of Cancer Research and Clinical Oncology. 1986, 111 (1), 71–74.
Lijinsky, W.; Reuber, M. D.; Blackwell, B. N. Liver Tumors Induced in Rats by Oral Administration of the Antihistaminic Methapyrilene Hydrochloride. Science. 1980, 209 (4458), 817–819.
Plumb, R. S. An investigation of the plasma and urinary metabolite profiles of the hepatotoxin methapyrilene in the male Wistar rat. Journal of Pharmaceutical and Biomedical Analysis. 2025, 264, 116976.
Ethics:
This study is compliant with the corresponding project APAFIS #32640–2021101419119467 v5. This project was reviewed by Evotec France Ethical Committee and authorized by the French Ministry of Education, Advanced Studies and Research.
720009563, November 2026


