
Quantification of Polysorbates Using the Waters Charged Aerosol Detector
Pawel Bigos, Robert E. Birdsall, Xiangsha Du, Duanduan Han, Nikhil Bhiwankar
Waters Corporation, United States
Published on July 13, 2026

Abstract
Non-ionic surfactants such as polysorbate 20 (PS20) and polysorbate 80 (PS80) are critical excipients in monoclonal antibody (mAb) formulations, where they play an essential role in maintaining protein stability and product quality. Accurate quantification of these polysorbates remains analytically challenging due to their inherent heterogeneity, lack of strong ultraviolet (UV) chromophores, and low concentration relative to high protein concentrations. To address these challenges, a trap-and-elute reversed-phase liquid chromatograph (RPLC) method coupled with charged aerosol detection (CAD) was developed for the measurement of PS20 and PS80 in mAb samples. Method performance was improved through implementation of a dual-valve configuration and optimization of the CAD ion trap voltage, enabling reduced baseline noise and enhanced calibration linearity. Calibration curves for both polysorbates demonstrated excellent linearity over a concentration range of 0.005–0.75 mg/mL with low % RSD values across all levels. Method accuracy and applicability were verified through spike-recovery experiments in NISTmAb which showed minimal percent deviation and strong reproducibility across multiple concentration levels.
Benefits
- Waters CAD is fully compatible with Waters LC systems and Empower™ Software for streamlined method development, automated data processing, and compliance in regulated laboratory environments
- Adjustable instrument parameters such as power function value (PFV) and ion trap voltage allows optimization of sensitivity, linearity, and dynamic range for diverse analytical applications
Introduction
Non-ionic surfactants such as PS20 and PS80 are exceptionally prevalent in mAb formulations, appearing in >80% of commercially available products. These surfactants play a critical role in maintaining formulation stability by minimizing protein aggregation, preventing denaturation, and reducing nonspecific adsorption (NSA) to manufacturing equipment, storage containers, and delivery devices.1 By preserving protein structure and functionality throughout the product lifecycle, PS20 and PS80 directly contribute to product quality, efficacy, and shelf life. Given their importance, robust analytical methods are required to accurately quantify polysorbate concentrations in final drug products throughout development and manufacturing.
The challenge in quantifying polysorbates is that they are not single, well-defined molecules. Instead, polysorbates are highly heterogeneous mixtures produced through the ethoxylation and partial esterification of polyoxyethylene sorbitan derivatives with fatty acids.2 This manufacturing process generates a complex distribution of related species that differ in the number of ethylene oxide units, the degree and position of esterification, and the identity of the fatty acid side chains, resulting in more than 1,500 distinct molecular structures.3 The analytical challenge is further compounded by the fact that polysorbates are typically present at low concentrations (0.001-0.1% w/v) in formulations containing proteins at concentrations that are several orders of magnitude higher.4
Several analytical strategies have been reported in literature for polysorbate quantification, with trap-and-elute workflows emerging as a widely adopted approach.5,6 Since polysorbates lack strong UV chromophores, conventional UV-based detector techniques are insufficiently sensitive for polysorbate analysis. As a result, alternative detection strategies such as evaporative light scattering detection (ELSD) or CAD are commonly employed. Recently, Waters has launched a CAD designed to work seamlessly with Waters LC systems and Empower Software for ease of method development, automated data processing, and compliance in regulated laboratory environments. The Waters CAD is compatible with HPLC, UHPLC, and UPLC™ systems and has control over key detection parameters, including four individual PFVs and ion trap voltage. These adjustable parameters allow users to fine-tune detector response, optimize sensitivity, and improve linearity across a given concentration range, making the detector adaptable to diverse analytical requirements.
In this application note, a trap-and-elute RPLC method coupled with the Waters CAD was used to quantify PS20 and PS80 in spiked mAb samples. The performance of the method was assessed in terms of sensitivity, linearity, and precision. Additionally, the influence of detector-specific parameters such as PFV and ion trap voltage on calibration behavior and overall analytical performance was investigated. The results demonstrate that the Waters CAD provides a robust, sensitive, and reproducible platform for the routine quantification of polysorbates in mAb formulations, supporting its use in both development and quality control environments.
Experimental
Stock solutions of PS20 and PS80 were prepared at 20 mg/mL in water. PS20 and PS80 calibration standards were prepared by diluting the stock with water to concentrations ranging between 0.005–0.75 mg/mL. PS20 was purchased from Croda Pharma, PS80 was purchased from Sigma Aldrich, and NISTmAb RM 8671 was purchased from NIST SRM.
LC Conditions
|
LC system: |
ACQUITY™ Premier System with Binary Solvent Manager (BSM) |
|
Column: |
Oasis™ MAX Column, 30 µm, 2.1 x 20 mm (p/n: 186002052) |
|
Vials: |
QuanRecovery™ with MaxPeak™ HPS Vial and pre-slit PTFE silicone cap (p/n: 176004434) |
|
Column temperature: |
30 °C |
|
Sample temperature: |
10 °C |
|
Injection volume: |
30 µL |
|
Mobile phase A: |
2.0% formic acid in water |
|
Mobile phase B: |
2.0% formic acid in isopropanol |
CAD Settings
|
Sampling rate: |
5 Hz |
|
Time constant: |
Normal |
|
Ion trap: |
600 V |
|
Evaporation temperature: |
40 °C |
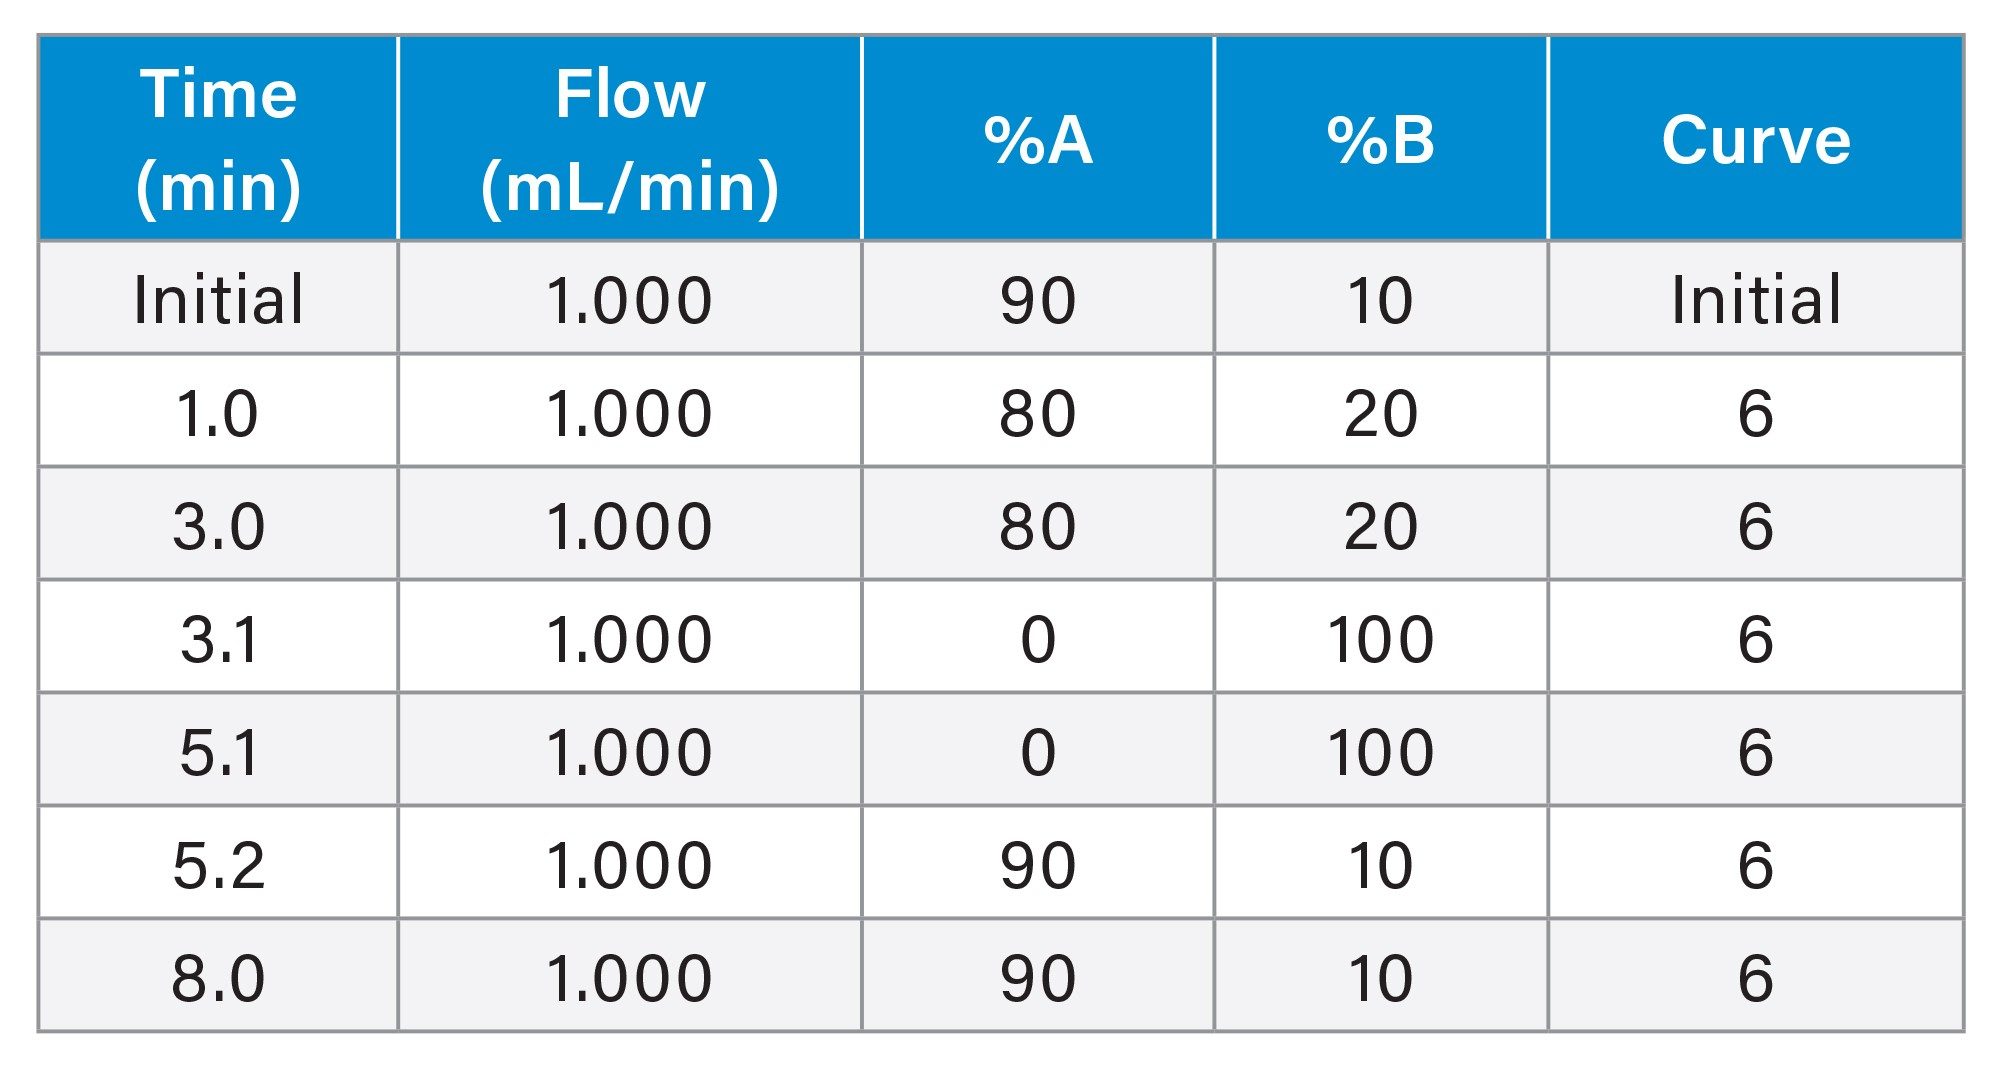
Gradient Table
Results and Discussion
Trap-and-elute Methodology
The trap-and-elute workflow using the Oasis MAX Column is designed to selectively remove the high-concentration protein matrix while allowing PS20 and PS80 to be transferred to the analytical column for quantification. Under acidic mobile phase conditions, potential ionizable groups within the protein are fully protonated, thereby minimizing electrostatic interactions with the positivity charged quaternary amine groups of the stationary phase.5 As a result, the separation mechanism is dominated almost entirely by hydrophobic interactions with the polymeric backbone of the Oasis MAX Column. When mAb samples are injected into a highly acidic aqueous environment, the proteins become protonated, highly polar, and structurally expanded, resulting in reduced hydrophobic interaction with the stationary phase. Consequently, the proteins exhibit minimal retention and are washed away to waste in the void volume. In contrast, PS20 and PS80 retain significant hydrophobicity due to their fatty acid esters, allowing for strong interaction with the polymeric reversed-phase surface.
Following removal of the protein matrix, the valve configuration is switched, and a strong organic mobile phase is introduced to elute the retained polysorbates from the analytical column. The use of 100% isopropanol disrupts the hydrophobic interactions between the polysorbates and the stationary phase, enabling efficient desorption of the surfactant species. Because polysorbates consist of highly heterogeneous molecular distributions, the strong organic elution conditions promote co-elution of the various species as a single broad chromatographic peak, simplifying integration and quantification. Although the Oasis MAX Column is inherently an anion-exchange and reversed-phase stationary phase, the use of 2% formic acid effectively converts it into a hydrophobic trapping phase for this application. This allows selective retention of polysorbates and other non-ionic surfactants while excluding proteins, enabling direct quantitation of polysorbates in complex protein formulations without sample preparation.
During method development, several valve configurations were evaluated to improve reproducibility and minimize variability associated with matrix interference. As shown in Figure 1, the double‑valve configuration in the column manager provided the most consistent performance, delivering the lowest %RSD for both calibration standards and spiked samples. The improved reproducibility is likely due to more effective management of the LC fluidic pathway during valve switching, including flushing unswept volumes, ensuring that fluidic pathways are equilibrated with the same mobile phase composition to minimize solvent-related disturbances, and removing residual protein matrix components or partially retained species that could otherwise contribute to analytical variability. If not accounted for, these factors can introduce variability, increase background signal, and negatively impact quantitative reproducibility. As illustrated in Figure 1, the valve configuration consists of three stages: (A) initial trapping, where the sample is loaded onto the Oasis MAX Column and proteins are directed to waste; (B) a fluid sweep step, in which the second valve redirects flow to actively flush previously unswept regions of the first valve and associated tubing to waste; and (C) elution, where both valves are positioned to send polysorbates to the detector.
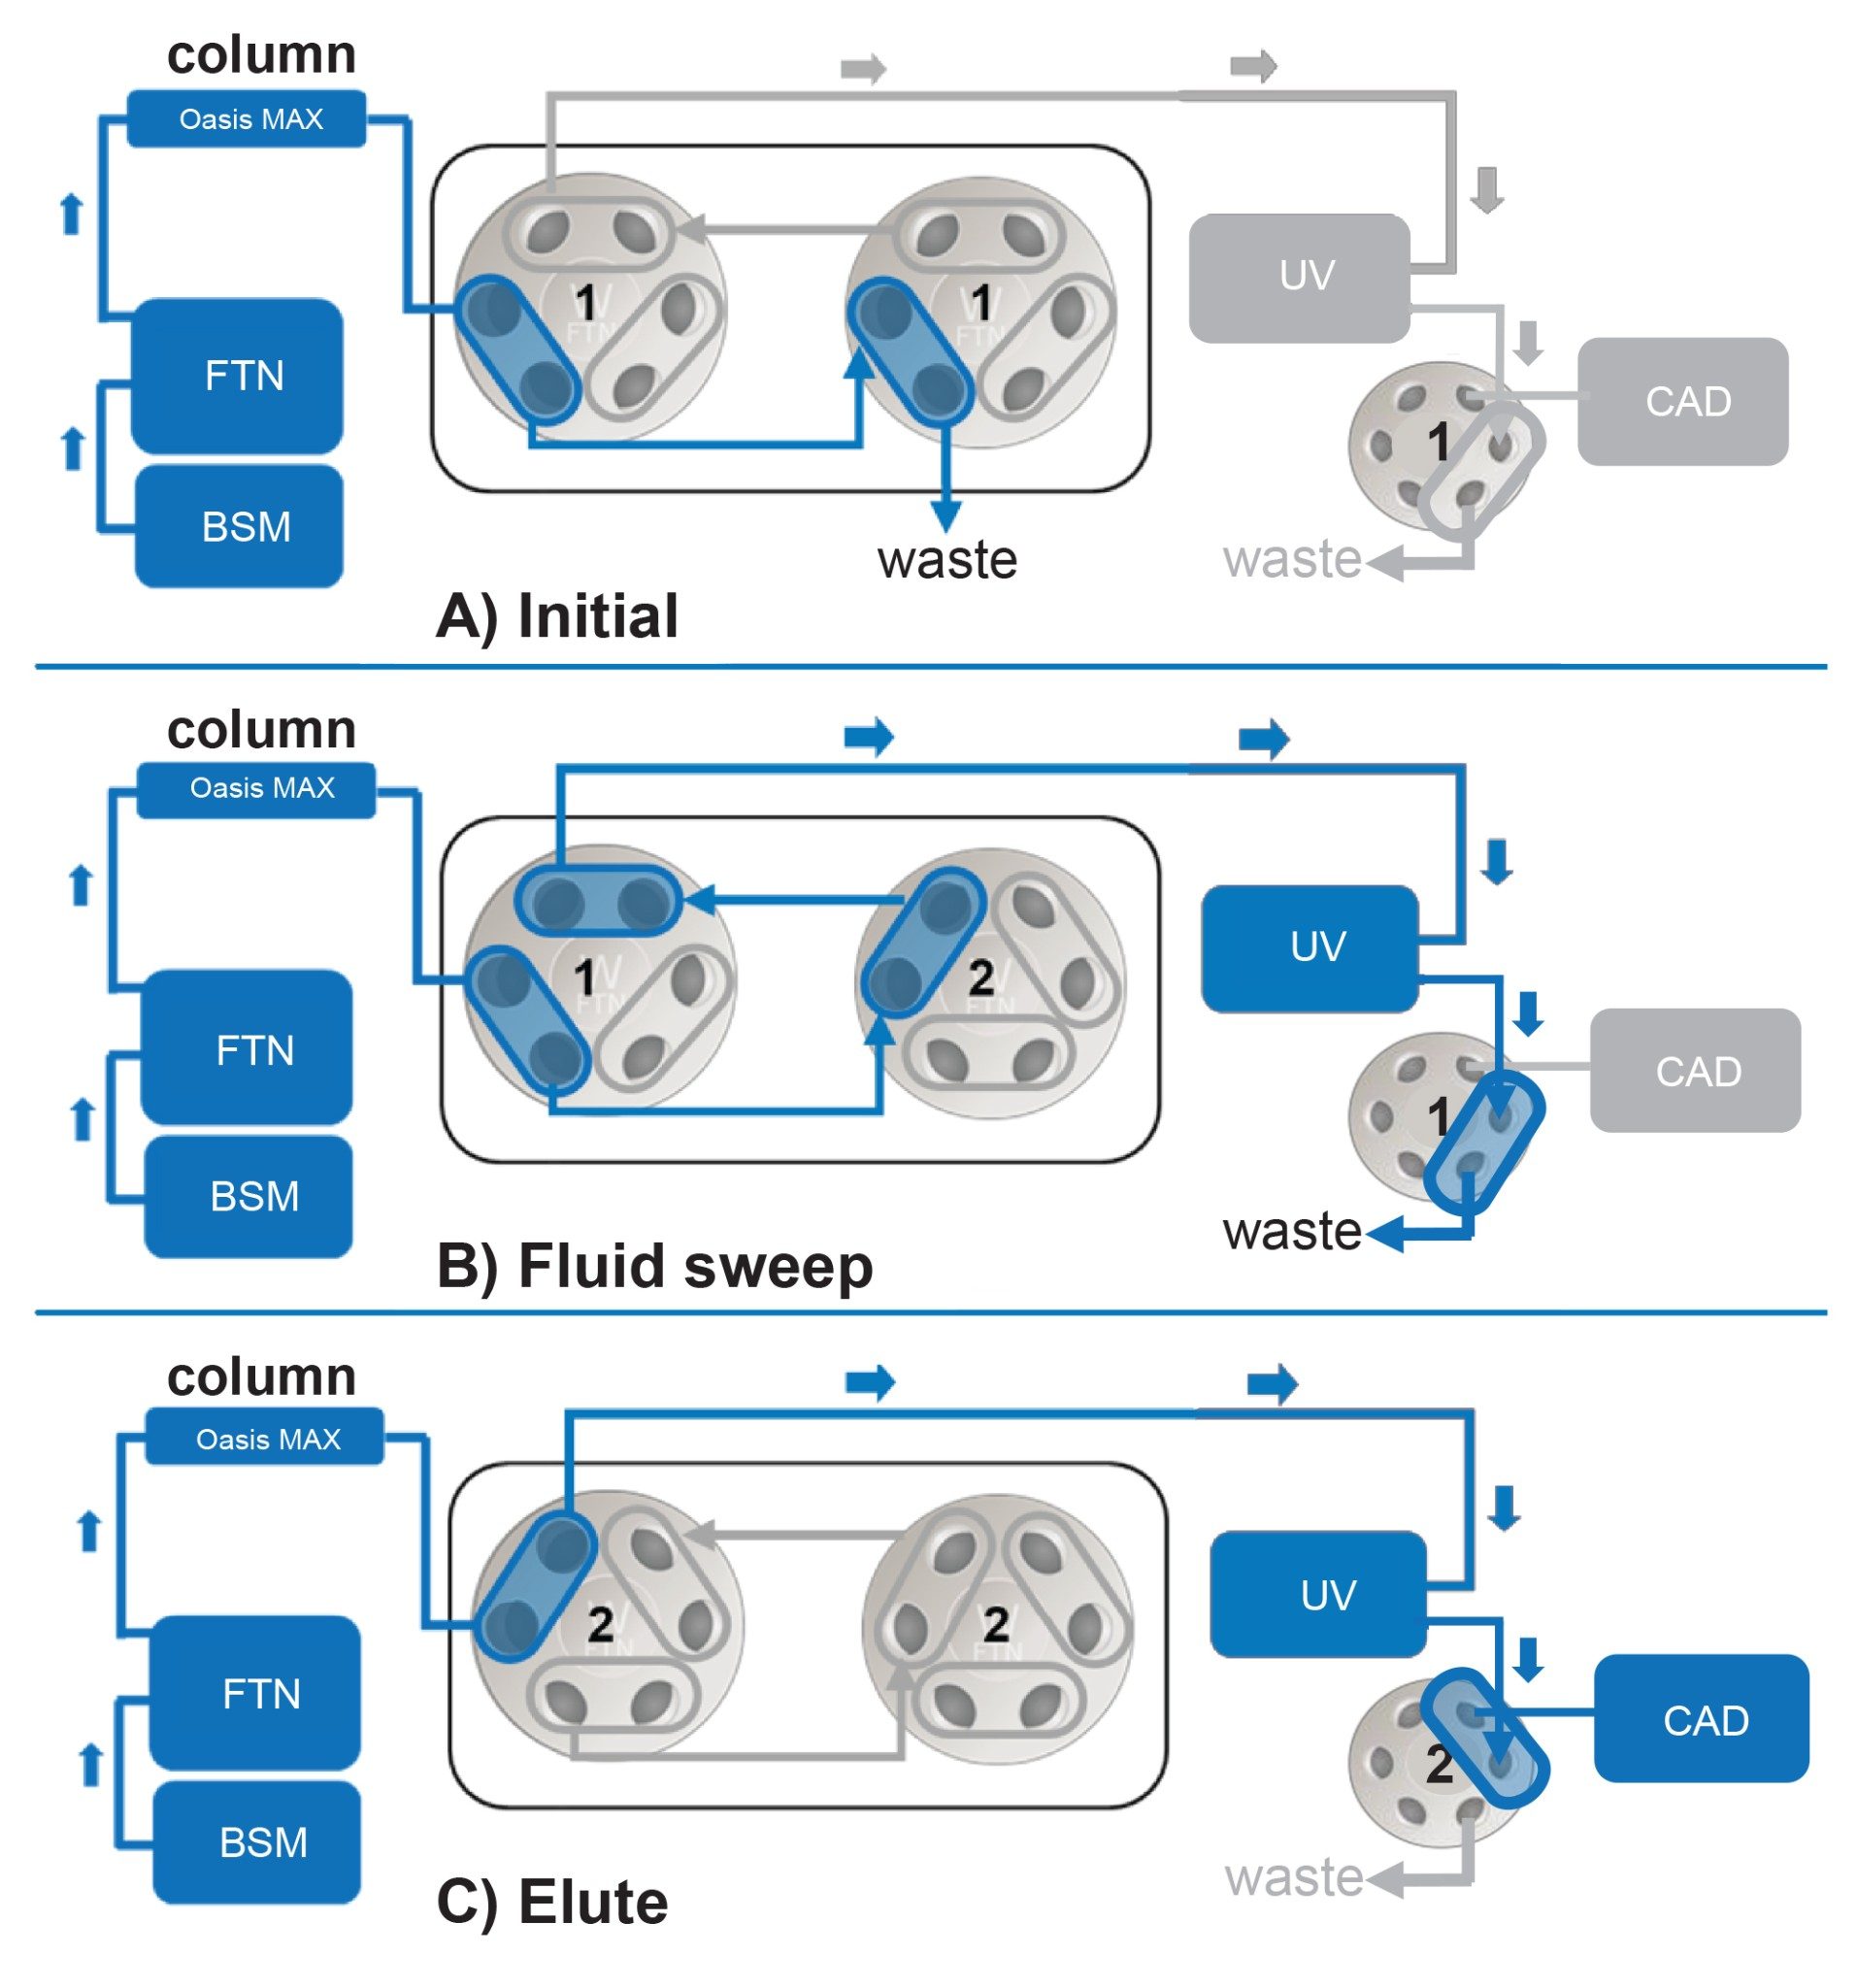
In addition, the CAD is equipped with a downstream switching valve that enables sending the fluidic pathway to either waste or directly to the detector. This functionality provides further flexibility during method optimization and routine analysis by preventing non-relevant analytes or unfavorable mobile phase conditions from reaching the detector. During early stages of the method, this valve was configured to divert flow to waste during the fluid sweep step, preventing residual protein matrix from entering the CAD. Prior to the gradient transitioning to 100% isopropanol, the valve was switched to direct flow to the detector, enabling detection of the polysorbate peak. This capability complements the double-valve column configuration by providing an additional level of control over what is introduced into the CAD. Together, these valve strategies enhance method robustness by minimizing contamination of the detector and consistent analyte delivery.
Ion Trap Voltage
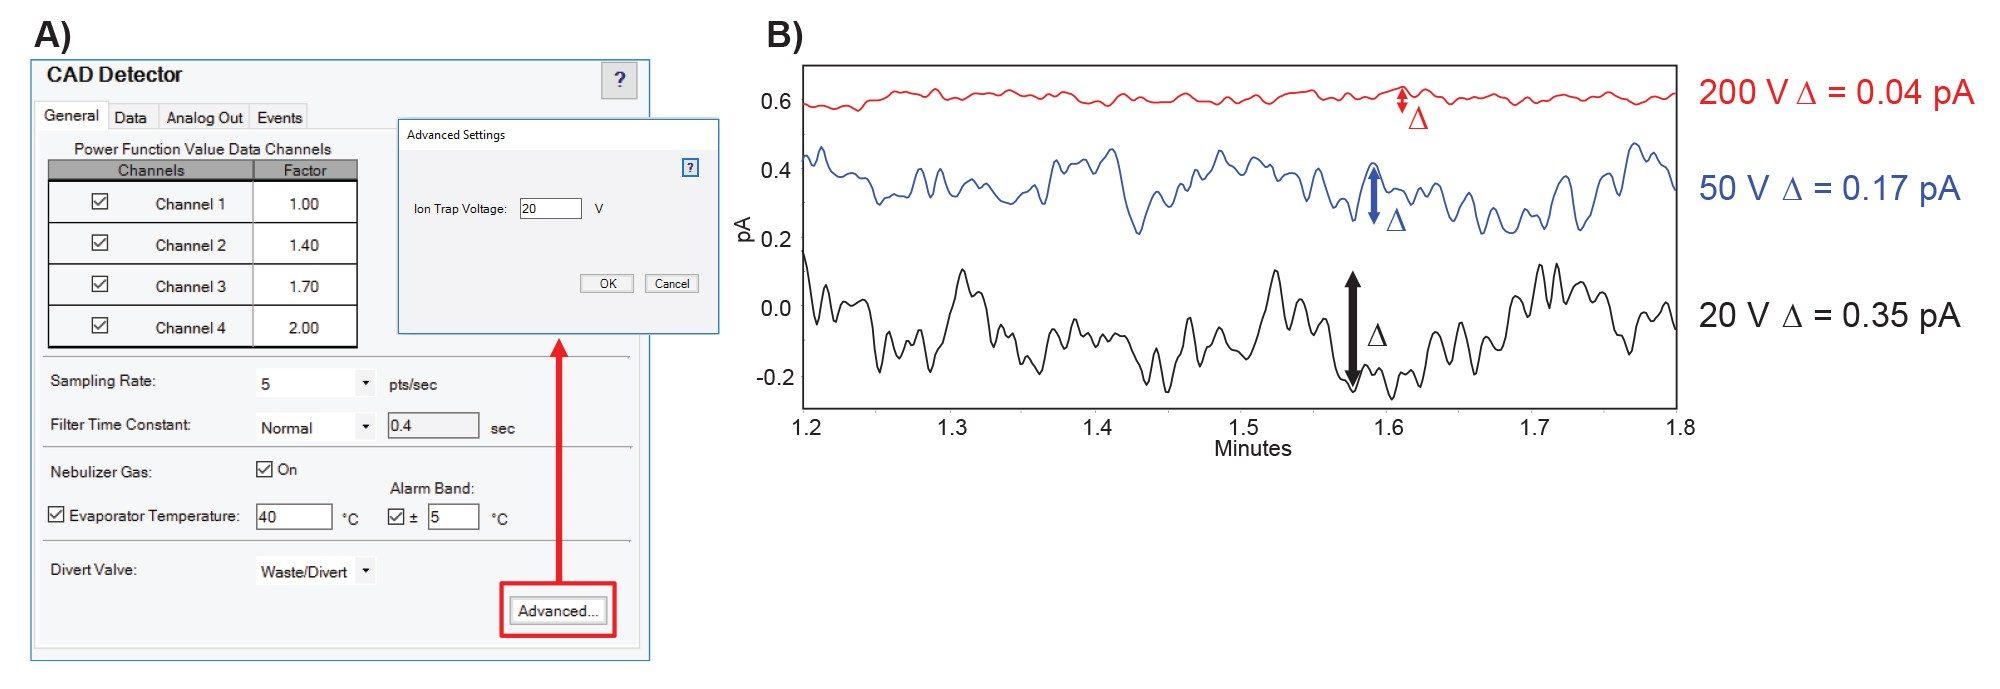
Waters has introduced an adjustable ion trap voltage as a novel method optimization parameter for CAD. As shown in Figure 2A, ion trap voltage can be configured within the advanced settings of the instrument method editor in Empower Software over a range of 20 – 600 V. This parameter controls the strength of the electric field applied within the ion trap region of the CAD, located between the mixing chamber and the electrometer. This electric field removes excess aerosol ions generated from the corona charger while allowing the larger charged analyte particles to pass to the detector. By filtering excess ions prior to detection, the ion trap helps reduce background signal and improve baseline stability. As shown in Figure 2B, increasing ion trap voltage generally lowers baseline noise and produces a more stable detector response. However, because a stronger electric field can also remove a portion of the charged analyte particles, high ion trap voltages may reduce overall analyte signal intensity. In practice, ion trap voltage is an important method optimization parameter that can be used to balance sensitivity and detector linearity. In addition, ion trap voltage can influence the optimal PFV required to achieve linear detector response. As a result, optimization of ion trap voltage provides analysts with an additional level of control over CAD performance for specific analytes and concentration ranges.
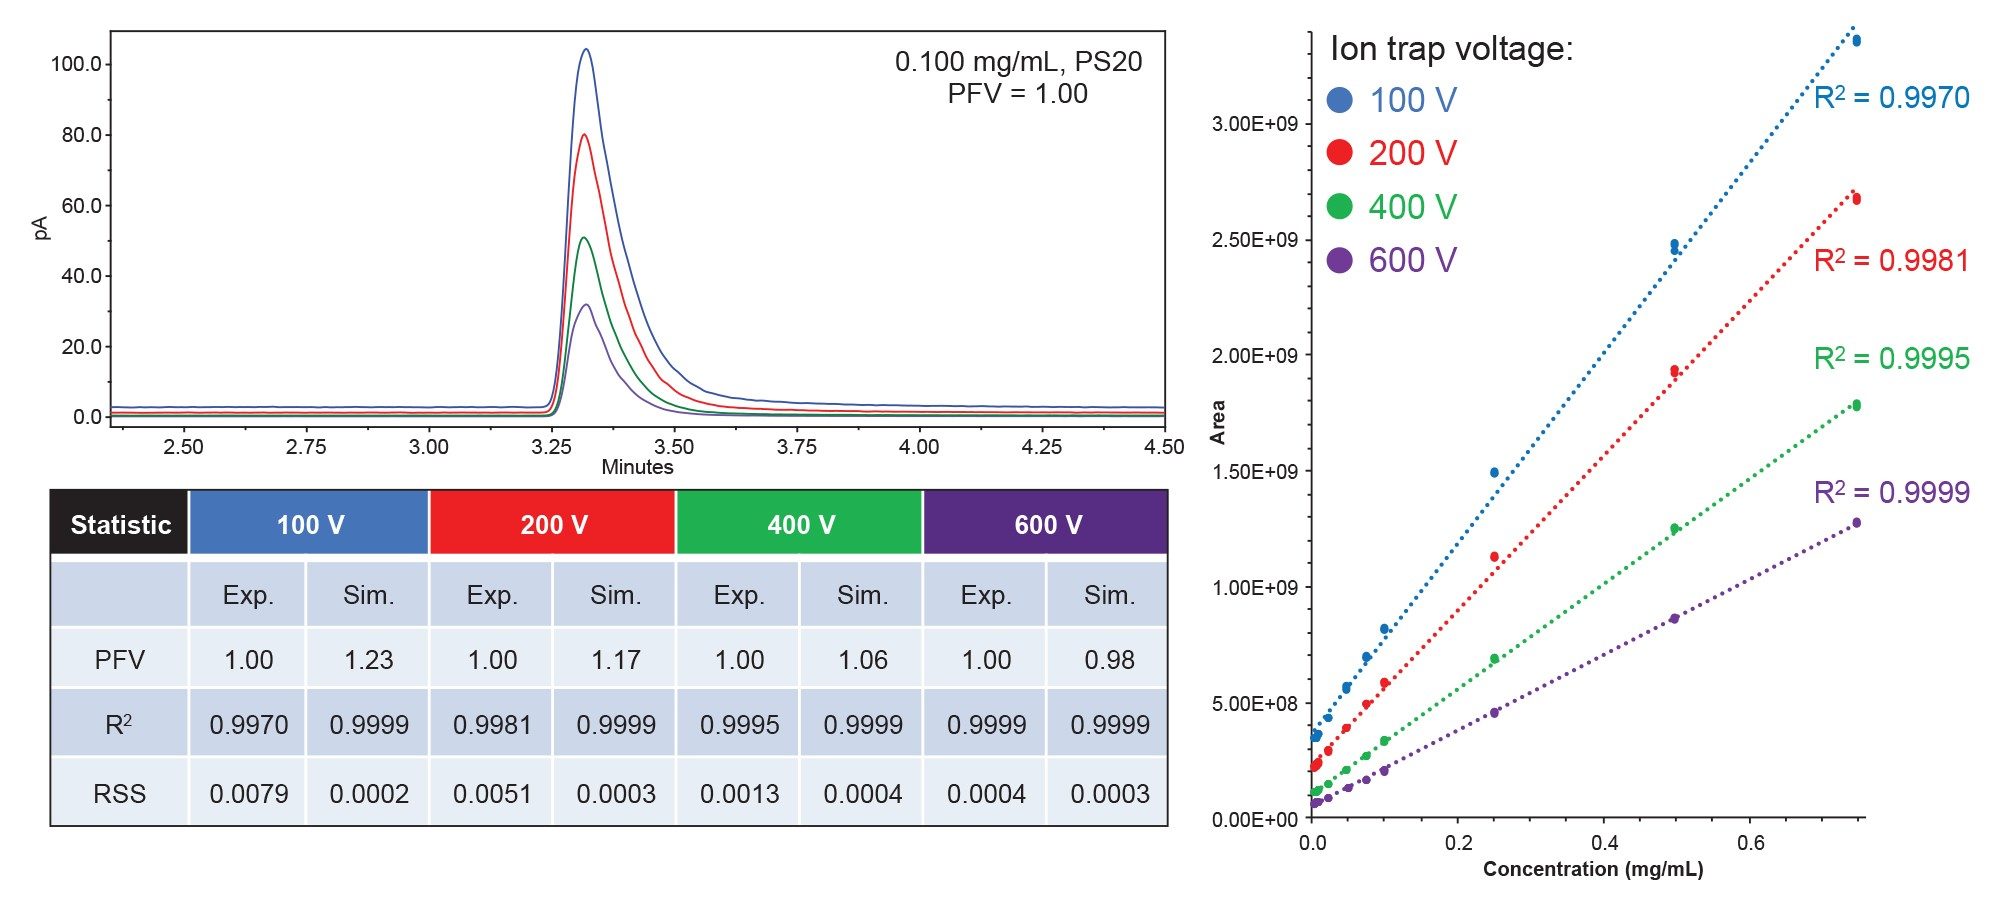
To evaluate the impact of ion trap voltage on detector response, calibration curves for PS20 (0.005–0.75 mg/mL) were generated at four ion trap voltages using a fixed PFV of 1.0. As shown in Figure 3, increasing the ion trap voltage results in a systematic decrease in detector signal intensity, consistent with more efficient removal of charged species prior to detection. However, this reduction in signal was accompanied by clear improvements in calibration performance. At lower ion trap voltages (100-200 V), the response exhibits noticeable nonlinearity, reflected by lower R² values and higher residual sum of squares (RSS). As the ion trap voltage is increased, calibration linearity improves, with the 600 V condition yielding the most linear response and the lowest RSS, indicating minimal deviation from the regression model.
In a previous application note, optimal PFVs could be predicted using an inverse power function framework.7 This approach takes calibration data at a single reference setting of PFV = 1.00 and predicts linear operating windows at different PFV settings. In the tabular results of Figure 3, the simulated PFV values (Sim.) derived from this inverse power function transformation are summarized. The simulated PFV values trend toward 1.00 as ion trap voltage increases (1.23 at 100 V to 0.98 at 600 V), confirming that higher ion trap voltages inherently produced a more linear detector response with PS20. These results demonstrate that ion trap voltage is a critical parameter for tuning CAD performance. While increasing voltage reduced absolute signal intensity, it significantly enhanced response linearity and calibration performance. Therefore, ion trap voltage and PFV should be jointly optimized to achieve the desired balance between sensitivity, linear dynamic range, and quantitative accuracy.
Calibration Evaluation
Unlike traditional UV detectors, CAD response is inherently non-linear across broad concentration ranges due to the complex relationship between analyte mass, aerosol particle formation, charging efficiency, and signal generation within the detector. As a result, calibration performance must be evaluated over a sufficiently wide concentration range during method development to properly characterize detector behavior. This approach enables identification of regions that exhibit optimal linearity, definition of an appropriate quantitative working range, and selection of detector parameters best suited to the intended application.
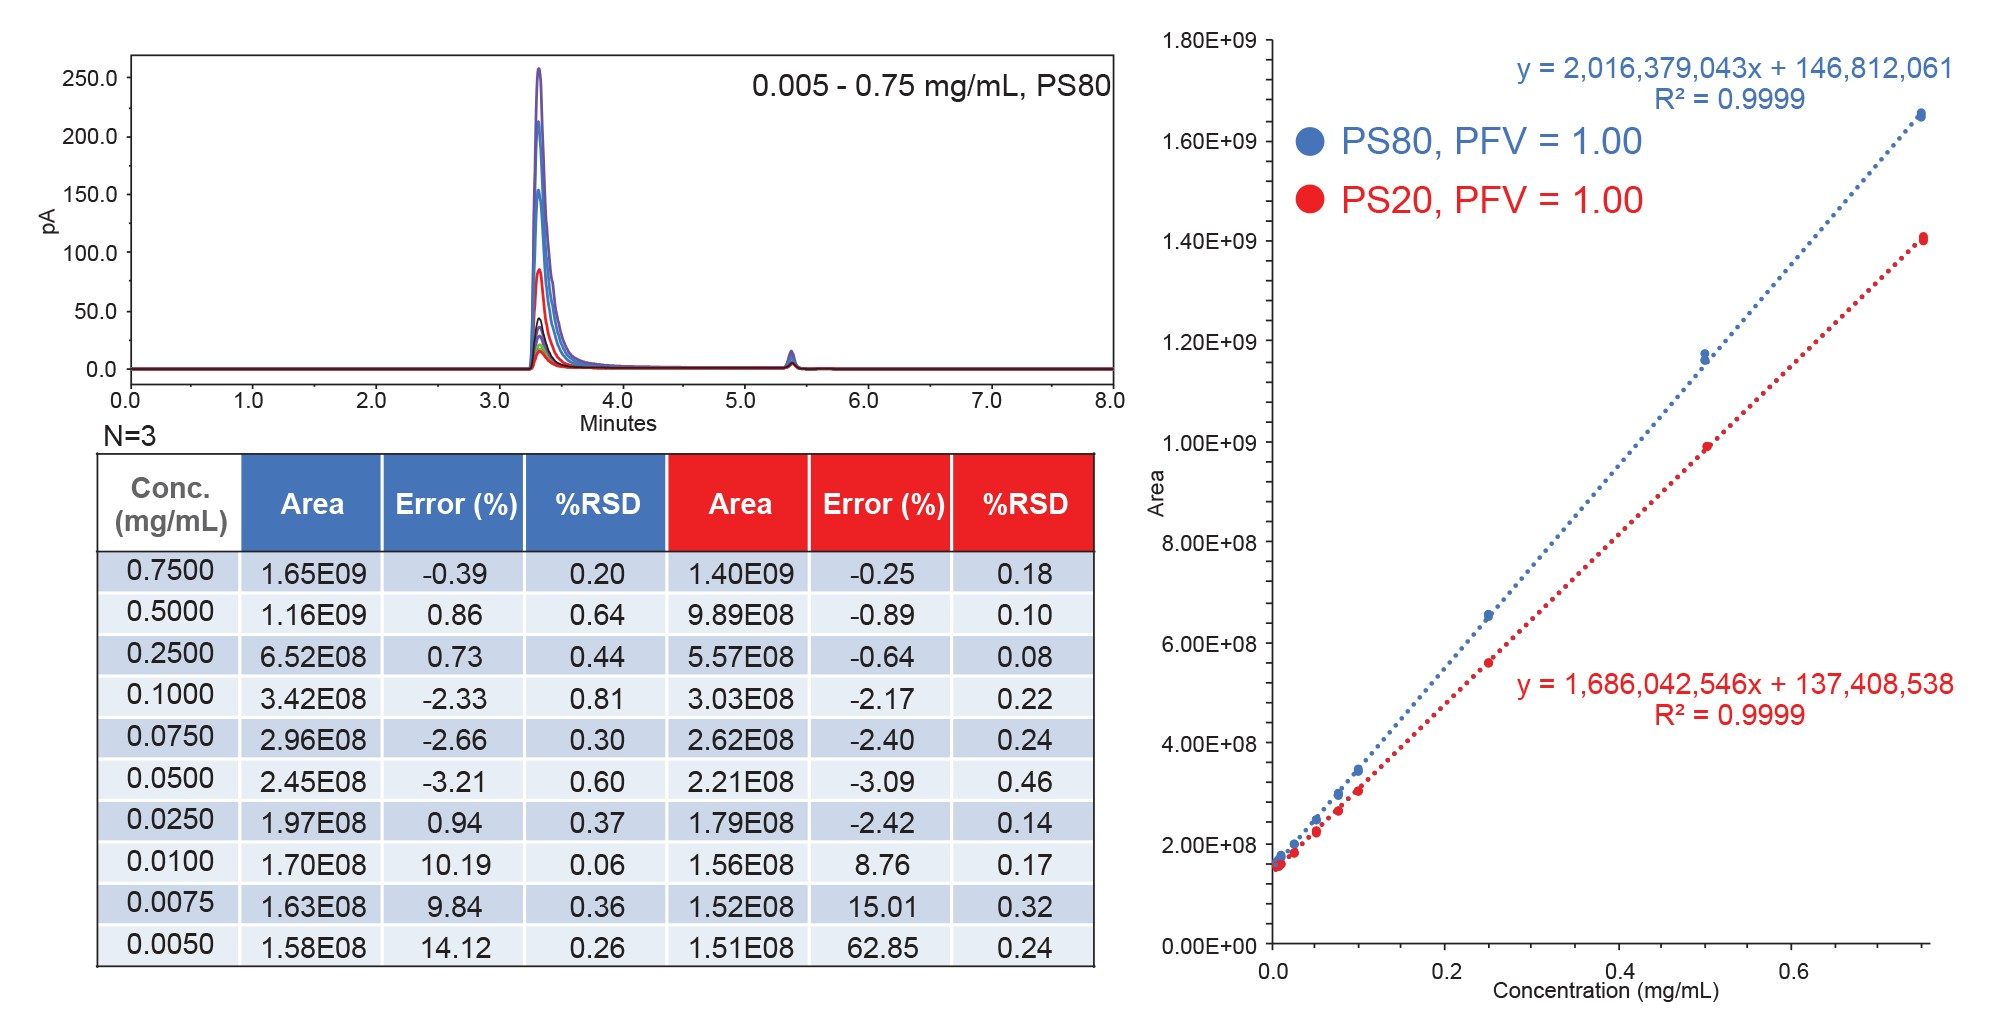
Calibration performance for PS20 and PS80 was assessed over a concentration range of 0.005 to 0.75 mg/mL to define the linear range of the detector. As shown in Figure 4, both polysorbates demonstrate strong linear behavior across this range, with R² values of 0.9999. Quantitative performance is further supported by the tabular results showing low % RSD values across all calibration levels, demonstrating excellent precision. Percent error values remain within acceptable limits for PS80 at all concentration levels, although slightly higher deviations are observed at the lowest calibration level for PS20. PS80 also exhibits a higher calibration slope than PS20, likely due to its higher average molecular weight and increased hydrophobicity, which enhance aerosol particle formation efficiency and result in greater particle mass per droplet following nebulization.
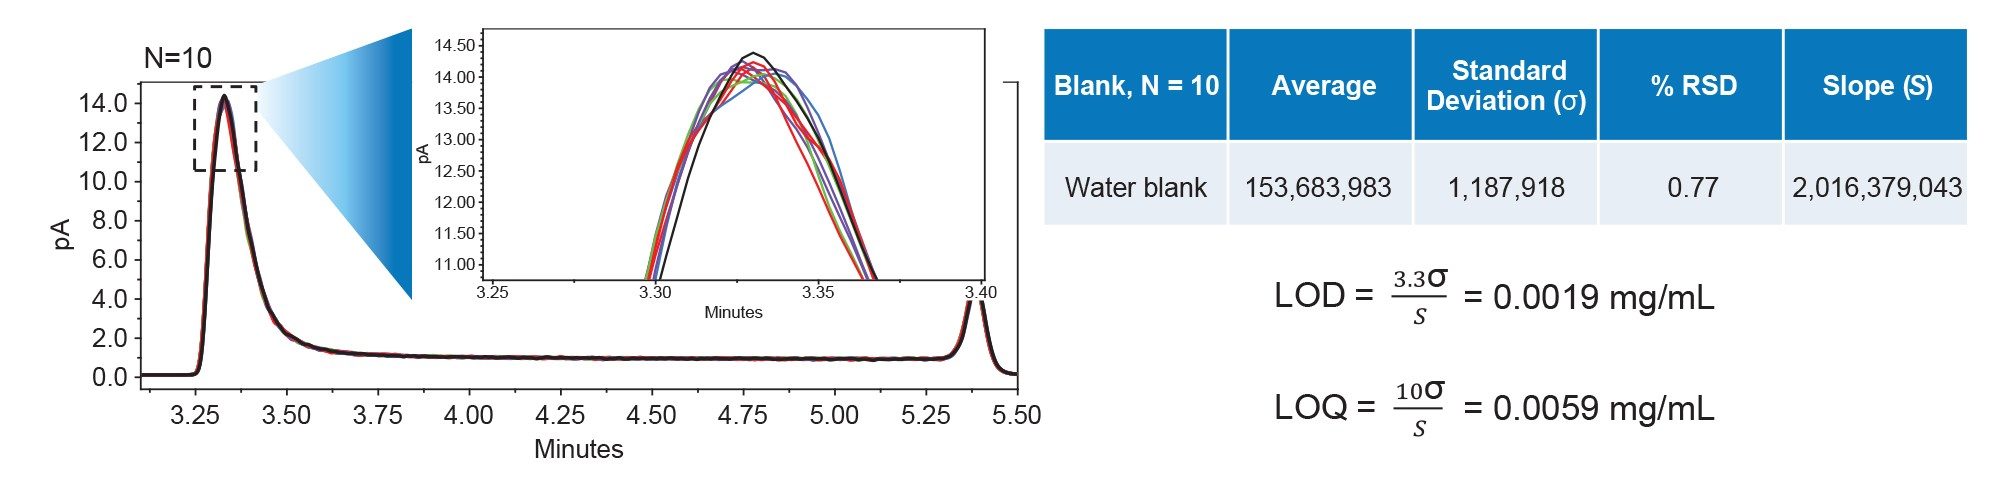
Accurate determination of the limit of detection (LOD) and the limit of quantitation (LOQ) is another critical component of method validation. Unlike conventional chromatographic methods where baseline noise can be readily isolated from discrete analyte peaks, polysorbate quantification as a single integrated peak requires a mobile phase transition from aqueous to organic composition. This abrupt solvent change produces an unavoidable gradient artifact peak that co-elutes with the polysorbate signal, precluding reliable application of traditional signal-to-noise (S/N) approaches for LOD and LOQ determination. In accordance with ICH Q2 (R2) guidelines in section 3.2.3.3, the LOD and LOQ were therefore determined using the standard deviation of the blank response.8 As shown in Figure 5, ten blank injections were acquired as part of the PS80 calibration curve sequence. The standard deviation of the blank response was calculated and divided by the slope of the calibration curve (Figure 4) to determine a LOD of 0.002 mg/mL and a LOQ of 0.006 mg/mL for the method.
Spike-recovery Analysis
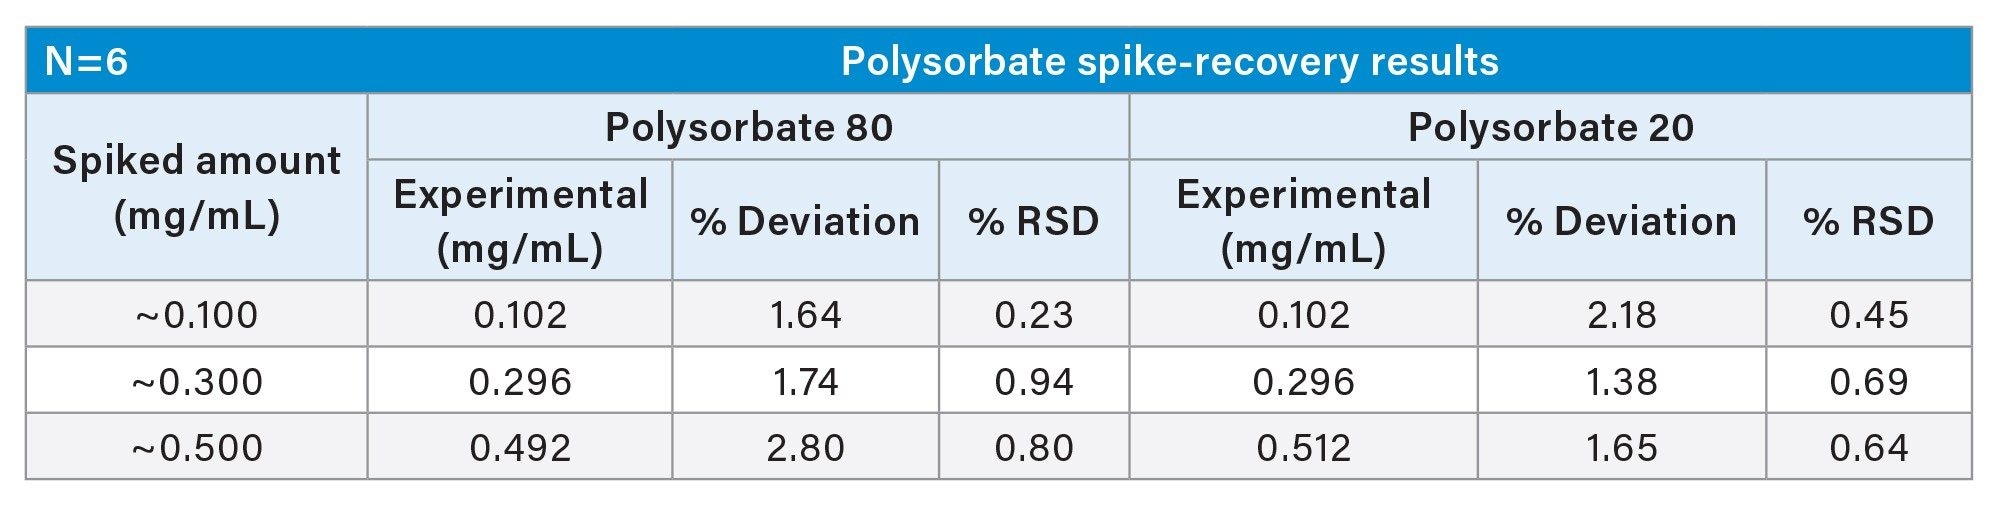
To evaluate the accuracy and practical applicability of the developed method, spike-recovery experiments were performed using a well-characterized mAb (NISTmAb) spiked with known concentrations of PS20 and PS80. NISTmAb was spiked at three concentration levels (~0.1, 0.3, and 0.5 mg/mL) and each level was injected six times to evaluate repeatability and quantitative performance for both polysorbates. As summarized in Table 1, the trap-and-elute CAD method demonstrated excellent accuracy and precision across the tested concentration ranges for both polysorbates. Measured concentrations closely matched the expected spike levels, with minimal percent deviation, demonstrating accurate recovery of both surfactants from the NISTmAb. In addition, low % RSD values across six replicate injections highlight method repeatability and consistent detector performance. These results demonstrate that the trap-and-elute workflow can effectively remove proteins while maintaining consistent polysorbate recovery and quantitative performance. The accuracy and precision obtained in this study highlights the stability of the Waters CAD for routine polysorbate analysis in biopharmaceutical formulations.
Empower CDS as Compliant-ready Solution
Beyond analytical performance, a significant advantage of Waters CAD is its seamless integration within the Empower Chromatography Data System (CDS) environment. Through Empower Software, all aspects of data acquisition, processing, calibration modeling, system suitability evaluation, and quantitative reporting can be managed within a simple integrated platform, simplifying both method development and long-term data management.9 Built-in processing methods, automated calibration curve generation, custom field calculations, and audit trail functionality enable standardized workflows that support data traceability and regulatory compliance. In addition, method parameters, processing settings, and reporting templates can be centrally controlled and consistently applied across multiple instruments, analysts, and laboratories, reducing method variability and facilitating technology transfer.
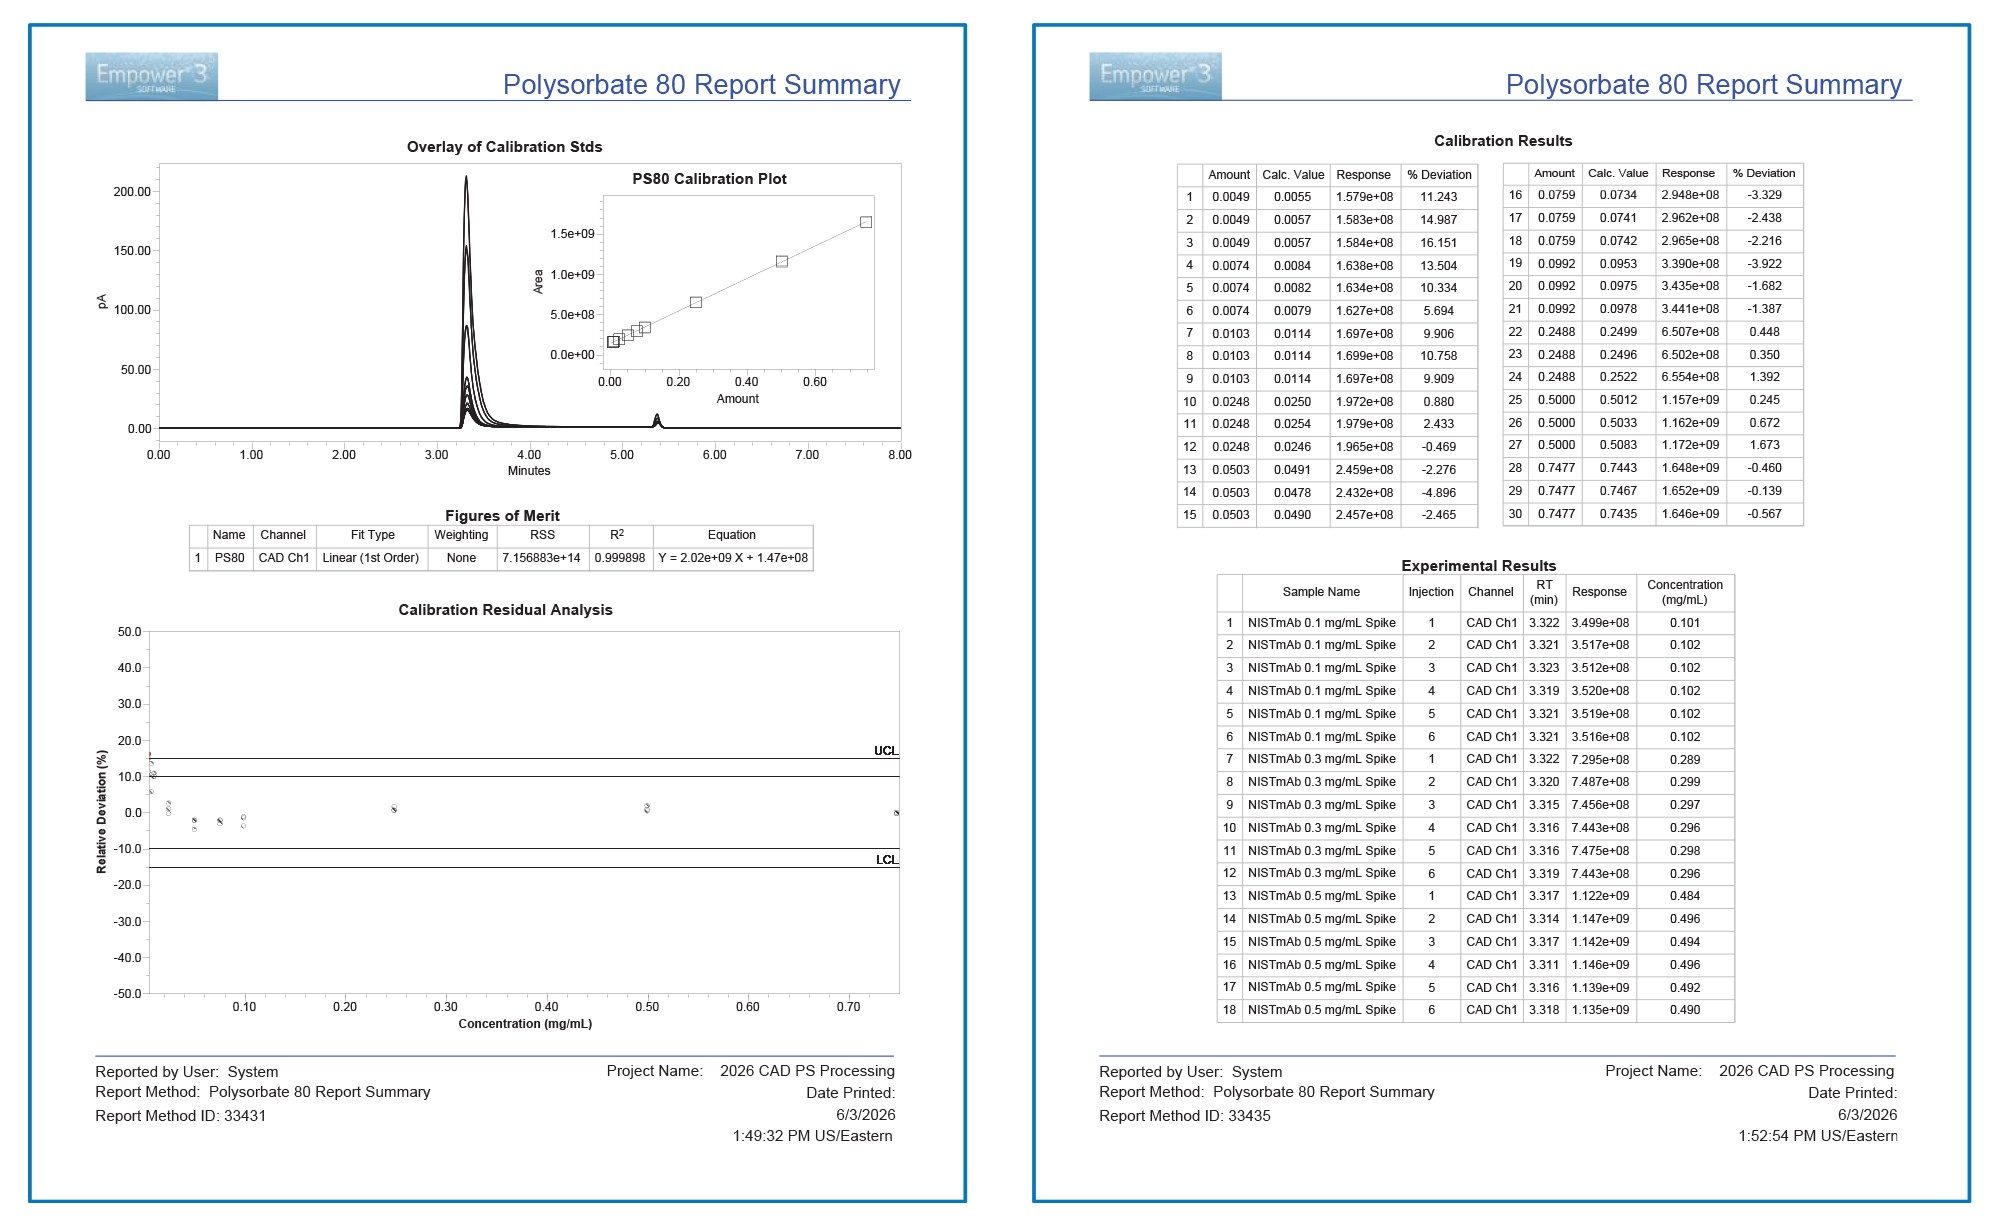
As shown in Figure 6, experimental results including calibration linearity, residual analysis, and experimental results can be automatically compiled within a single, customizable report. Advanced reporting capabilities allow users to incorporate chromatographic data, calibration plots, statistical evaluations, and pass/fail criteria into a unified document, eliminating the need to manually assemble data from multiple software packages. Customizable reports and automated processing tools within Empower Software further reduce the need for external calculations, spreadsheet manipulation, or manual data transcription, minimizing opportunities for user error while improving data integrity, consistency, and overall reproducibility. By consolidating data acquisition, processing, review, and reporting within a validated software environment, the combination of Waters CAD and Empower CDS provides a streamlined, scalable, and compliance-ready approach for CAD-based analysis in biopharmaceutical applications.
Conclusion
This application note highlights the advantages of CAD as a robust and broadly applicable platform for polysorbate quantification in protein matrices. CAD provides a near-universal response to non-volatile analytes, enabling consistent detection of surfactants such as PS20 and PS80 without dependence on chromophores or ionizable functional groups. When coupled with a trap-and-elute workflow that elutes polysorbates as a single consolidated peak, CAD delivers reproducible response across two orders of magnitude for both PS20 and PS80. The study further demonstrates that CAD performance can be optimized through key operating parameters, including ion trap voltage and PFV, to balance sensitivity, noise suppression, and linearity. These adjustable parameters improve method robustness and extend the linear dynamic range while maintaining strong reproducibility and quantitative accuracy in both calibration and spike-recovery studies. Overall, CAD combined with a trap-and-elute strategy provides a reliable, regulation-ready approach for polysorbate analysis, supporting consistent performance in routine biopharmaceutical quality control.
References
- Martos, A; et al. Trends on Analytical Characterization of Polysorbates and Their Degradation Products in Biopharmaceutical Formulations. J Pharm Sci. 2017 Jul 106(7) 1722-1735.
- Marine, J. E; Menon, S. R; Rumbelow, S.J. Chapter 3 - Surfactants (polysorbate and poloxamer): Synthesis, Characterization, and Degradation. Surfactants in Biopharmacuetical Development. 2023, 23-57.
- Fekete, S; Ganzler, K; Fekete, J. Fast and Sensitive Determination of Polysorbate 80 in solutions containing proteins. J Pharm Biomed Anal. 2010 Sep 5;52(5) 672-679.
- Li, X; Wang, F; Li, H; Richardson, D.D; Roush, D.J. The Measurement and Control of High-Risk Host Cell Proteins for Polysorbate Degradation in Biologics Formulation. Antibody Ther. 2022 Jan 5(1) 42-54.
- Hewitt, D; Zhang, T; Kao, T. Quantitation of Polysorbate 20 in Protein Solutions Using Mixed-Mode Chromatography and Evaporative Light Scattering Detection. Journal of Chromatography A. 2008 Nov 1215(1-2) 156–160.
- Shi, S; et al. Highly Sensitive Method for the Quantitation of Polysorbate 20 and 80 to Study the Compatibility between Polysorbates and m-Cresol in the Peptide Formulation. J. Anal Bioanal Tech. 2015 6;3.
- Birdsall, RE; et al. Predicting Linear Operating Range for Charged Aerosol Detection Using an Inverse Power Function Framework. Waters Application Note. June 2026. 720009440.
- ICH Q2(R2) Guideline on Analytical Procedure Development. International Council for Harmonisation of Technical Requirements for Pharmaceuticals for Human Use. November 2023.
- Birdsall, RE; Du, X; Bigos, P; Han, D; Bhiwankar, N. Automating Charged Aerosol Detection (CAD) Analysis with Empower CDS Using a Single-Vendor Integrated LC Platform. Waters Application Note. April 2026. 720009297.
Featured Products
720009502, July 2026


