For research use only. Not for use in diagnostic procedures.
- Main
-
For research use only. Not for use in diagnostic procedures.
Rui Chena, Julie Wushenskya, Daniel Udeb, Yun Alelyunasa, Kelvin Leeb
aWaters Corporation, Immerse™ Lab Delaware, United States
bChemical & Biomolecular Engineering, University of Delaware, United States
Published on April 17, 2026
For research use only. Not for use in diagnostic procedures.
This study presents a shortened 10-minute HILIC method for released N-glycan analysis that delivers glycan profiling equivalent to a conventional 55-minute method while substantially increasing analytical throughput. Despite reduced resolution of certain glycan isomers, the accelerated method preserves accurate profiling of major and clinically relevant glycan attributes, including galactosylation state, core fucosylation, and high-mannose content. Application to cell culture samples with targeted glycosylation modulation demonstrates that the method is fit-for-purpose for high-throughput process development and routine quality control.
Antibodies have become a dominant class of biotherapeutics, driven by their strong clinical performance across oncology, autoimmune disease, and infectious indications.1,2 As manufacturing scale increases and product modalities diversify, analytical characterization now plays a pivotal role in ensuring molecular consistency and regulatory compliance. Advances in separation science and mass spectrometry have heightened the demand for rapid, quantitative assays capable of monitoring CQAs with sufficient sensitivity and throughput to support modern bioprocessing operations.
Among these CQAs, N-linked glycosylation of the fragment crystallizable (Fc) region is a key determinant of monoclonal antibody structure, effector function, and pharmacokinetics.3,4 Immunoglobulin G (IgG) Fc glycans undergo sequential enzymatic processing in the endoplasmic reticulum (ER) and Golgi apparatus, resulting in a continuum of maturity states. Immature glycans include high-mannose forms (e.g., Man5–Man9), while partially processed hybrid glycans retain mannose on one antenna. Fully processed complex-type glycans, characterized by branching, core fucosylation, and terminal galactosylation, represent the most mature class.4 Within this group, G0, G1, and G2 glycans reflect increasing degrees of terminal galactosylation, with G2 as the most processed; these structures typically appear as G0F, G1F, and G2F in recombinant IgG1.5
Because glycan maturity influences Fcγ receptor (FcγR) interactions, complement activation, and clearance behavior, quantitative monitoring of G0/G1/G2 species is essential for assessing both process performance and product quality.5–7 Immature high-mannose species can accelerate serum clearance,7 whereas lower galactosylation reduces complement engagement.4 In contrast, mature galactosylated structures enhance C1q binding and complement-dependent cytotoxicity (CDC), while core fucosylation diminishes FcγRIIIa binding and antibody-dependent cellular cytotoxicity (ADCC).5,6 As such, glycan maturity profiles serve as sensitive indicators of biosynthetic efficiency, functional quality, and lot-to-lot consistency. In addition to individual species, categorical indicators such as total %fucosylation and %galactosylation serve as high-level markers for biosynthetic efficiency and lot-to-lot consistency.
Released glycan profiling remains the benchmark technique for quantitative characterization of Fc region glycosylation in therapeutic IgG. In this approach, N-glycans are enzymatically released, most commonly using peptide-N-glycosidase F (PNGase F), derivatized with fluorescent or mass-spectrometry-active labels, and separated by hydrophilic interaction liquid chromatography (HILIC) coupled to fluorescence and/or LC–MS detection.8-10 This workflow enables sensitive and specific quantitation of high-mannose, hybrid, and mature complex-type glycans, including resolution of galactosylation states such as G0, G1, and G2, which are widely used to assess glycan maturity and process consistency.4,7 As a result, released-glycan profiling is routinely applied in lot release testing, comparability assessments, biosimilarity evaluations, and extended analytical characterization of monoclonal antibody products.9
Recent advances in labeling chemistry have improved sensitivity and reduced preparation time for released glycan profiling. Chromatographic separation, however, remains the primary bottleneck, often exceeding 30–60 minutes per analysis.9,10 These extended analysis times constrain throughput for high-throughput applications such as clone screening, upstream process development, and near real-time bioprocess monitoring. The work presented here describes the evaluation of a shortened HILIC gradient that enables accelerated released glycan analysis while preserving the resolution required for confident relative quantitation of glycan maturity.
NISTCHO is a non-originator Chinese hamster ovary (CHO) cell line engineered to express a version of the NIST monoclonal antibody (NISTmAb) immunoglobulin G1 (IgG1).11 Fed-batch cultures were initiated by seeding expanded NISTCHO cells into 500 mL shake flasks with a 100 mL working volume at an initial viable cell density of 0.4 × 10⁶ cells mL-1. Cultures were maintained in chemically defined EX-CELL CD CHO Fusion medium (Sigma-Aldrich) and transitioned to chemically defined EX-CELL Fed-Batch medium (Sigma-Aldrich) for production.
Beginning on Day 3, cultures were supplemented with glucose as needed to maintain a setpoint concentration of 6 g L⁻¹ throughout the fed-batch duration. Cultures received a 5% (v/v) addition of Advanced CHO Feed 1 (Sigma-Aldrich) on Day 3. Starting on Day 5 and every other day thereafter, modified feeds were supplemented with either 2 F-peracetyl-fucose (2-FP) at a concentration of 800 µM or galactose at 600 mM to modulate Fc glycosylation profiles. Cultures receiving no additional supplementation served as controls.
Viable cell density and cell viability were measured using automated trypan blue exclusion, and metabolite concentrations were monitored using a BioProfile FLEX2 analyzer (Nova Biomedical).
Clarified cell culture media samples were purified using a modified Protein A resin-based purification protocol implemented on an Andrew+TM Liquid Handling Robot (Waters Corporation),12 as previously described. Briefly, antibody present in the samples was captured by binding to the Protein A resin, followed by washing steps to remove residual media components. The bound antibodies were subsequently eluted using 0.1% formic acid (Thermo Fisher Scientific). Purified antibody samples were then stored at -80 °C until further analysis.
This automated workflow was extended to the glycan release step. N-glycans from purified antibody samples were released and labeled using a custom automated protocol on the Andrew+ Liquid Handling Robot with reagents from the GlycoWorksTM RapiFluor-MSTM N-Glycan Kit (p/n: 176003606). Briefly, 10 µL of purified samples were combined with 10 µL of RapiGestTM SF surfactant and heated at 90 °C for 3 minutes. Samples were then allowed to cool to room temperature for 3 minutes, after which 10 µL of diluted PNGase F was added to release N-glycans. The mixture was incubated at 50 °C for 5 minutes, followed by cooling at room temperature for 3 minutes. For glycan labeling, 10 µL of reconstituted RapiFluor-MS Reagent was added, and the labeling reaction was allowed to proceed and self-quench for 5 minutes at room temperature. The labeled glycans were subsequently loaded with acetonitrile onto a µElutionTM Plate, washed, and eluted according to the GlycoWorks Care and Use Manual.13 The eluted glycans were diluted with GlycoWorks SPE Reagents, and the diluted samples were directly analyzed.
Two commercially available glycan standards (Waters Corporation) were used for method development and performance evaluation (results not shown): the RapiFluor-MS Glycan Performance Test Standard (p/n: 186007983) and the RapiFluor-MS High Mannose Standard (p/n: 186008317). Prior to analysis, 50 µL of ultrapure water was added directly to each vial, and samples were vortexed to ensure complete dissolution.
Glycan analysis was performed using a BioAccordTM Premier BSM high-resolution Mass Spectrometry System (Waters Corporation) equipped with an ACQUITYTM Premier UPLCTM System. Key experimental parameters and gradient profiles are listed in Table 1 and 2, respectively. The 55-minute HILIC gradient and method parameters were derived from the GlycoWorks RapiFluor-MS N-Glycan Kit Care and Use Manual.13
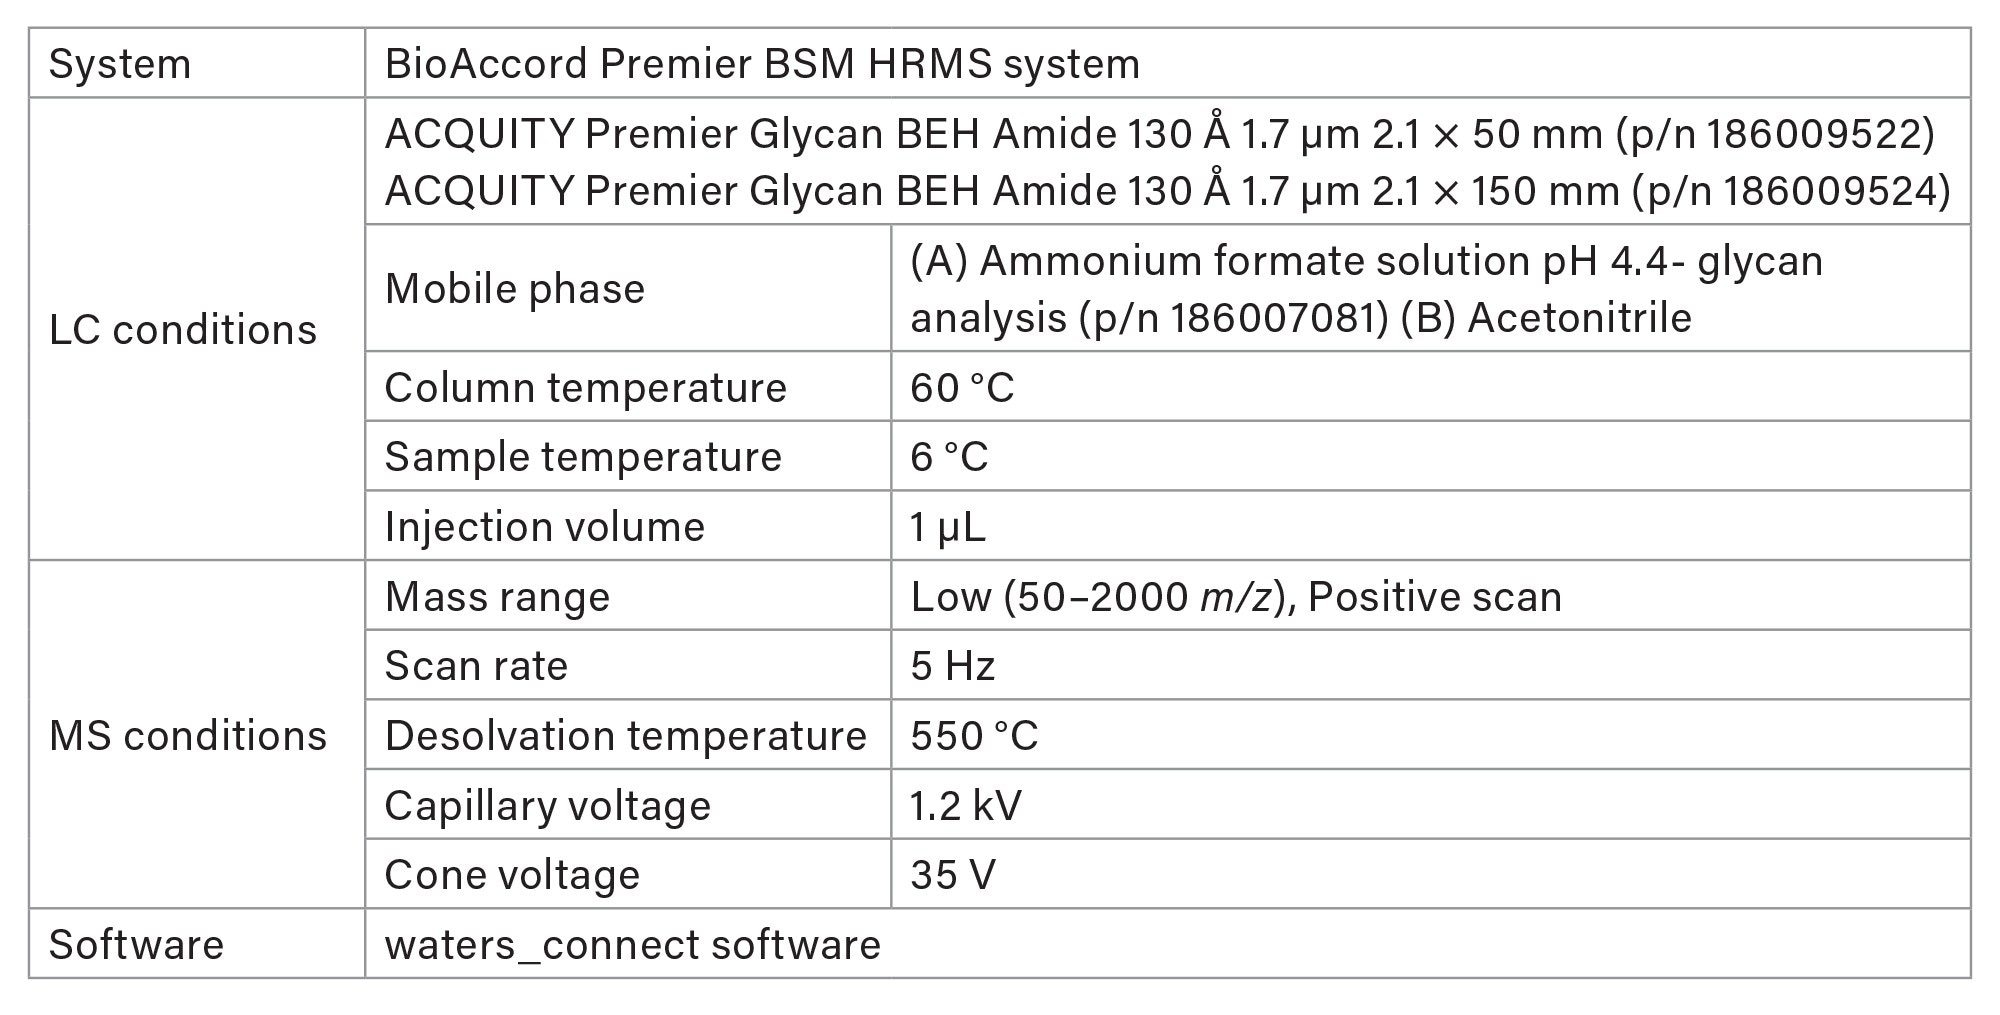
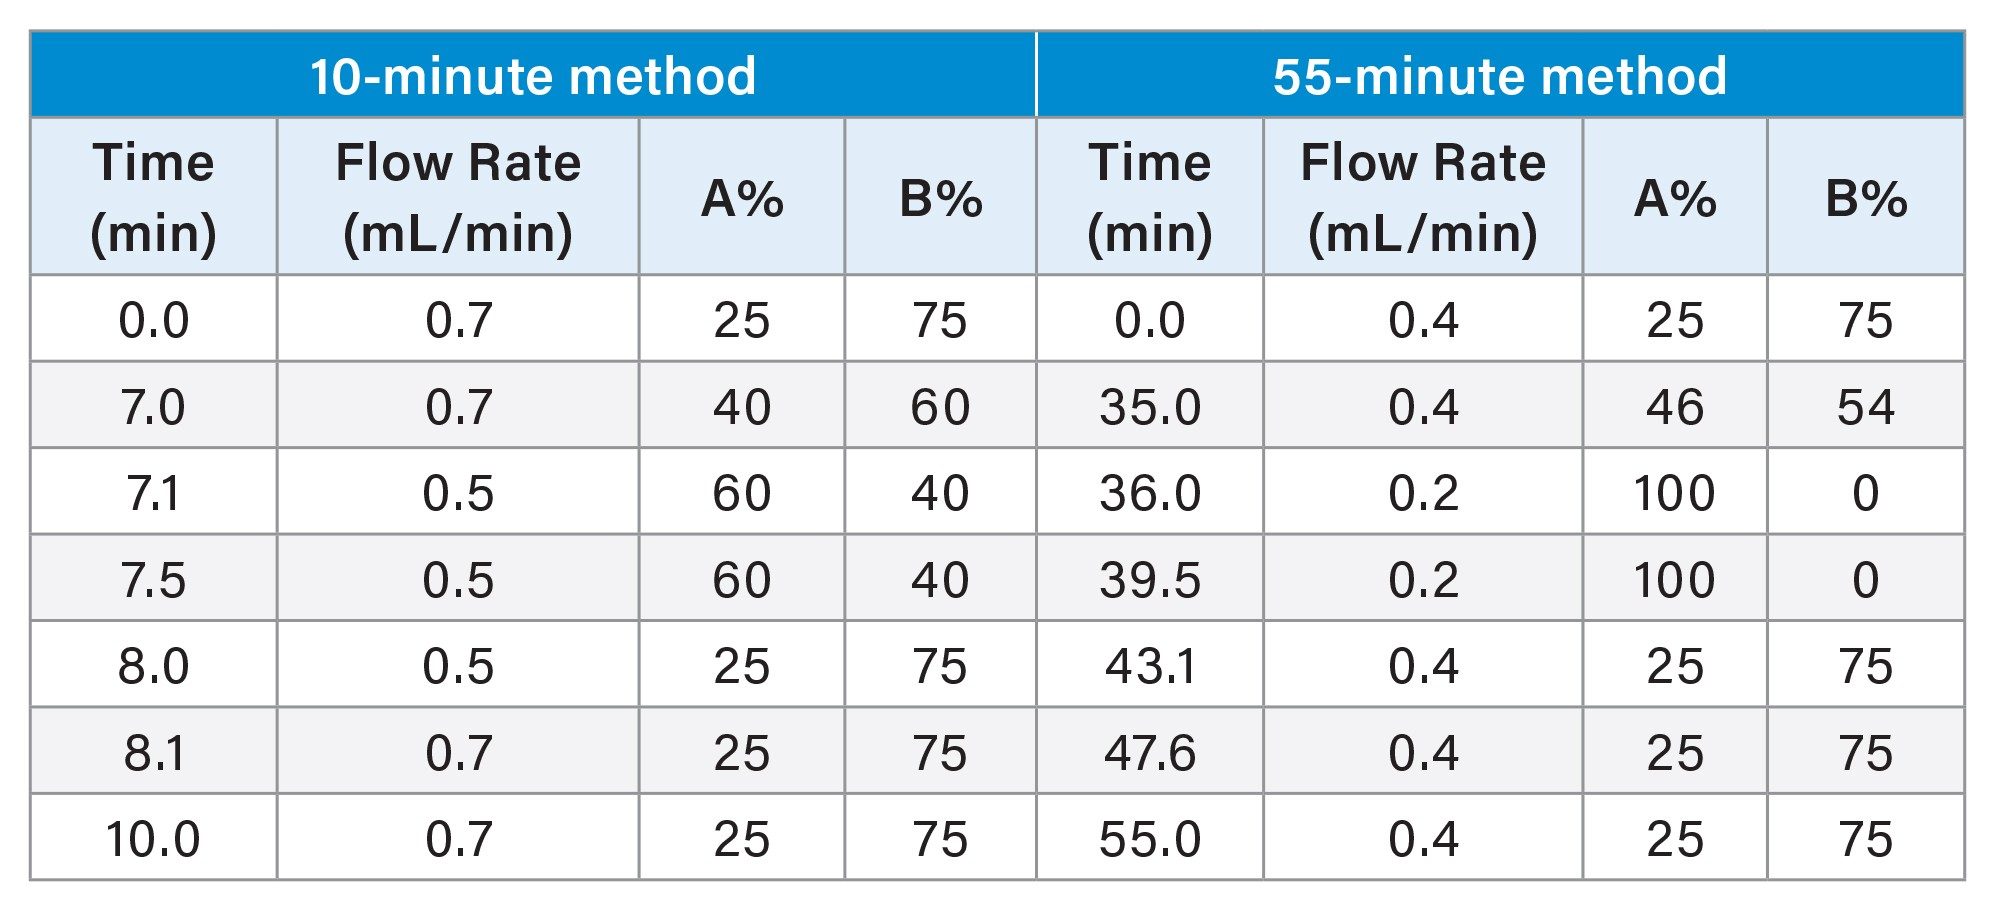
Figure 1 shows extracted ion chromatograms (XIC) obtained from the control sample using the conventional 55-minute gradient on a 150 mm column and the shortened 10-minute gradient on a 50 mm column. The use of XICs allows for the precise isolation of glycan mass classes in a complex matrix. In both methods, the major Fc glycans (G0F, total G1F, and G2F), are baseline separated from one another. The 10-minute method represents 80% reduction in run time, for example, GF1 eludes at 3 minutes using the 10-minute method compared to 16-minute in 55-minute method. For positional isomers such as G1F, there is peak overlap due to reduced chromatographic resolution as expected using the 10-minute method. Due to this and other potential peak overlaps using the 10-minute method, mass specific detection is needed for individual glycan detection.
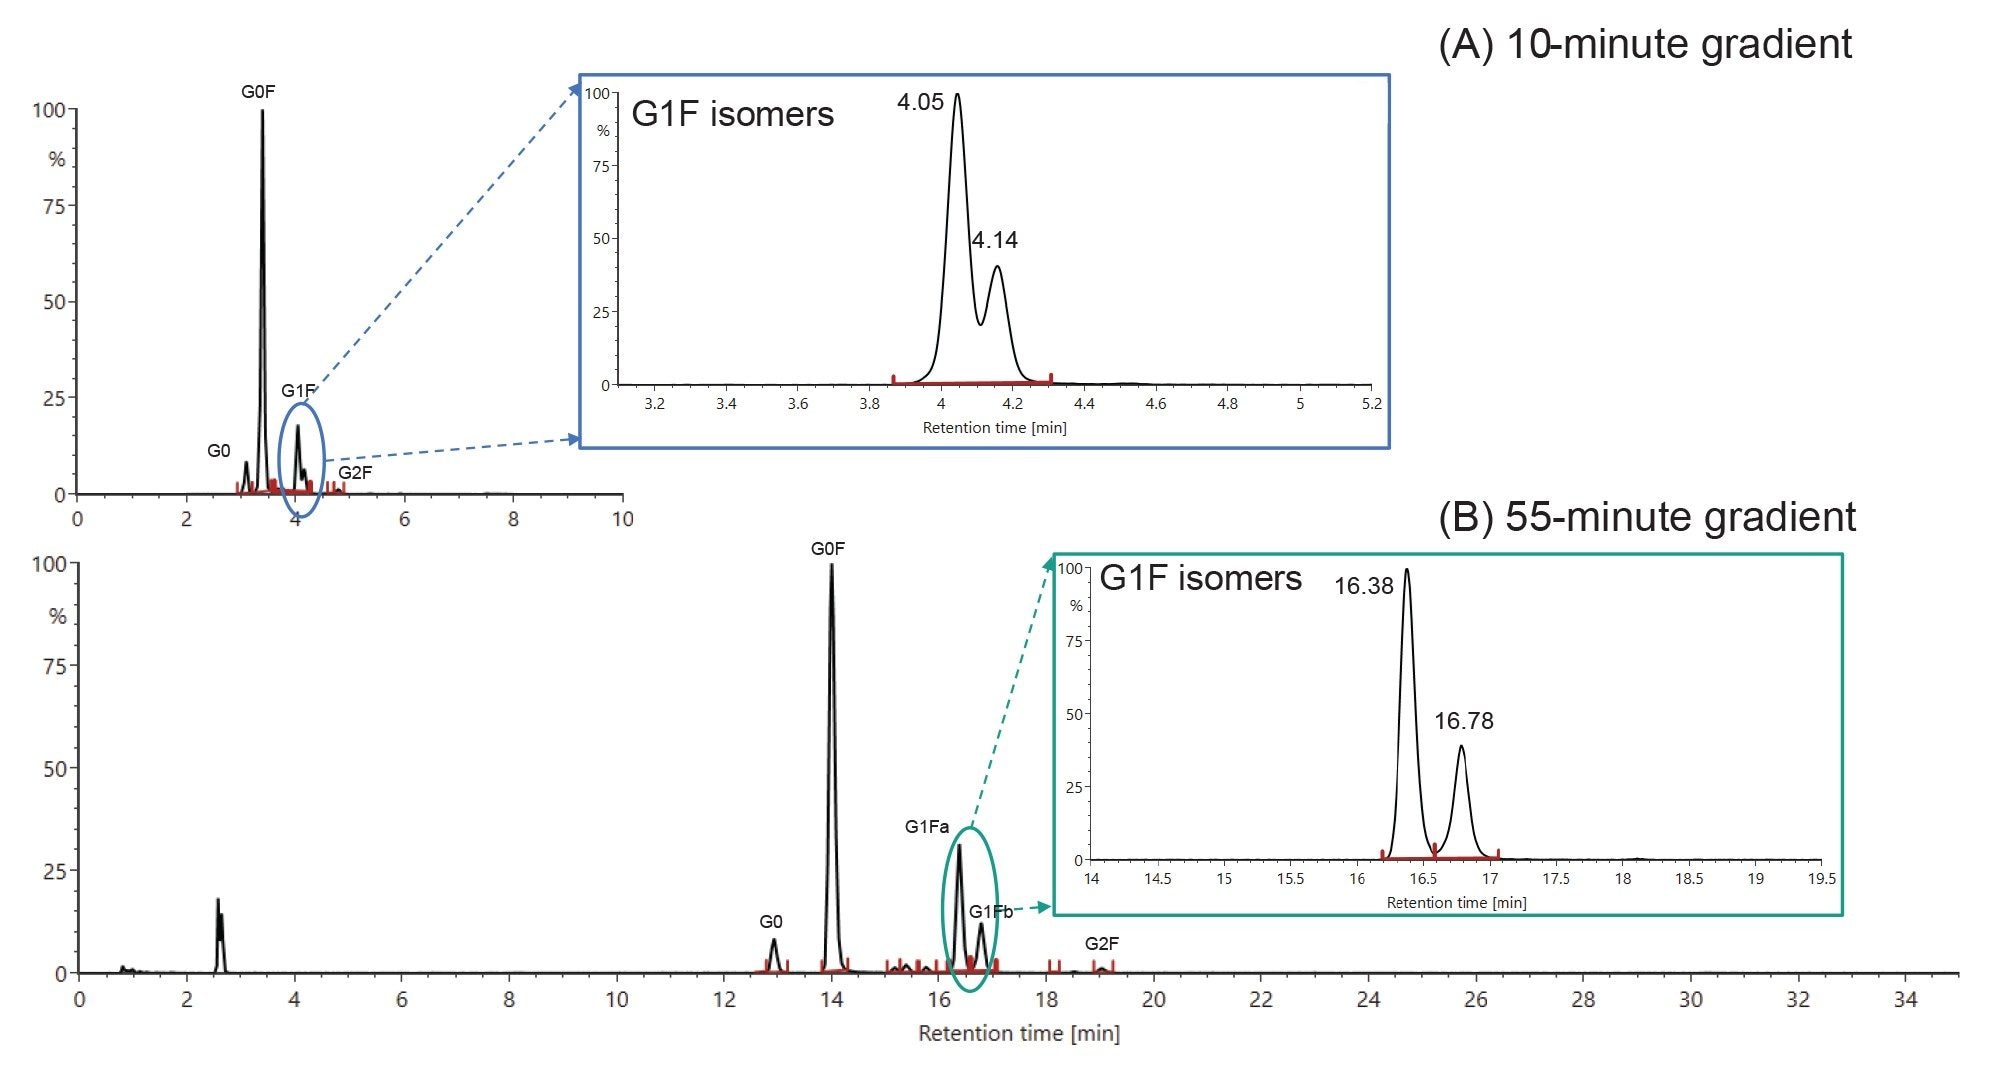
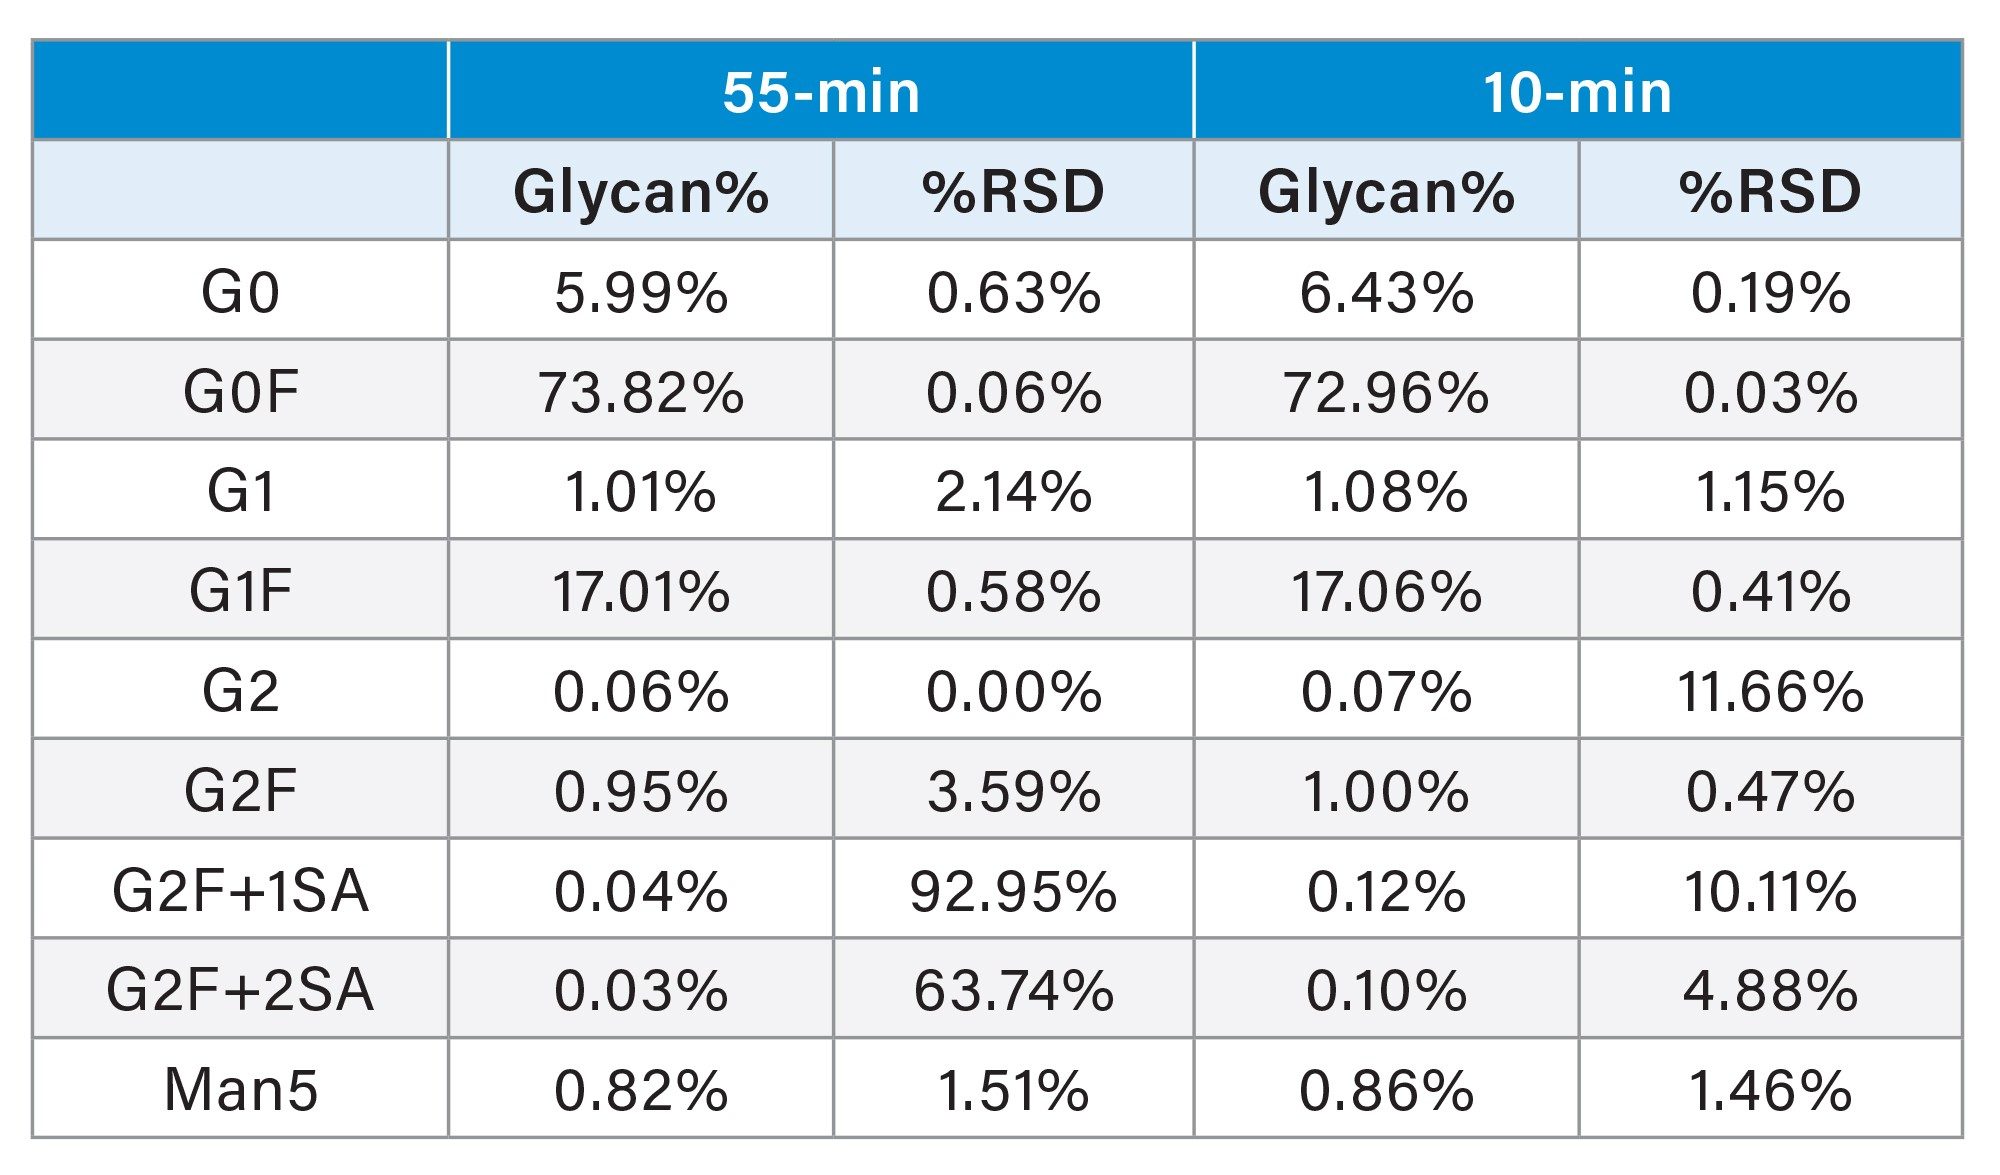
Table 3 summarizes the quantitative glycan results obtained from replicate analyses of the control cell culture sample using each method. As shown in the table, relative abundances of all major glycan species remain highly consistent across the two methods, with differences well within analytical variability. The total G1F content, reported as the sum of the isomeric pair, is preserved despite the reduced isomeric resolution, consistent with standard glycan reporting practices in which G1F isomers are combined for maturity calculations and comparability assessments. Minor species such as G2, G2F+1SA, and G2F+2SA present at or below ~0.1–0.2% exhibit higher relative %RSD values, reflecting proximity to the analytical limit of quantitation rather than method-specific bias.
From a regulatory perspective, U.S. Food and Drug Administration (FDA) expectations for glycosylation analysis emphasize reproducible quantitation of anticipated protein glycoforms; carbohydrate structural characterization is specified as carbohydrate content, rather than isomer level resolution.14 Therefore, the quantitative equivalence observed between the two methods demonstrates that the chromatographic resolution tradeoff stemming from the shortened gradient does not impact reportable glycan results, supporting the 10-minute method as fit-for-purpose for routine glycosylation analysis.
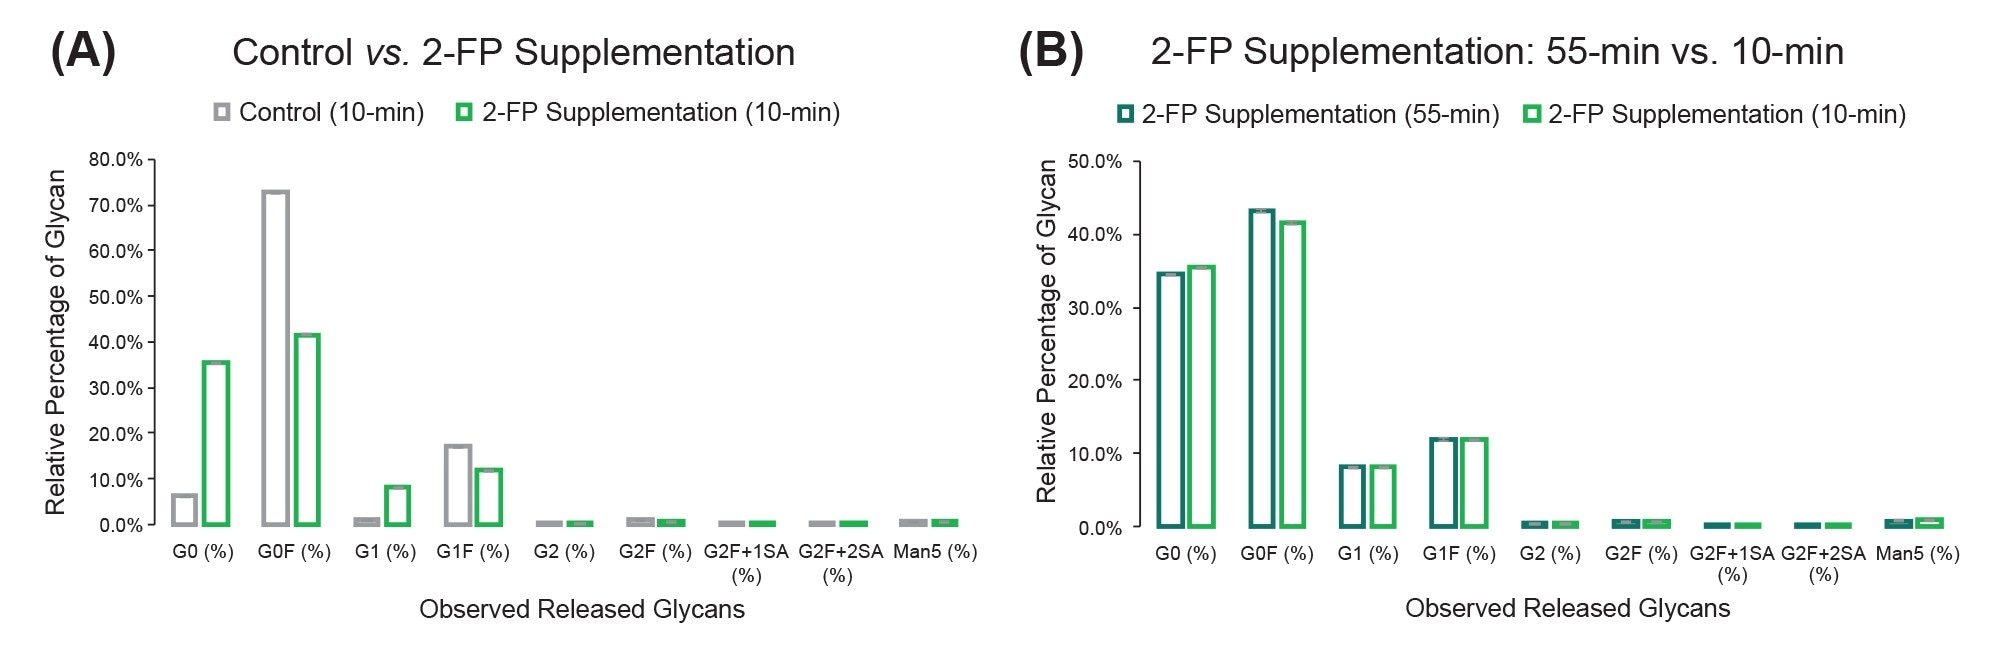
Supplementation with fucose analogs such as 2-FP is commonly used to reduce core fucosylation of Fc N-glycans in CHO cell cultures. In mammalian cells, GDP-fucose, the donor substrate for core fucosylation, is generated predominantly through a de novo biosynthetic pathway from GDP-mannose, with a secondary salvage pathway that converts extracellular fucose to GDP-fucose.15 Fucose analogs such as 2-FP enter the salvage pathway and are metabolized to GDP-2-F-fucose, which perturbs intracellular GDP-fucose pools and competitively inhibits fucosyltransferase 8 (FUT8).15,16 Figure 2 illustrates both the resulting changes in Fc N-glycan composition following 2-FP supplementation and the comparability of the conventional and accelerated analytical methods. As shown in Figure 2A, supplementation with 2-FP results in a pronounced reduction in core-fucosylated glycans (G0F, G1F, and G2F) accompanied by a corresponding increase in their afucosylated counterparts (G0, G1, and G2), consistent with inhibition of FUT8 activity through perturbation of intracellular GDP-fucose pools via the salvage pathway. Figure 2B compares glycan profiles obtained from 2-FP-supplemented samples analyzed using the 55-minute and 10-minute methods and demonstrates excellent agreement between the two approaches across all major N-linked glycan classes. Minor differences observed for low-abundance species fall within analytical variability and do not affect interpretation.
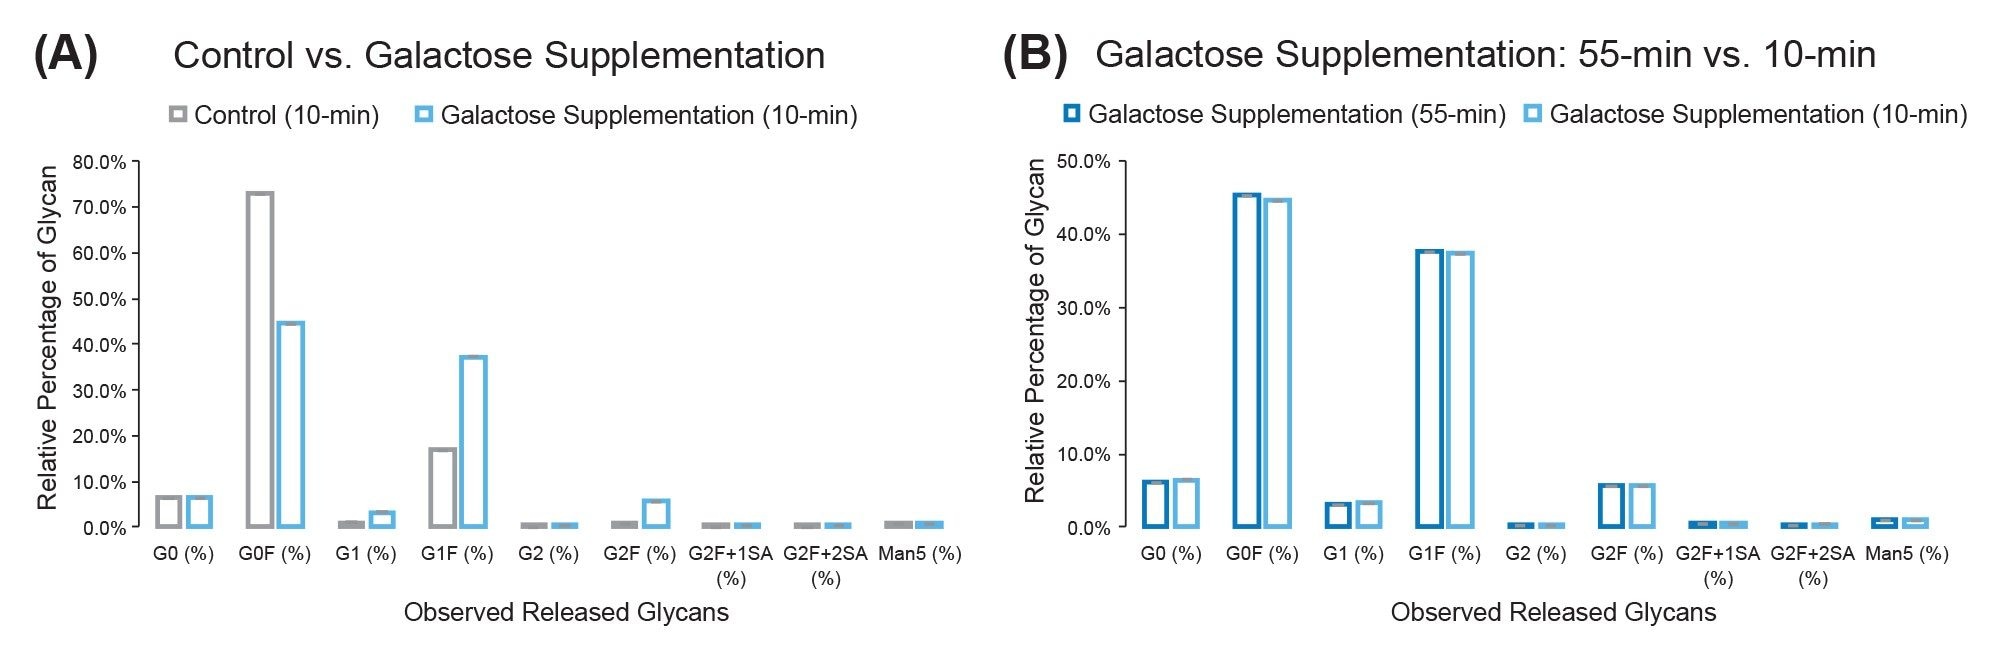
Galactose feeding is widely used as a process lever to increase Fc glycan maturity. In contrast to 2-FP supplementation, which primarily modulates core fucosylation, galactose directly enhances terminal galactosylation by increasing intracellular UDP-galactose availability through the Leloir pathway and related nucleotide-sugar interconversion reactions, thereby acting downstream of core fucosylation at the level of Golgi-localized β-1,4-galactosyltransferases. Multiple studies have demonstrated that galactose feeding during fed-batch or perfusion culture reproducibly shifts glycan distributions from G0/G0F toward G1/G1F and G2/G2F, with the extent of the effect dependent on supplementation strategy and culture phase. 17,18 Figure 3 illustrates the effect of galactose supplementation on released Fc N-glycan profiles and the comparability of the conventional and accelerated analytical methods. As shown in Figure 3A, galactose supplementation results in a clear redistribution of complex-type glycans away from agalactosylated species (G0/G0F) toward increased levels of mono- and di-galactosylated forms (G1/G1F and G2/G2F), consistent with an overall increase in glycan maturity. Figure 3B compares glycan profiles from galactose-supplemented samples analyzed using the 55-minute and 10-minute HILIC methods and demonstrates excellent agreement between the two approaches across all major glycan classes.
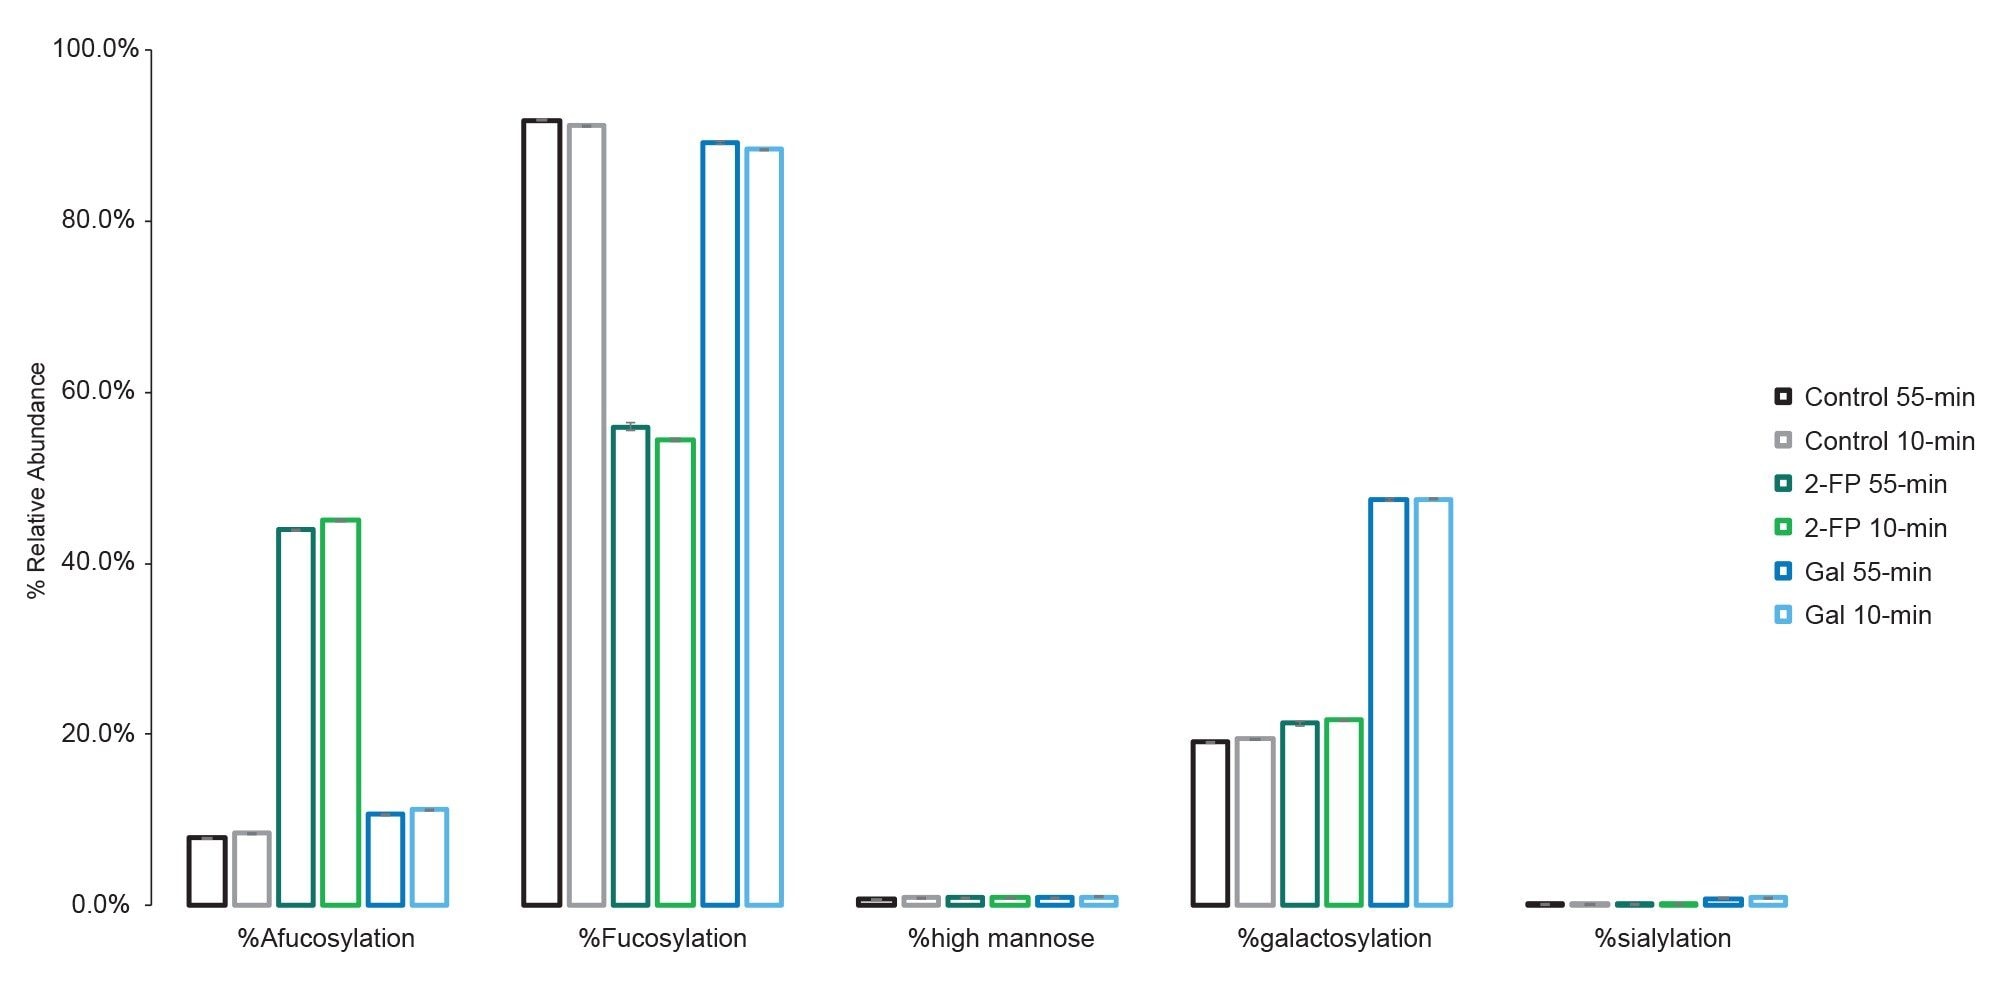
Consistent with the agreement of the individual glycan species’ relative abundances observed between the 10-minute and 55-minute methods demonstrated in Table 3, Figure 2B and Figure 3B, categorical glycan profiling (total %galactosylation and %fucosylation) is likewise consistent between methods in a given supplemental feeding scheme (Figure 4). This summative data confirms that the 10-minute method provides the necessary oversight for risk-based process control.
Overall, these results confirm that the shortened 10-minute method reliably captures biologically meaningful glycosylation changes induced by 2-FP and galactose supplementation while providing quantitative results equivalent to the conventional 55-minute method, thereby supporting its use as a fit-for-purpose, accelerated assay for both routine and high-throughput analysis for rapid, high-confidence monitoring of glycosylation CQA during process development, as well as efficient and reproducible testing for quality control and lot release, consistent with USFDA expectations for risk-based process control.
This study demonstrates that a shortened 10-minute HILIC method provides quantitative Fc N-glycan profiles equivalent to those obtained using a conventional 55-minute gradient while substantially increasing analytical throughput. Although the accelerated method shows reduced resolution for certain isomeric species, most notably G1F positional isomers, this tradeoff does not affect quantitative glycan reporting because routine assessment of glycosylation maturity and comparability relies on summed glycan classes rather than isomer-level resolution. Major and clinically relevant glycan attributes, including core fucosylation, galactosylation state, and high-mannose content, are quantified reproducibly within analytical variability. By focusing on summed glycan classes and clinically relevant attributes, the method aligns with FDA expectations while addressing the industry need for speed.
Application of the method to cell culture samples supplemented with 2-FP and galactose confirms that the accelerated workflow reliably captures mechanistically distinct glycosylation changes, including selective reductions in core fucosylation and shifts in glycan maturity. Quantitative agreement between the 10-minute and 55-minute methods across all major N-linked glycan classes establishes the shortened method as fit-for-purpose for routine glycosylation analysis.
By combining quantitative fidelity with markedly reduced analysis time, the 10-minute HILIC method is well suited to support high-throughput applications in process development and quality control, including clone screening, process optimization, and routine monitoring. This approach provides a foundation for further integration with automated sample preparation and data analysis workflows, enabling more efficient, near real-time monitoring of glycosylation CQAs in modern biomanufacturing environments.
720009298, April 2026