

For research use only. Not for use in diagnostic procedures.
For research use only. Not for use in diagnostic procedures.
Jinchuan Yang, Stephanie Harden, Paul Rainville
Waters Corporation, United States
Published on July 16, 2026
For research use only. Not for use in diagnostic procedures.
Inositol stereoisomers play an important role in metabolic regulation and hormonal signaling and are often taken as dietary supplements for managing conditions such as polycystic ovary syndrome and gestational diabetes. This study evaluates charged aerosol detection as an alternative to mass spectrometry (MS) for the quantitation of ultraviolet (UV) transparent inositol stereoisomers following hydrophilic interaction liquid chromatography (HILIC) separation. Key Waters Charged Aerosol Detector (CAD) parameters, e.g., nebulizer gas pressure, ion trap voltage, and evaporator temperature, were systematically optimized, with best signal-to-noise ratio (S/N) achieved at 40 psi, 600 V, and 95 °C, respectively. A second order polynomial calibration model was employed in quantitation as it provided superior regression compared to a power-law model. The method demonstrated excellent performance in linearity (coefficient of determination, R² ≥ 0.995), sensitivity (limit of quantitation, LOQ, 17–21 mg/L), precision (relative standard deviation, RSD ≤ 3.6% for intra-day and RSD ≤ 4.6% for inter-day), and accuracy (most recoveries 90–110%). This method was successfully applied to commercial supplements, demonstrating Waters CAD as a robust and reliable detector for UV-transparent inositol analysis.
Carbohydrates are among the most challenging classes of compounds for liquid chromatography (LC) due to their pronounced structural similarity and lack of UV or fluorescence chromophores. Many carbohydrates, including inositol, exhibit little to no UV absorbance above 190 nm, which precludes direct detection by conventional UV or fluorescence detectors. As a result, carbohydrate analysis typically relies on differential refractive index detection when using isocratic elution, evaporative light scattering detection, charged aerosol detection, electrochemical detection, or MS.
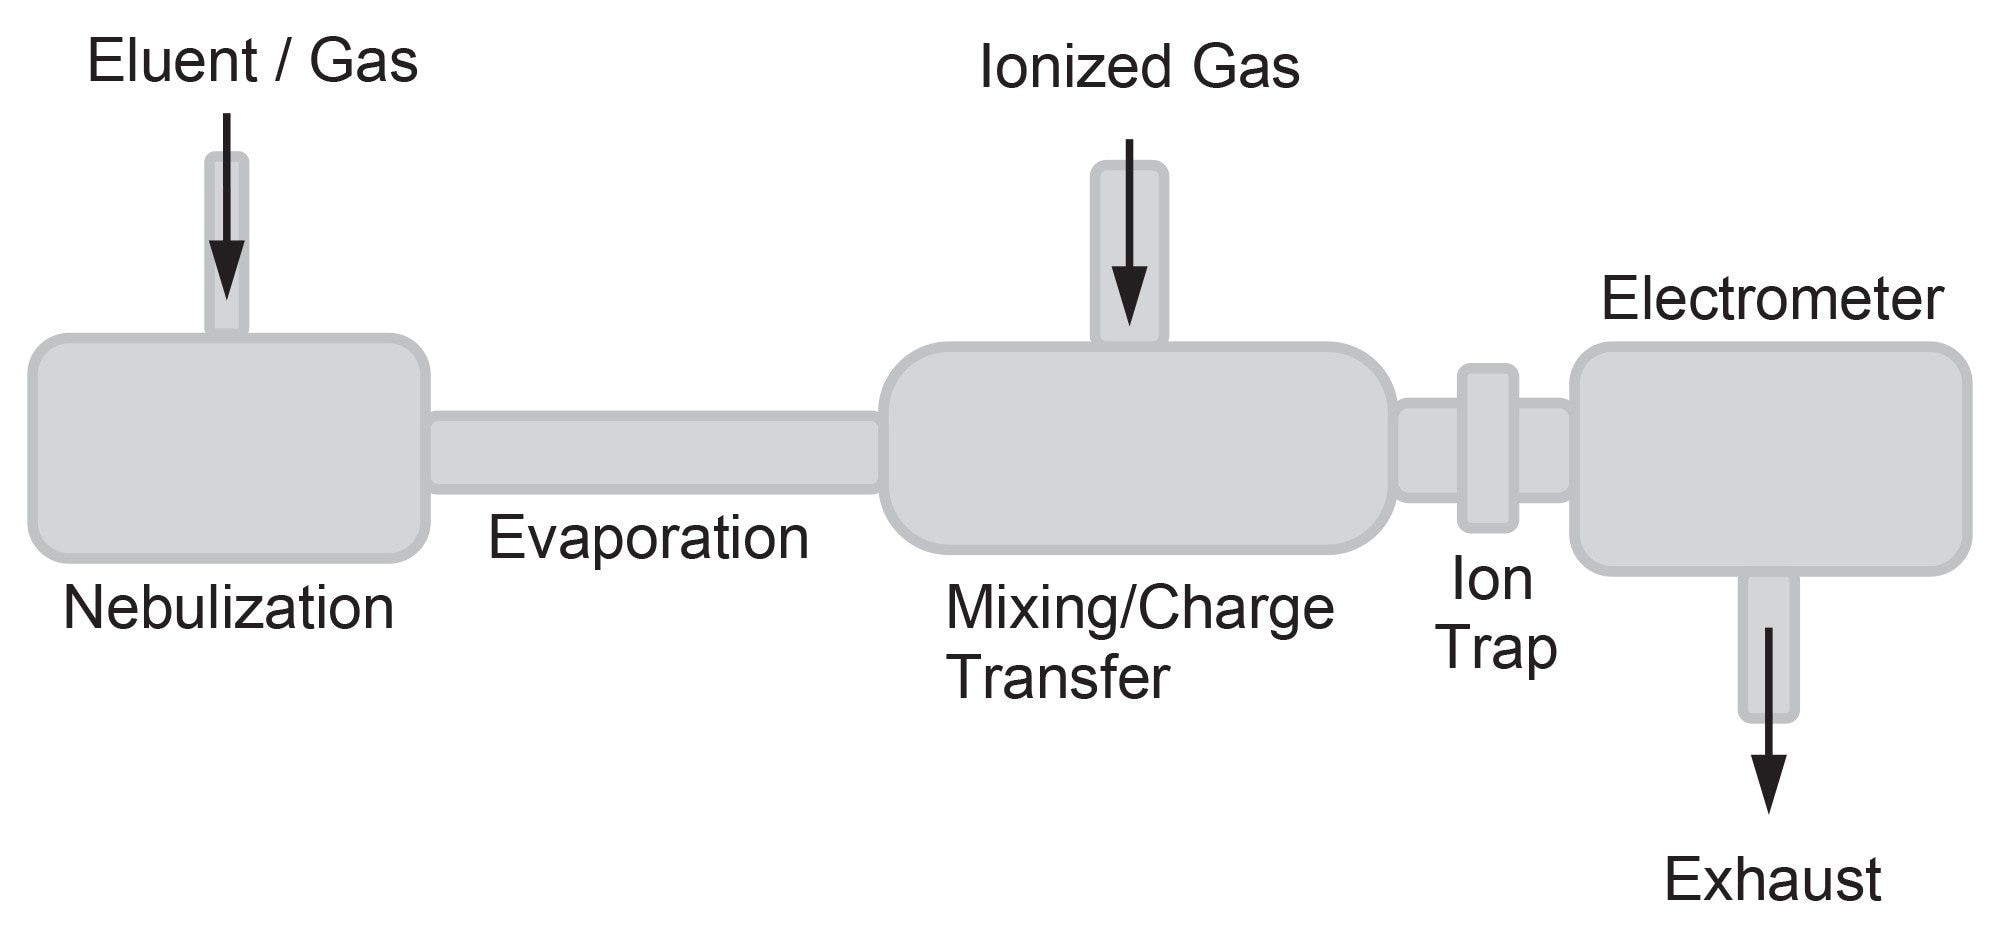
Charged aerosol detection is a mass‑sensitive, near‑universal detection technique that is well suited for weak UV‑absorbing analytes. Figure 1 is a schematic diagram showing how charged aerosol detection works. The eluent is first nebulized to form aerosol droplets, followed by evaporation of the volatile mobile phase (MP). The remaining analyte particles are then charged by ionized gas molecules. Gas-phase ions originating from the background (MP, gases, and additives) are subsequently removed by the ion trap. The electric charge carried by the analyte particles is measured using an electrometer and is proportional to the amount of analyte present. Charged aerosol detection is compatible with gradient elution and any non- or semi-volatile analyte; however, non-volatile MP additives are not suitable for use with charged aerosol detection.
Previously, a HILIC–MS method was developed for the simultaneous determination of inositol stereoisomers in dietary supplements.1 In this study, charged aerosol detection was evaluated as a cost-effective alternative for quantitation. Key operating parameters of a Waters CAD, including nebulizer gas pressure, ion trap voltage, and evaporator temperature, were systematically investigated as well as the MP additives for optimization of S/N. The analytical performance of the resulting HILIC-CAD method is evaluated in terms of linearity, sensitivity, accuracy, and precision using standards and commercially available supplement samples.
Myo-inositol (≥99%), D-chiro-inositol (≥98%), allo-inositol (≥97%), acetonitrile (ACN, LC-MS grade), ammonium hydroxide solution (ACS reagent, 28.0–30.0% NH3 basis), and ammonium bicarbonate (NH4HCO3, ≥99.5%) were purchased from Sigma-Aldrich (Milwaukee, WI). Epi-inositol (≥98%), muco-inositol (≥95%), and neo-inositol (≥95%) were purchased from Biosynth International, Inc. (Gardner, MA). Scyllo-inositol was purchased from Cayman Chemical Company Inc. (Ann Arbor, MI). Water (ultrapure, 18.2 MΩ•cm) was generated from a Mili-Q™ Purification System (IQ7005, MilliporeSigma, Burlington, MA) in the lab.
Individual standard stock solutions of five inositol stereoisomers (allo-, epi-, D-chiro-, myo- and scyllo-inositol) were prepared in water at concentrations of 10 g/L. The standard mix stock solution was prepared by mixing appropriate volumes of the individual standard stock solutions and water to obtain a concentration of 1500 mg/L for each standard. The standard working solutions were prepared by serial dilution of the standard mix stock solution with water to concentrations ranging from 15–600 mg/L. A standard mix solution of the seven inositol stereoisomers (allo-, muco-, epi-, D-chiro-, neo-, myo- and scyllo-inositol) was prepared in a similar manner and used in a qualitative study as part of this work. All concentrations were recorded to three significant figures.
Dietary supplements from various brands were purchased via online stores. All supplements came in the form of capsules filled with powder contents. The powder contents were weighed and initially dissolved in water to prepare sample stock solutions at a concentration of 3–4 g/L. Heating at 50 °C for up to 30 minutes was applied when necessary. These sample stock solutions were filtered through a 0.45 µm PVDF syringe membrane filter (p/n: WAT200827, Waters) before being further processed and analyzed. For myo-inositol, which was present at a higher content level (typically labeled at 2000 mg/serving), further dilution of sample solutions (for example, 50 µL filtered sample solution mixed with 950 µL water) was carried out to bring the response within the calibration range.
Inositol stereoisomers were spiked at two levels (low and high) and analyzed in the same way as the samples. The low spike level was the same as the D-chiro-inositol-labeled level, and the high spike level was the same as the myo-inositol-labeled level. Spike recovery was assessed by subtracting the native inositol concentration from the total inositol measured and comparing that against the amount of inositol that was spiked. Recovery was expressed as a percentage.
|
System: |
Arc™ Premier System equipped with a Quaternary Solvent Manager (QSM-R), a Sample Manager (FTN-R), a Column Manager-Active (CM-A), and coupled with a Waters CAD |
|
Software: |
Empower Chromatography Data System (CDS) |
|
Column: |
ACQUITY™ UPLC™ BEH™ Amide Column (1.7 µm, 2.1 mm × 150 mm, p/n: 186004802, Waters) |
|
Column temperature: |
25 °C |
|
Run time: |
23 minutes |
|
Mobile phase A: |
ACN:water (90:10 v/v) with 0.01% NH4OH |
|
Mobile phase B: |
ACN:water (50:50 v/v) with 0.01% NH4OH |
|
Sample manager purge: |
ACN:water (50:50, v/v) |
|
Flow rate: |
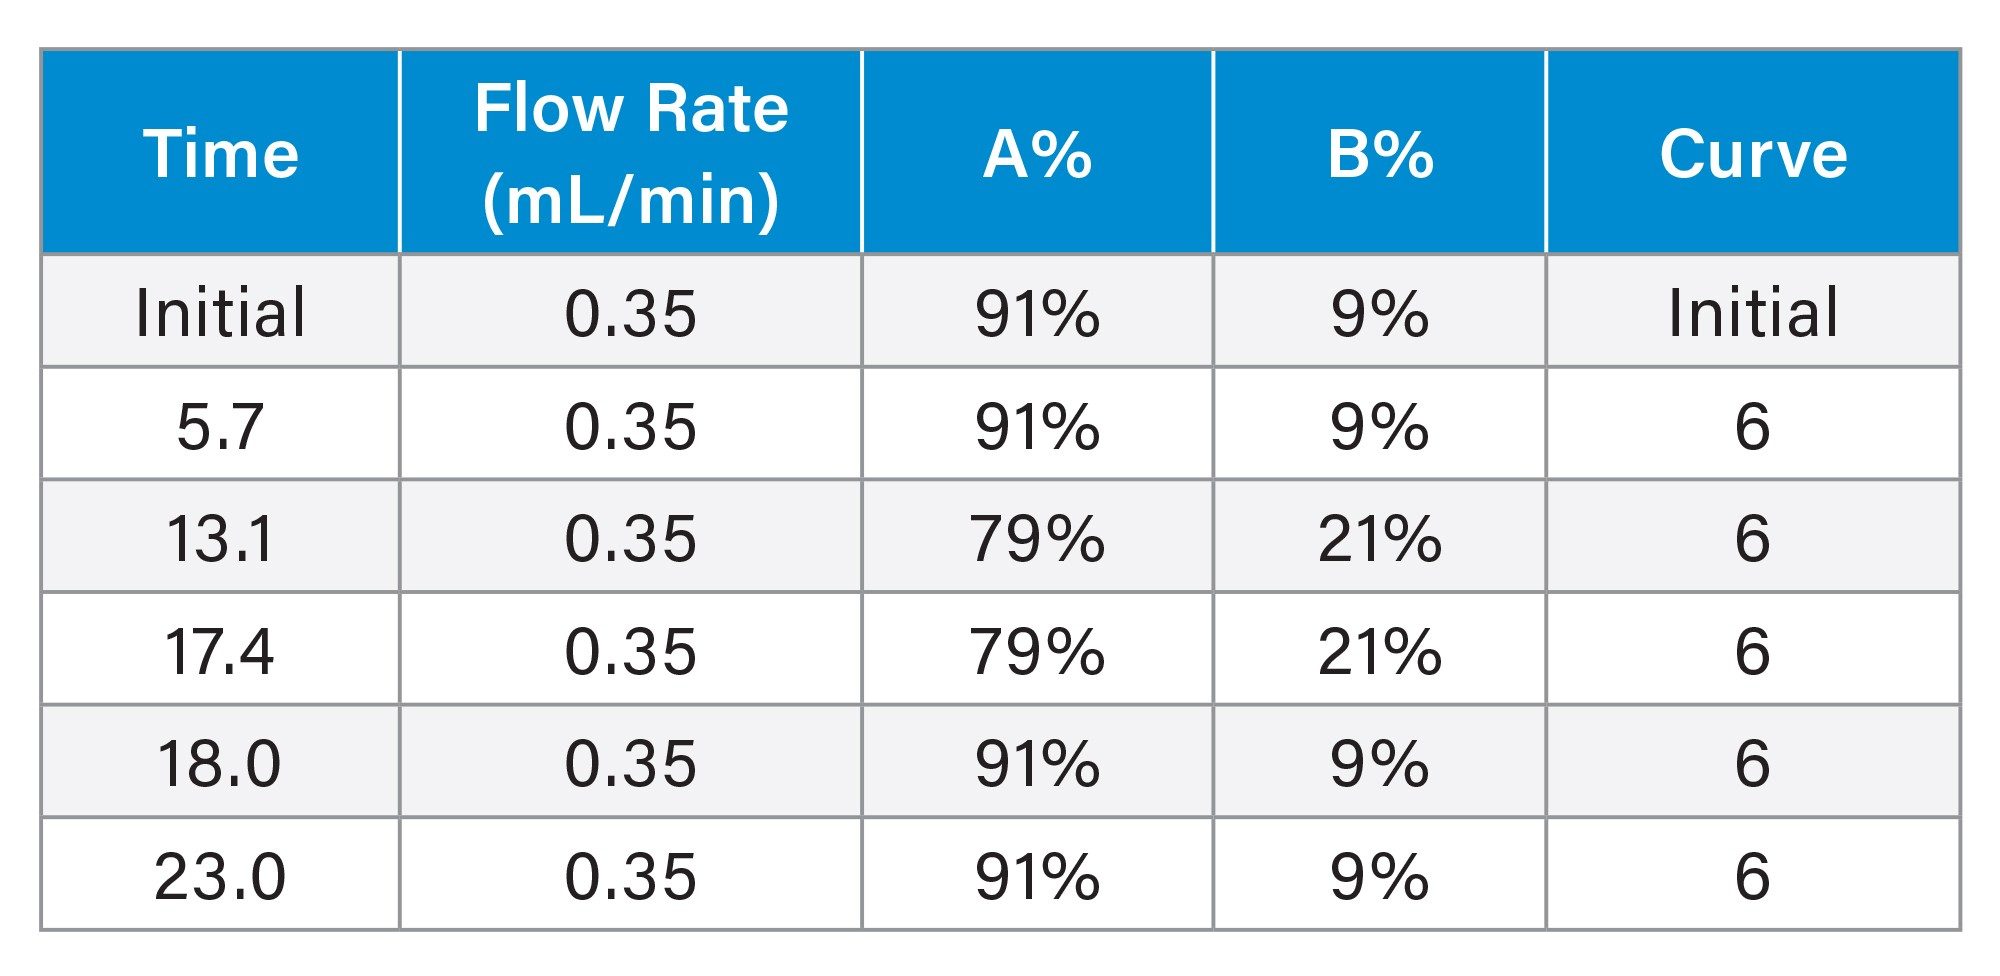
0.35 mL/min |
|
Injection volume: |
2 µL |
|
Gas pressure: |
40 psi (Adjustable in the ACQUITY System Console Software Window) |
|
Power function value: |
1.00 |
|
Ion trap voltage: |
600 V (in Advanced Settings) |
|
Evaporator temperature: |
95 °C |
|
Sample rate: |
10 pts/sec |
|
Filter time constant: |
Normal (0.2 sec) |
|
Divert valve setting: |
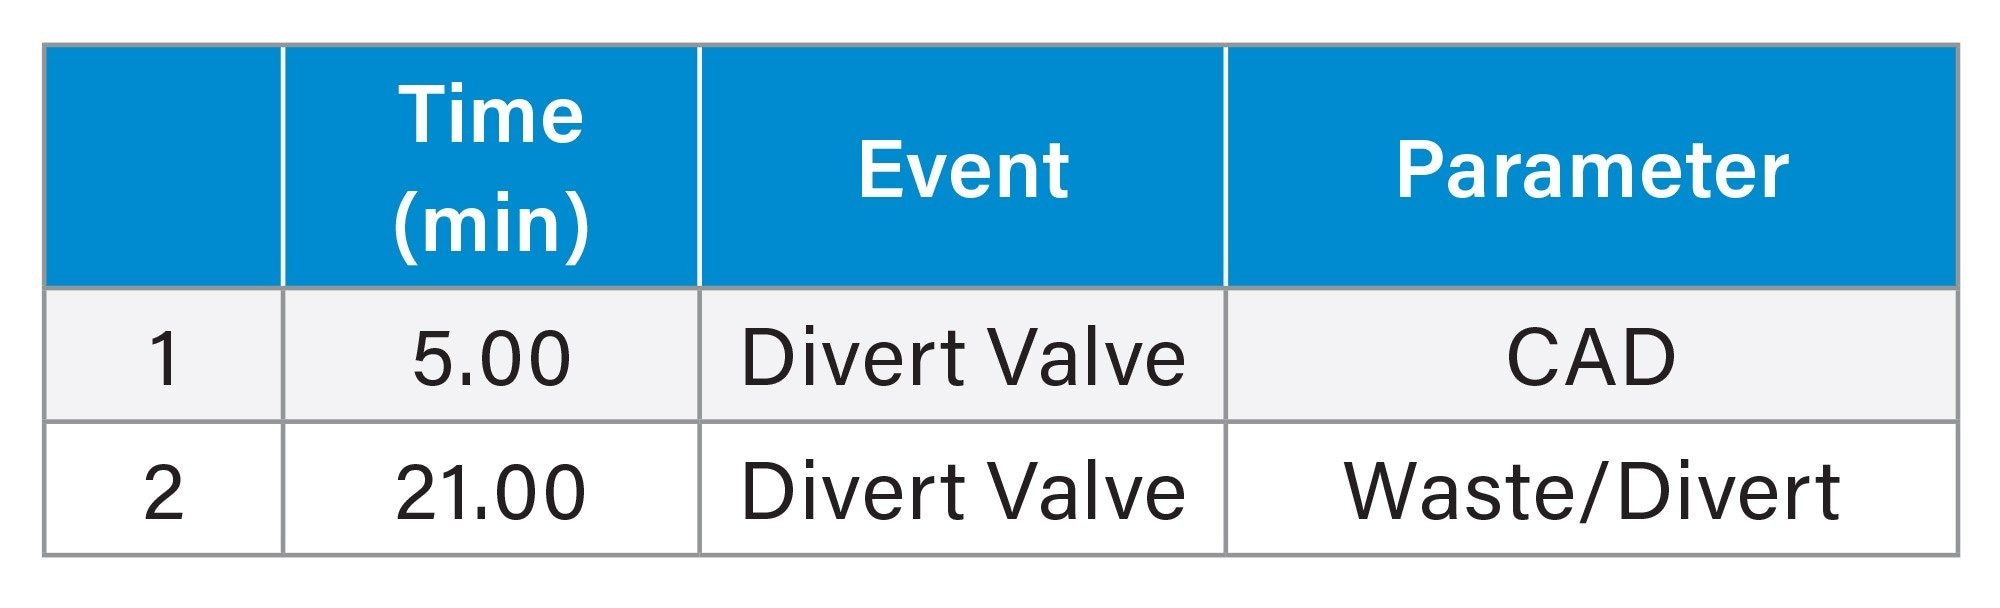
Waste/Divert |
The chromatographic separation of inositol stereoisomers on the BEH Amide Column was established in previous studies, where separation performance, including resolution, robustness and specificity, was evaluated.1,2 The primary focus of the present method development was the optimization of chromatographic and instrument conditions for charged aerosol detection.
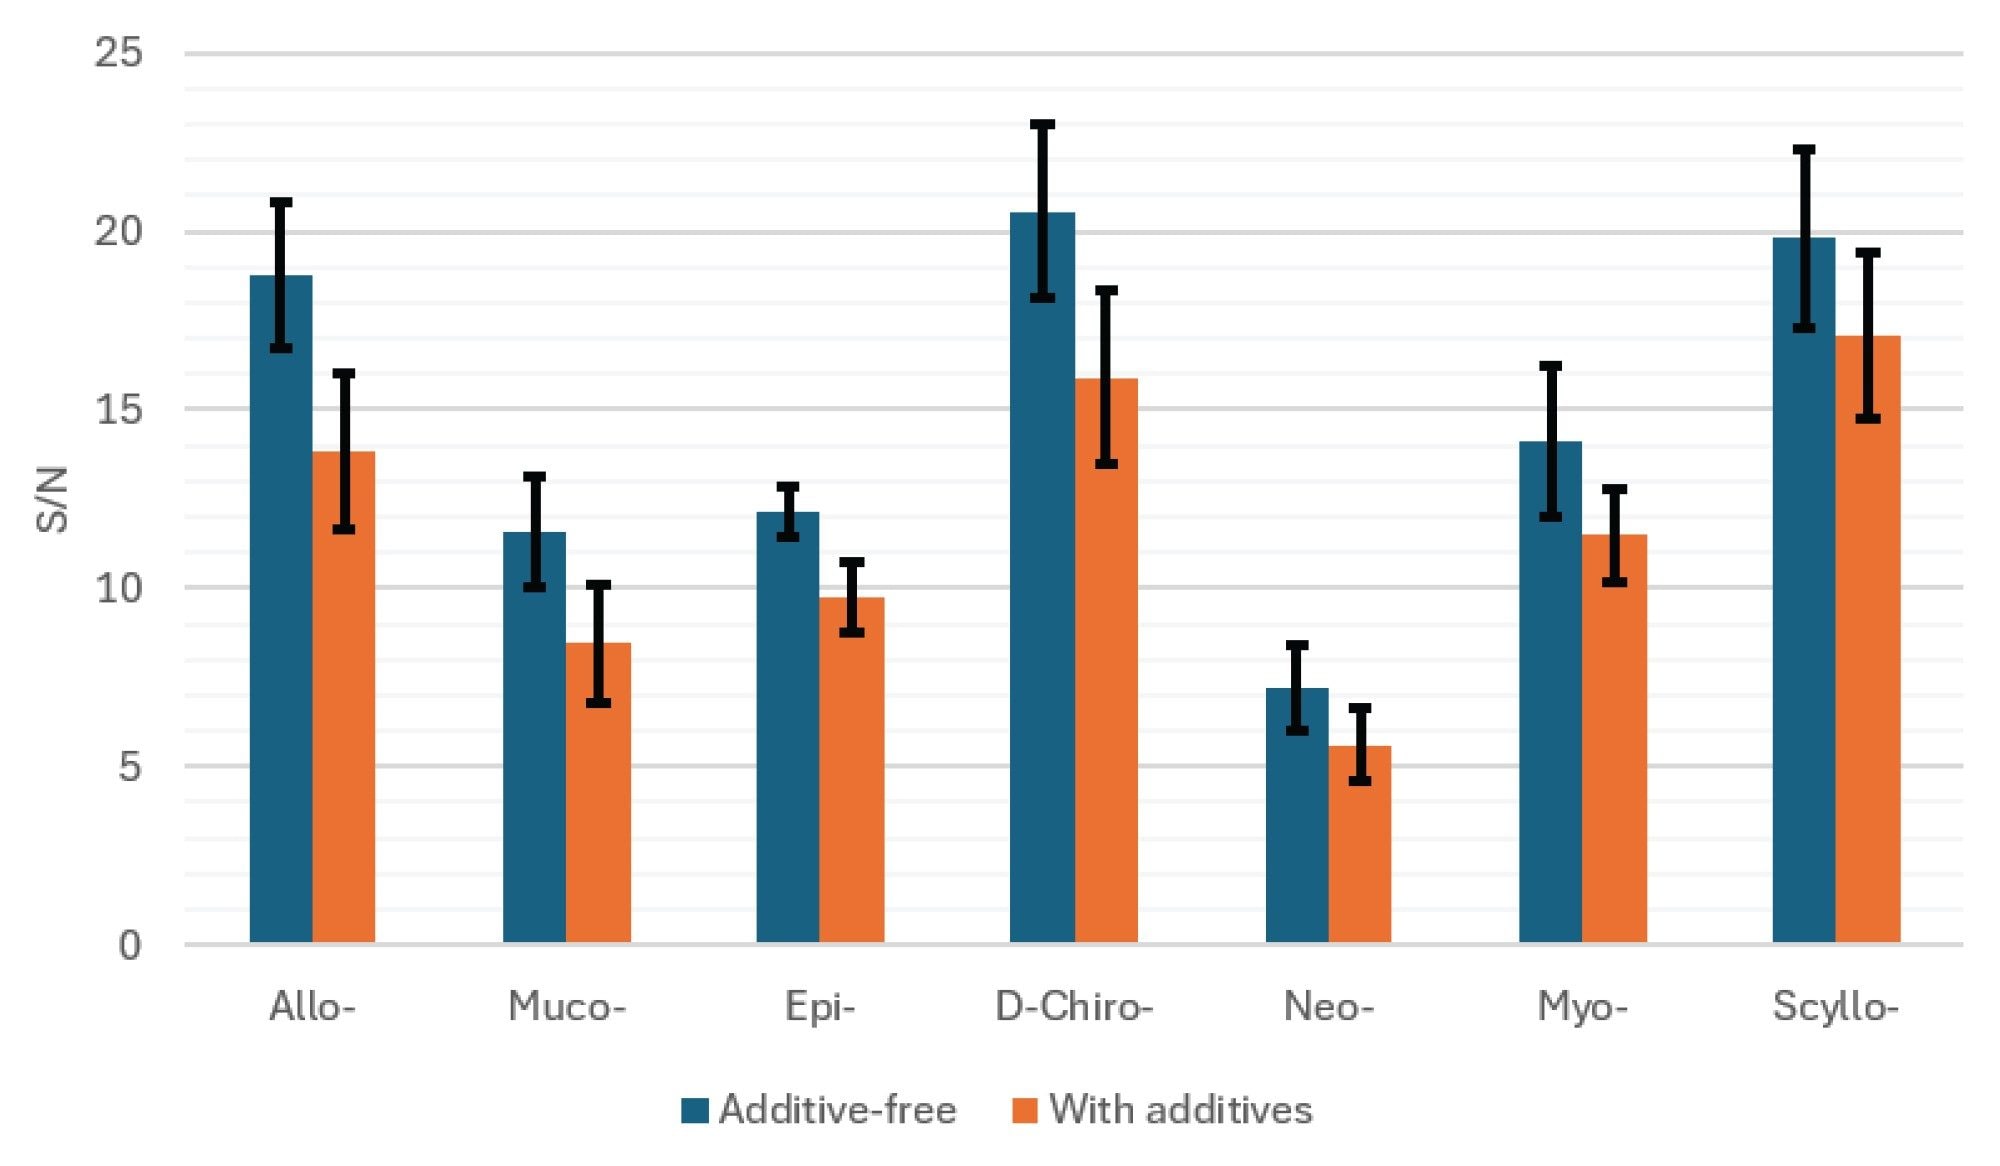
In previous work, MP additives, i.e., ammonium hydroxide and ammonium bicarbonate, were employed to enhance sensitivity and precision in MS. In this study, their effects on the S/N of inositol peaks were systematically evaluated. Figure 2 compares the S/N values of seven inositol stereoisomers obtained using MP B with and without additives (i.e., 20 mM ammonium bicarbonate and 0.01% ammonium hydroxide), while all other conditions were held constant (evaporator temperature 70 °C, ion trap voltage 20 V, gas pressure 55 psi). The results indicated that the inclusion of these additives resulted in lower S/N compared to the additive-free MP B. Additional investigations revealed that ammonium hydroxide is required to maintain consistent retention times (data not shown). Therefore, ammonium bicarbonate was excluded from the final MP B composition.
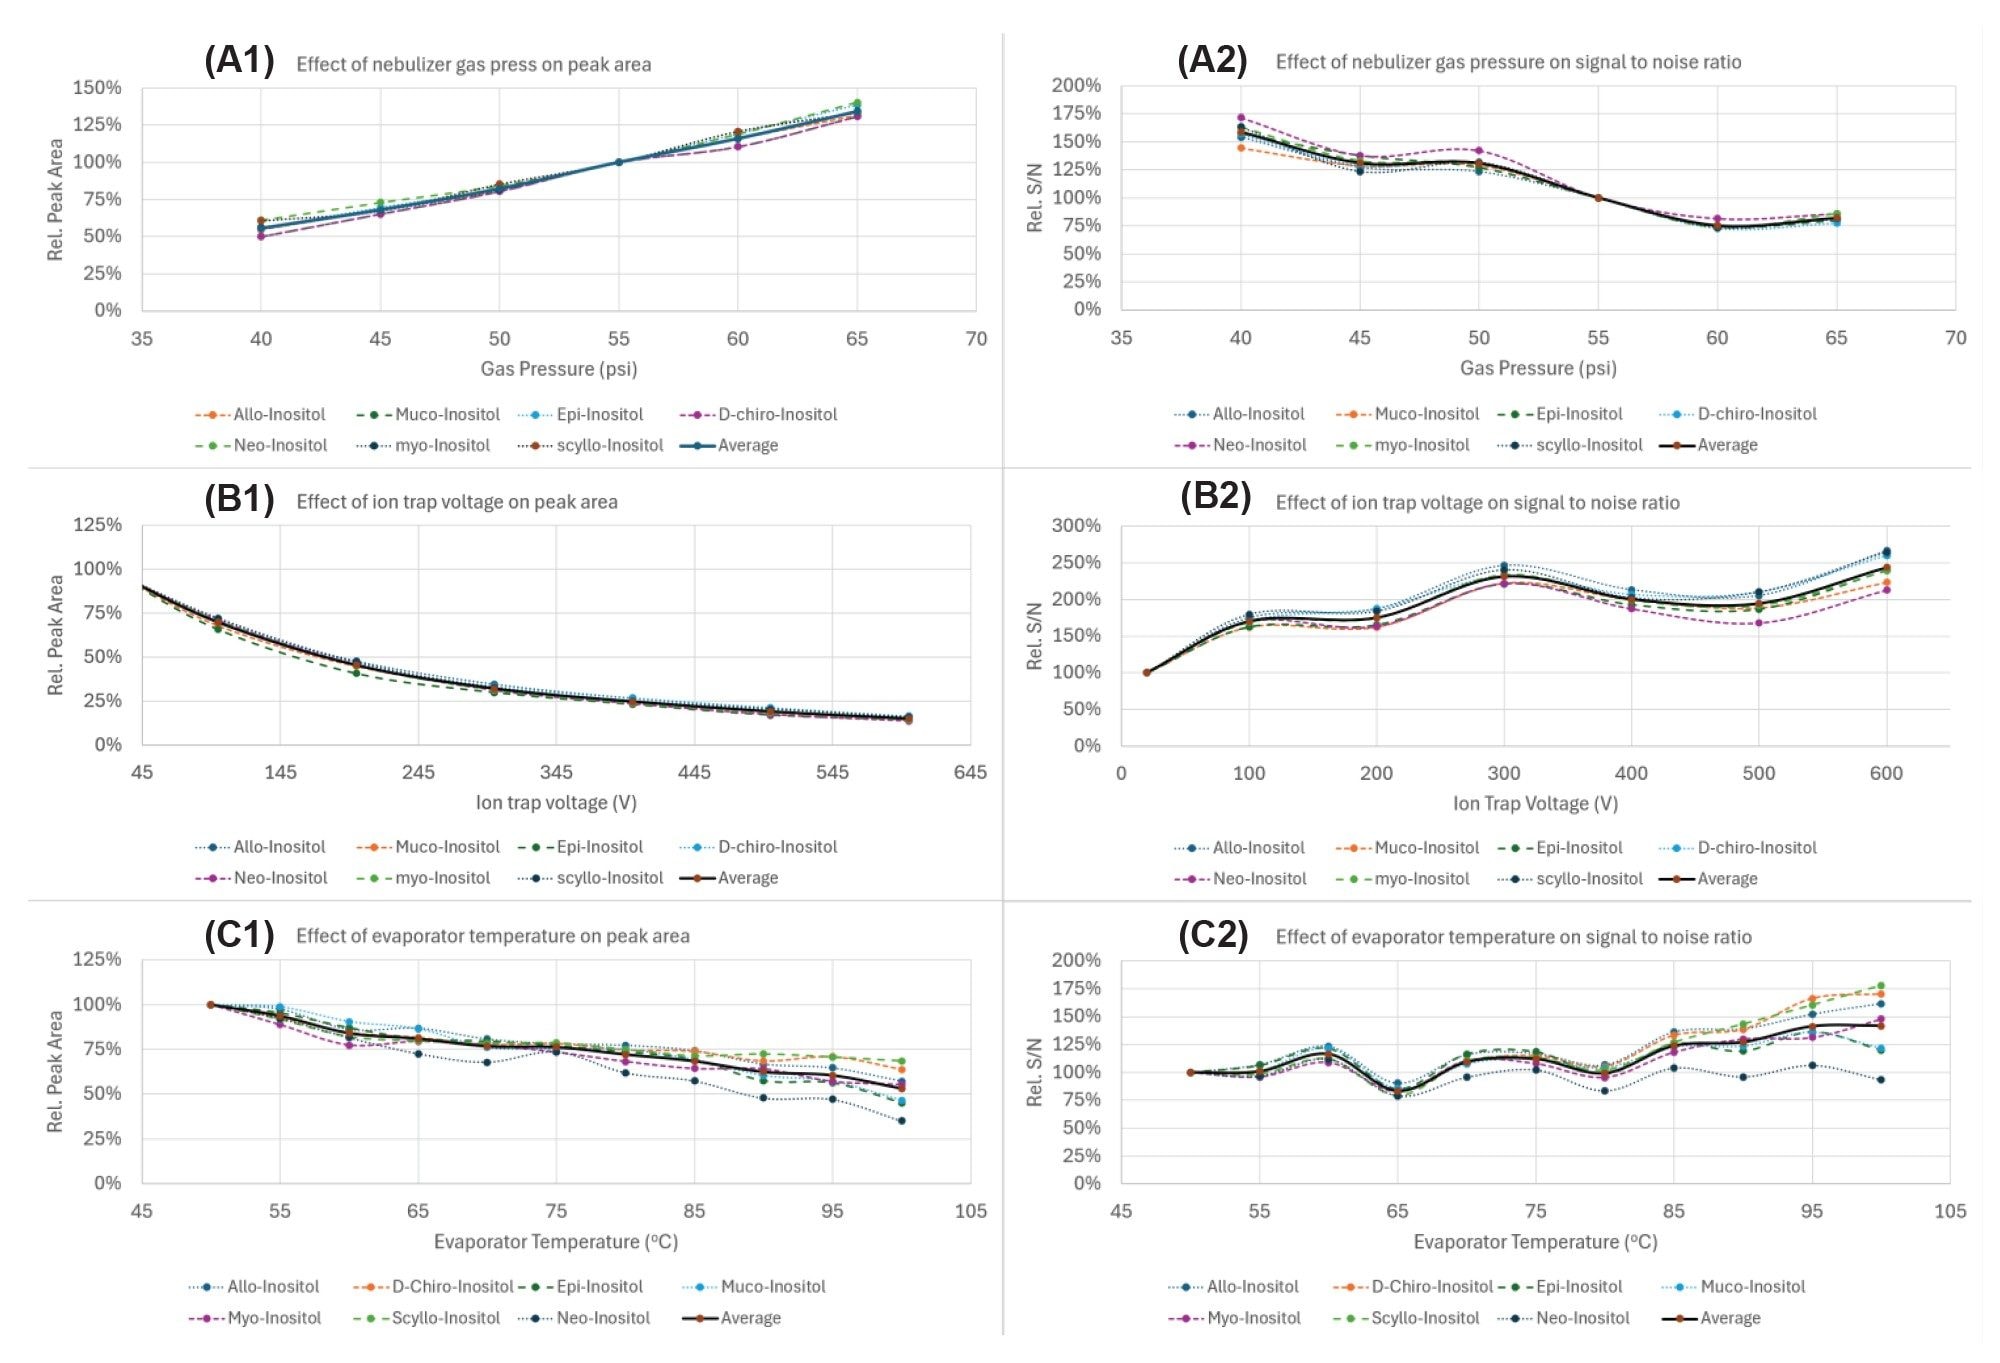
The effects of key CAD instrument parameters, such as nebulizer gas pressure, ion trap voltage, and evaporator temperature, were systematically evaluated. Figure 3 shows plots of their effects on both the response (peak area) and the S/N of charged aerosol detection. Specifically, Figure 3 A1, B1, and C1 show the variation in CAD peak area with nebulizer gas pressure, ion trap voltage, and evaporator temperature, respectively, while Figure 3 A2, B2, and C2 show the corresponding trends in S/N. For simplicity and clarity, all peak area and S/N values were normalized to those obtained under common conditions (nebulizer gas pressure 55 psi, ion trap voltage 20 V, and evaporator temperature 50 °C).
Overall, peak areas decreased at lower gas pressure, higher ion trap voltage, and higher evaporator temperature, whereas S/N generally improved under these conditions. The relative S/N at the highest vs. lowest within the investigated ranges were approximately 150% vs. 75% for nebulizer gas pressure, 250% vs. 100% for ion trap voltage, and 150% vs. 80% for evaporator temperature (average values). Among these parameters, ion trap voltage had the greatest effect, yielding an approximate 1.5-fold increase in S/N when increased from 20 V to 600 V. The user-adjustable ion trap voltage provided significantly enhanced optimization for CAD S/N, which in turn improved method sensitivity. Nebulizer gas pressure had the second largest effect on S/N, yielding a 1.0 fold increase in S/N when increased from 65 psi to 40 psi. The impact of evaporator temperature was more analyte-dependent, however, on average, 95 °C provided the optimal S/N.
In practice, the nebulizer gas pressure was preset at a factory setting. It is not accessible in the Empower Software Instrument Method Editor, however, it can be adjusted via the Empower Software CAD Interactive Display page within the ACQUITY System Console Software Window for optimization. The ion trap voltage can be configured in the advanced settings of the Empower Software Instrument Method Editor.
CAD response is inherently nonlinear with respect to analyte concentration. The relationship between CAD response (e.g., peak area) and analyte concentration is often described by a power-law function.3 However, in practice, deviations from ideal behavior may occur, and the power-law function may not always provide the preferred fit for CAD calibration.4
To determine a more suitable calibration model for this study, two regressing models were compared using least squares fitting, a power-law equation and a second order polynomial equation. As shown in Figure 4, the second order polynomial provided an improved fit to the calibration data. It yielded improved fitting for myo-inositol, with a higher R2 (0.99998 vs 0.99880; Figure 4A) and lower relative errors (Figure 4B). The same comparison was also performed for the D-chiro-inositol and the same results were obtained (data not shown). These results indicated that the second order polynomial equation more accurately represented the CAD response across the examined concentration range. Based on these findings, the second order polynomial model was selected for the quantitative analysis of myo- and D-chiro-inositol.
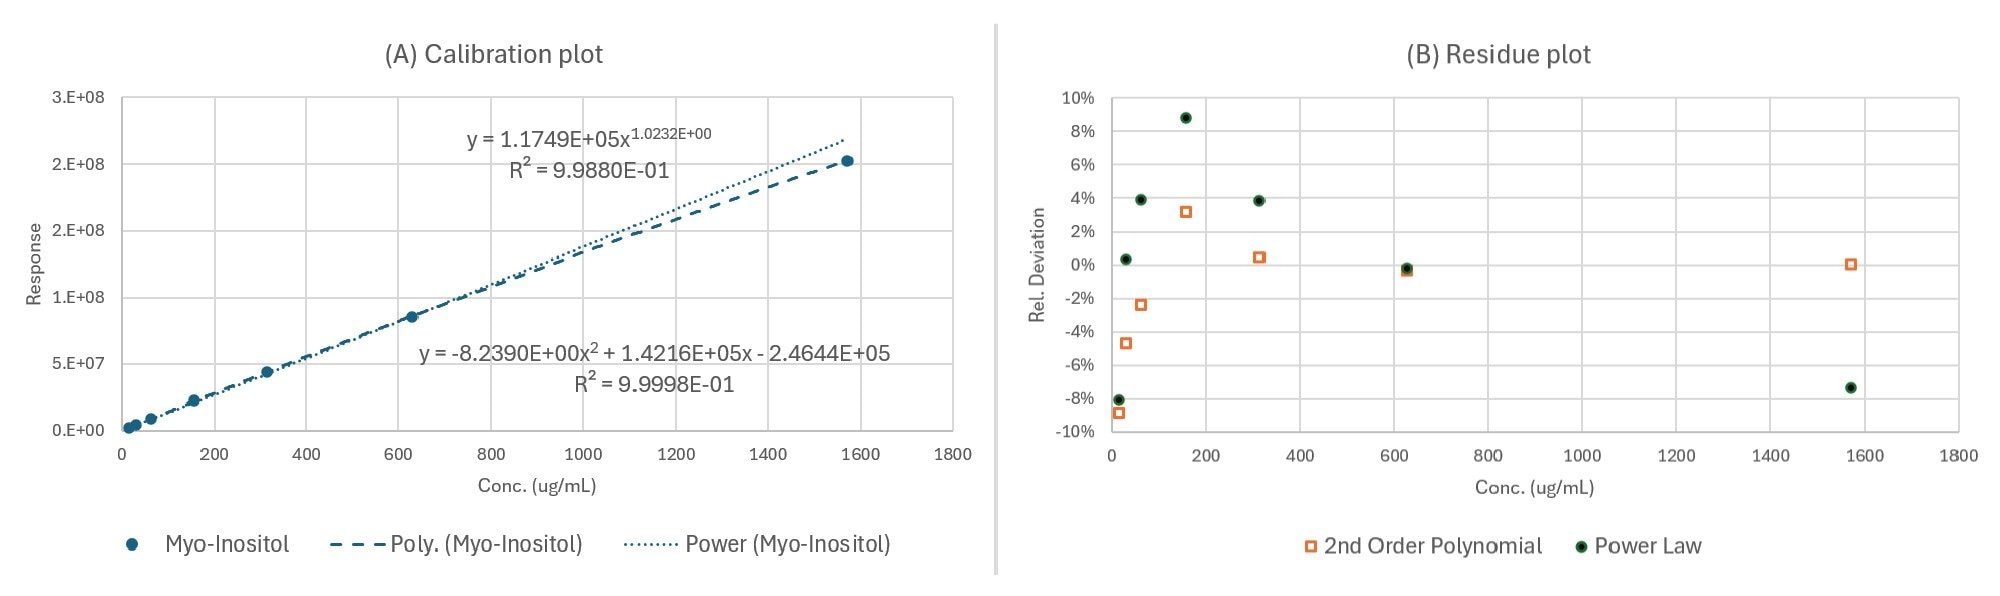
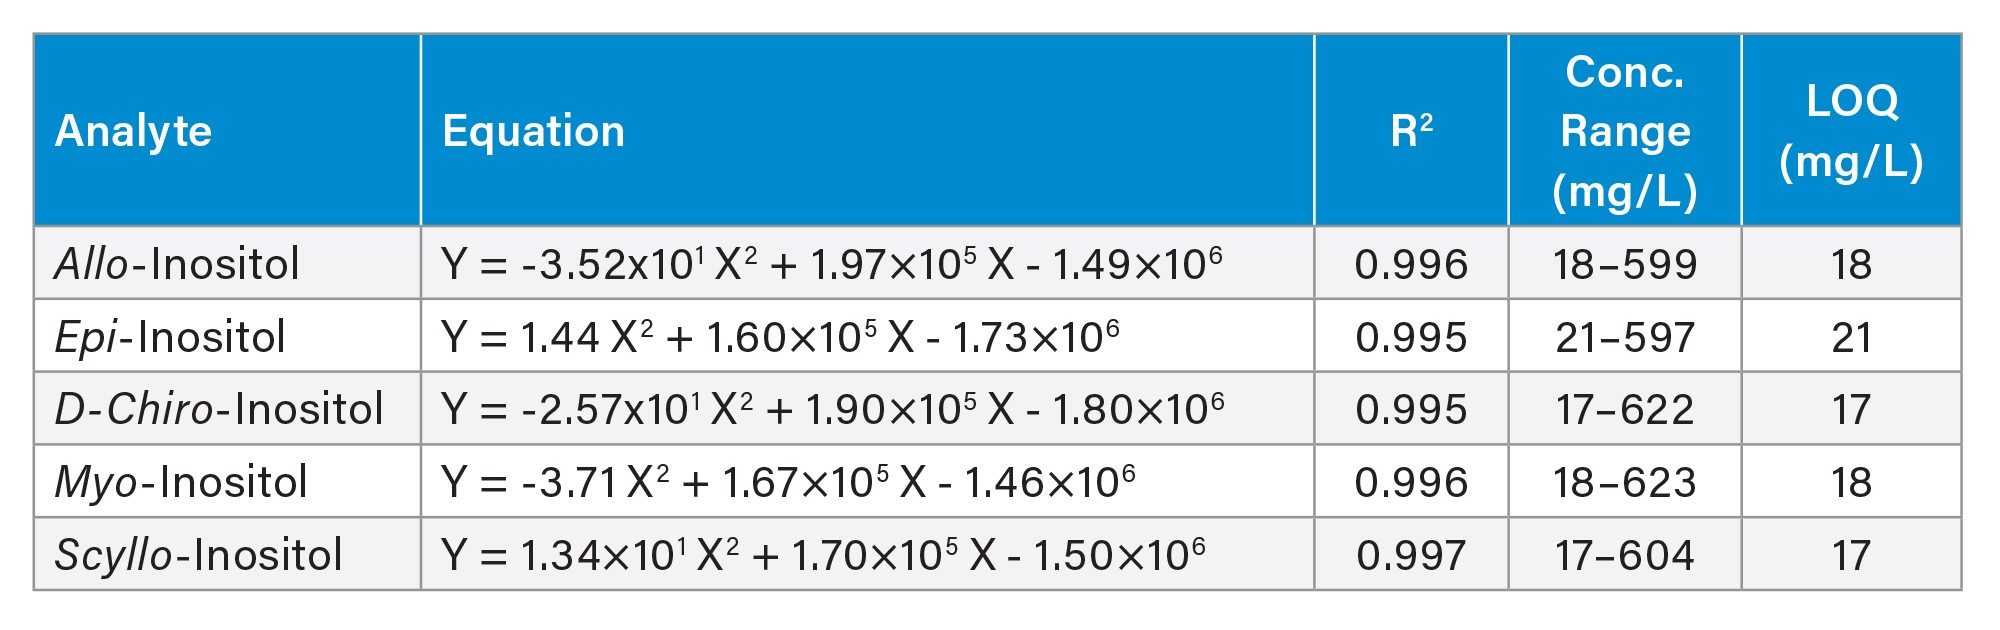
Table 1 shows typical calibration characteristics for allo-, epi-, D-chiro-, myo-, and scyllo-inositol, along with their estimated LOQs. For all analytes, calibration curves exhibited R² of 0.995 or greater. The LOQs were estimated based on the S/N obtained at low concentration levels near the expected LOQs. Specifically, the concentrations corresponding to an S/N of 10 were determined by interpolation and defined as the LOQs. The calibration ranges extended from the LOQs up to approximately 600 mg/L. At concentrations exceeding the upper limits of these ranges, peak distortion indicative of column overloading (e.g., skewed peak shapes) was observed.
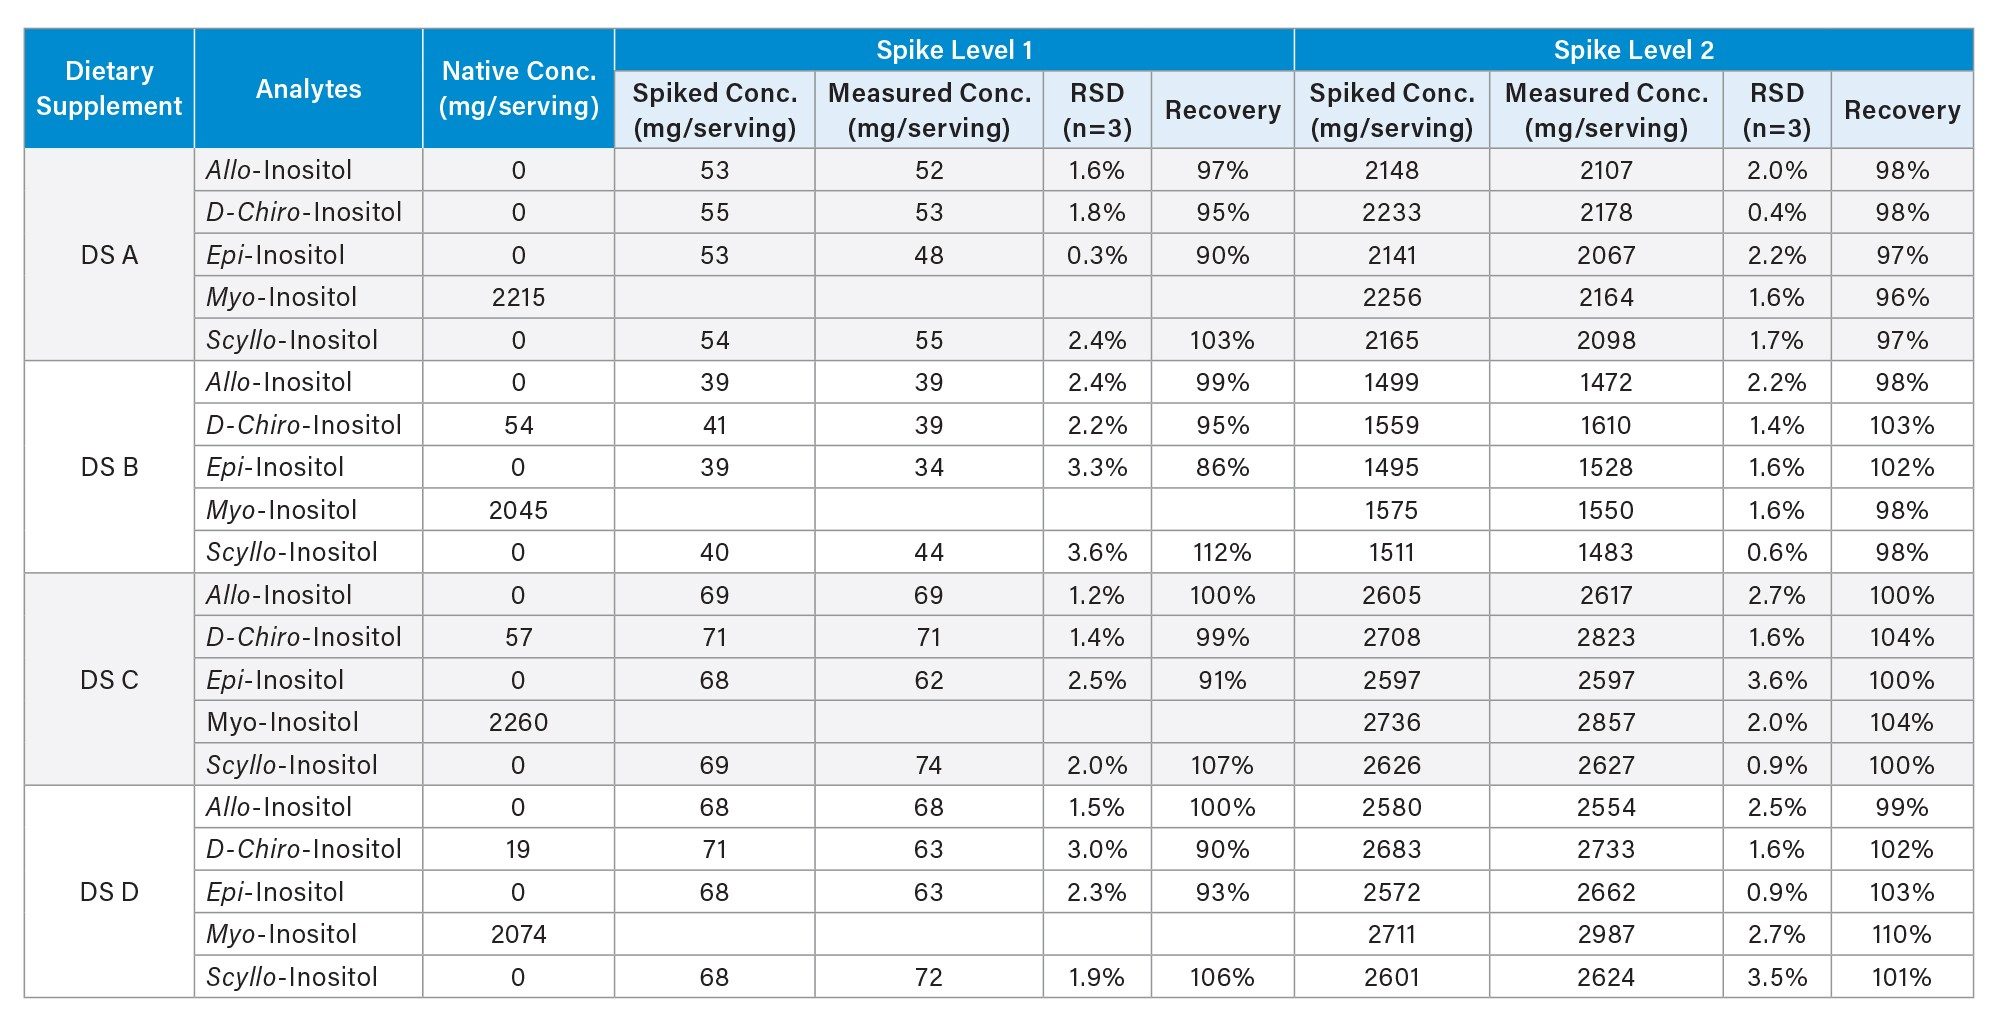
The accuracy and precision of the method were evaluated through spiking experiments. Table 2 presents the detailed results obtained from four dietary supplements at two spike levels. At spike level 1, recoveries ranged from 86% to 112%, whereas at spike level 2, recoveries ranged from 96% to 110%. The majority of results (34 out of 36) fell within the 90–110% acceptance range commonly required for quality control applications.
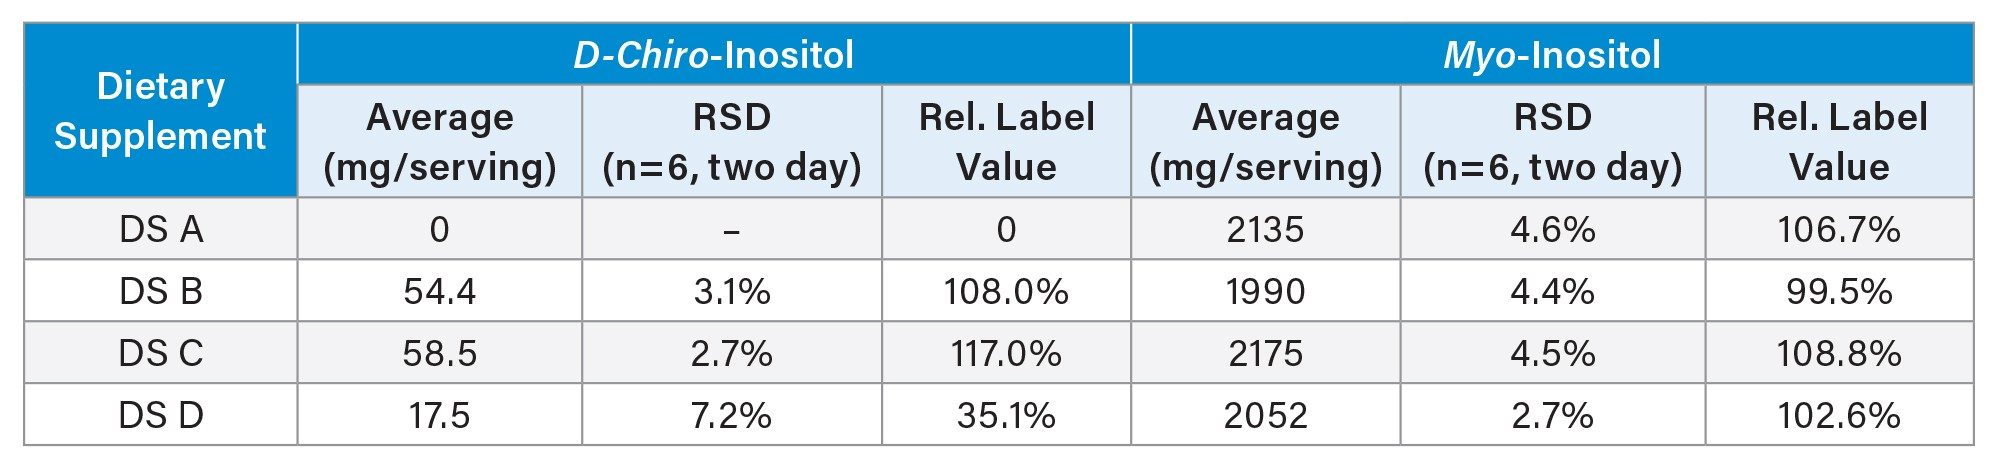
Repeatability, expressed as RSD from triplicate measurements conducted on the same day (n=3), was below 3.6% for all analytes at both spike levels. Intermediate precision was also assessed through sample measurements (see Table 3). RSDs obtained over two days (n=6) in sample analysis ranged from 2.7% to 4.6% for both myo-inositol and D-chiro-inositol, except for D-chiro-inositol in sample DS D, where the RSD was 7.2%. This relatively high RSD was likely due to the low D-chiro-inositol in sample, which was measured at the LOQ. These results are comparable to precision values reported in the literature for similar compounds by charged aerosol detection.5 Considering that charged aerosol detection involves gas nebulization, which typically introduces greater variability than UV or fluorescence detection, these results demonstrated excellent method precision.
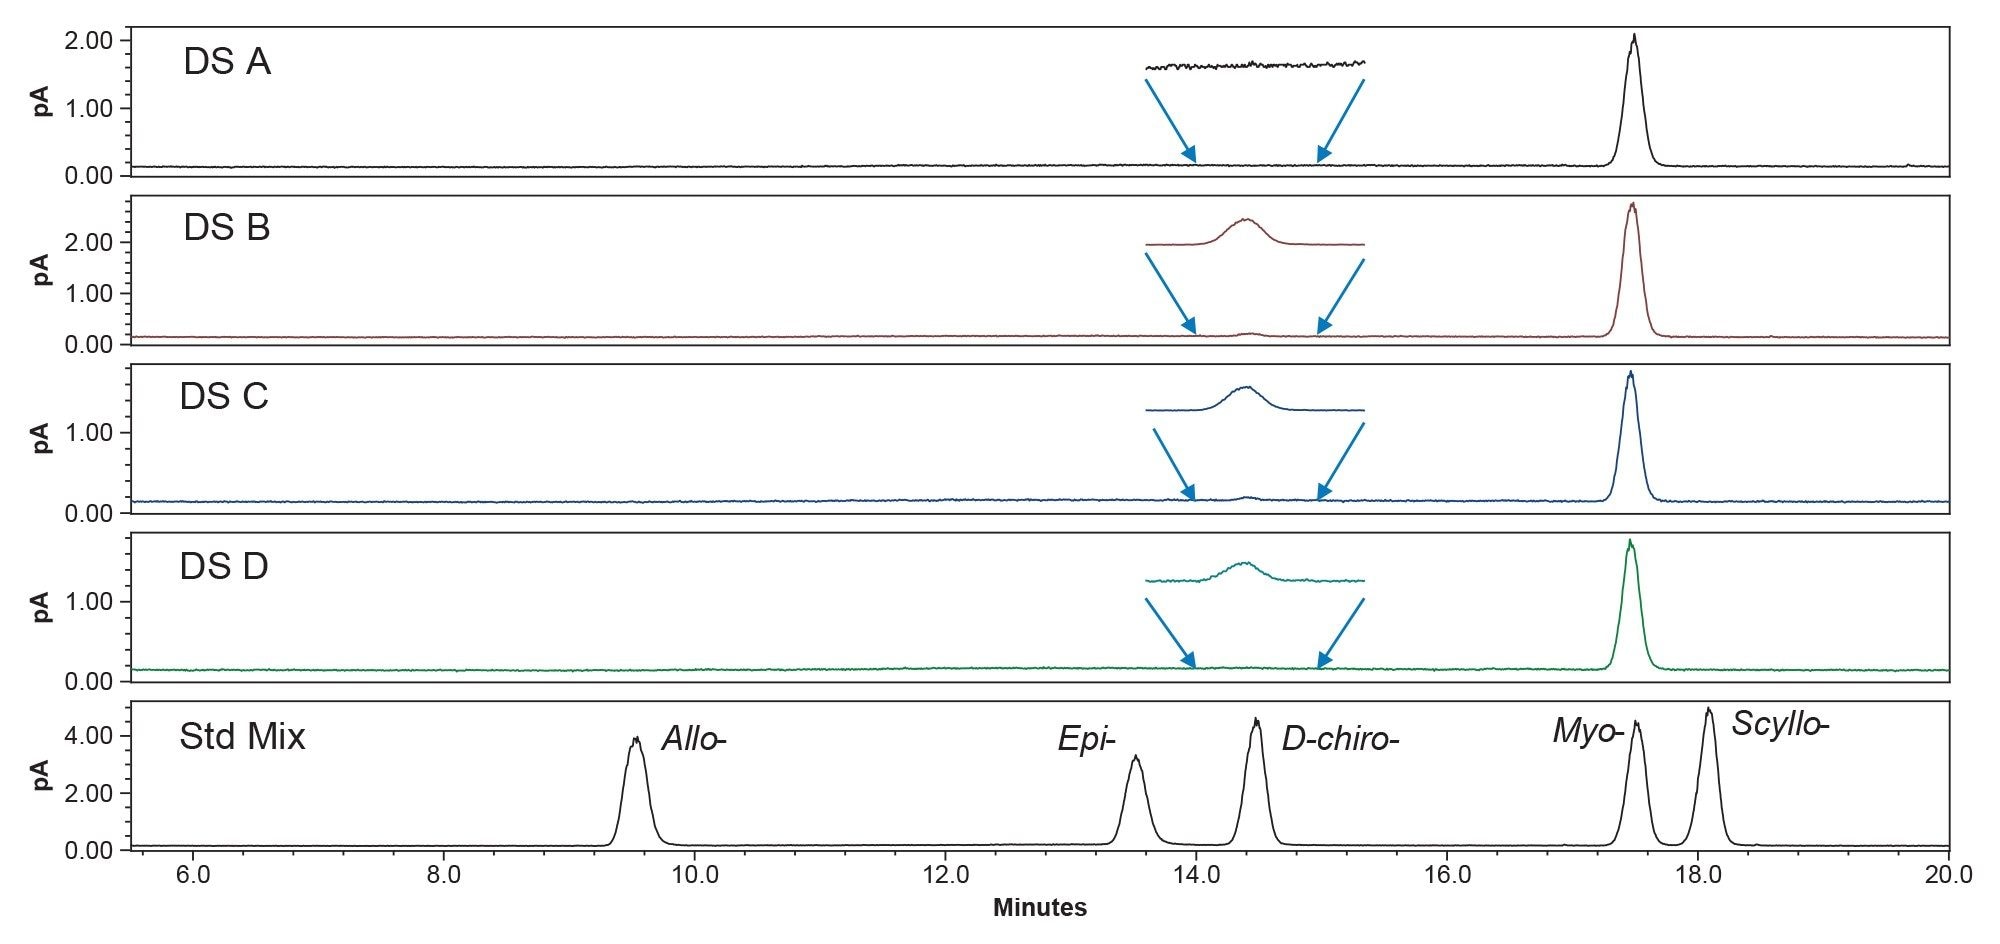
Four commercial dietary supplements containing D-chiro-inositol and myo-inositol were analyzed using the HILIC-CAD method. Figure 5 shows the chromatograms of samples and a standard mixture. The results, summarized in Table 3, showed that myo-inositol levels in all four products were consistent with their label claims, ranging from 99% to 109% of the declared label values. In contrast, notable variation was observed for D-chiro-inositol. Two products (DS B and DS C) showed concentrations comparable to their label claims, at 108% and 117%, respectively. However, DS A contained no detectable D-chiro-inositol, and DS D contained only approximately 35% of its labeled amount. These results highlighted a potential gap in the manufacturing quality control of D-chiro-inositol.
A HILIC-CAD method was developed for the simultaneous determination of multiple free inositol stereoisomers in dietary supplements. The method employed an ACQUITY BEH Amide Column on an Arc Premier System coupled with a Waters CAD, with system control and data acquisition managed by Empower Software.
The impact of key CAD operating parameters on detector response and S/N for inositol analysis was systematically evaluated. Among the parameters investigated, ion trap voltage exhibited the most significant influence on S/N. Optimization of this parameter, in combination with other instrument settings, resulted in substantial improvements in S/N and, consequently, enhanced detection sensitivity.
Method performance was assessed using commercial dietary supplements, demonstrating excellent accuracy, precision, and sensitivity. The method was successfully applied to the analysis of commercial products, with the majority of results showing strong agreement with labeled values. However, low levels of D-chiro-inositol observed in certain supplements suggested a potential gap in manufacturing quality control.
Overall, Waters CAD offers a reliable detection of UV-transparent inositol stereoisomers for routine QC testing of dietary supplements.
Waters, Empower, Arc, ACQUITY, UPLC, and BEH are trademarks of Waters Corporation or its affiliates. Mili-Q is a trademark of Merck KGaA.
720009478, July 2026


