Analysis of Antibiotics in Plasma for Clinical Research
For research use only. Not for use in diagnostic procedures.
Abstract
This application note describes a clinical research method using protein precipitation of a plasma sample with internal standards.
Benefits
- Low volume, simple sample preparation
- One preparation method for the quantification of 16 antibiotics that cover a wide range of polarities
Introduction
A reliable, clinical research method for the analysis of a large number of antibiotics in a single sample may play a role in understanding the pharmacokinetic and pharmacodynamic effects of their administration, as such behavior, is not currently well-understood.
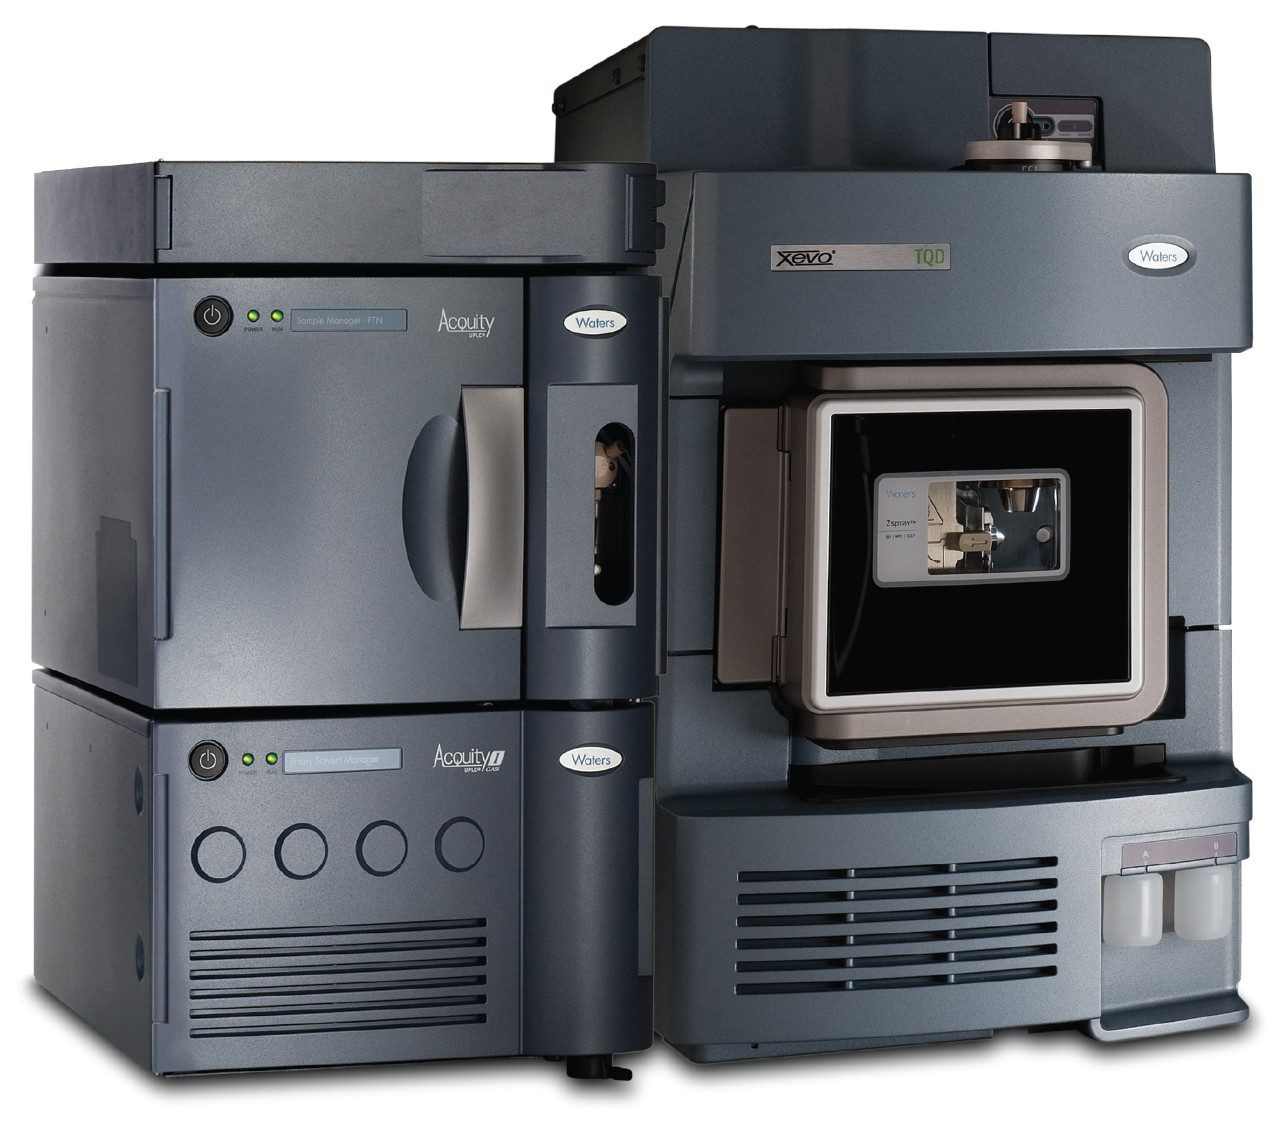
Here we describe a clinical research method using protein precipitation of a plasma sample with internal standards. Chromatographic elution was completed within 5 minutes, with the panel analyzed in two runs, using a Waters ACQUITY UPLC BEH C18 Column on a Waters ACQUITY UPLC I-Class followed by detection on a Xevo TQD Mass Spectrometer utilizing polarity switching (Figure 1).
Experimental
Sample Preparation
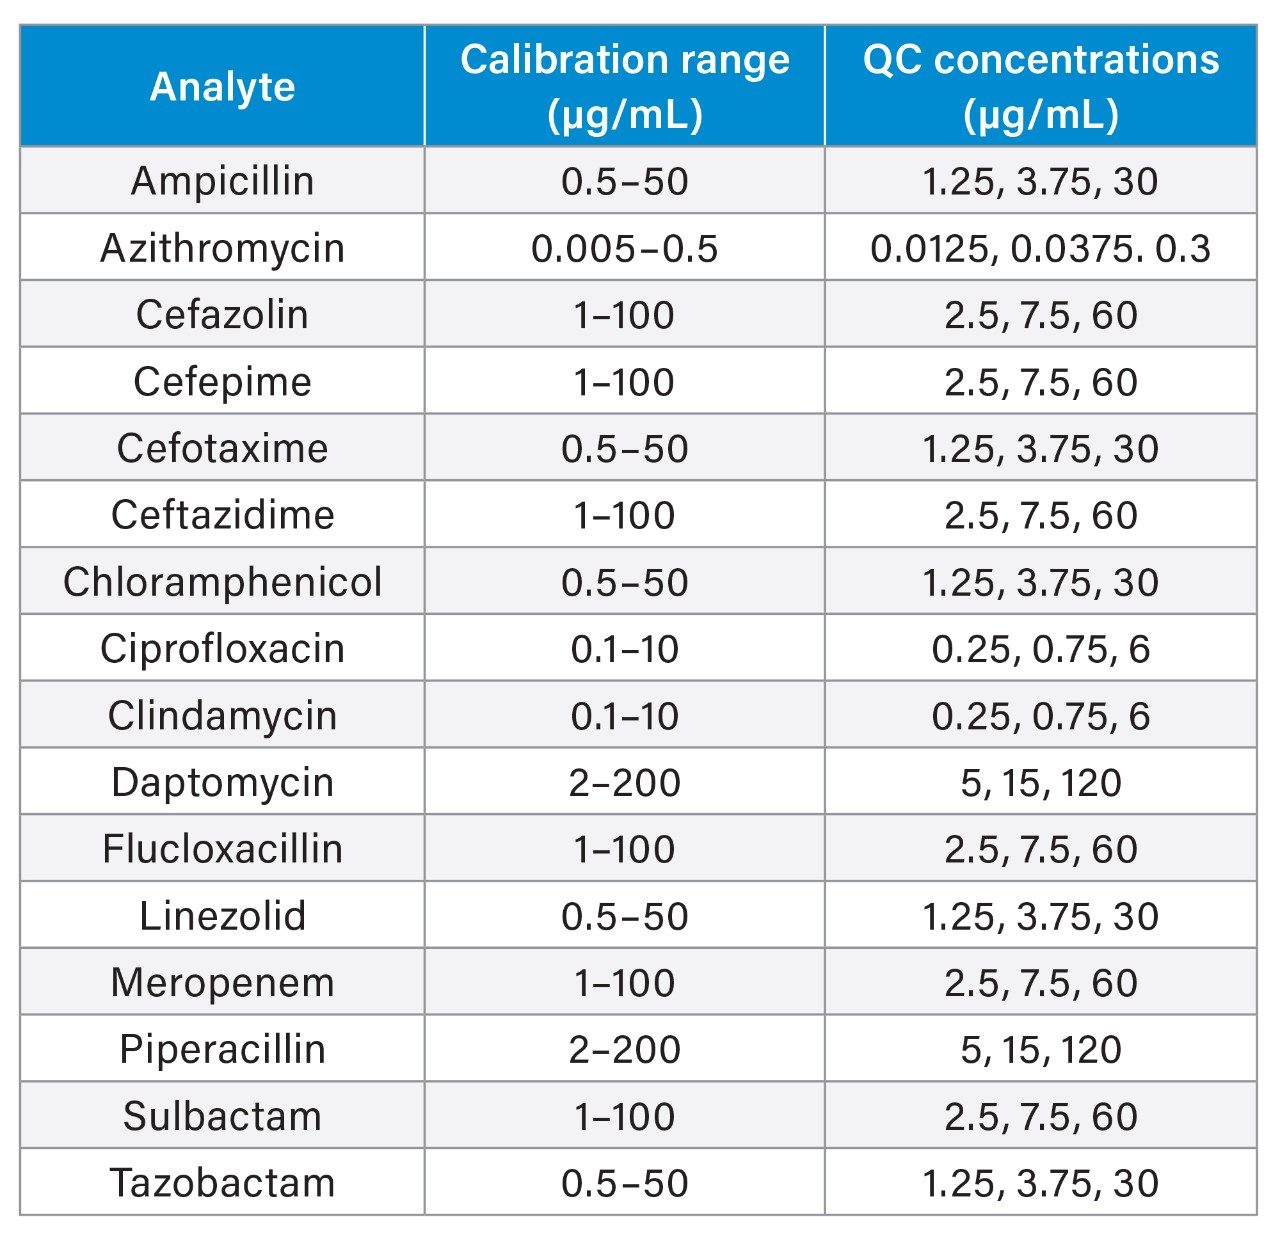
Plasma calibrators and quality control materials were prepared in-house using pooled human plasma supplied by BioIVT (West Sussex, UK). Concentrated stock solutions were prepared from certified powders and solutions supplied by Cambridge Bioscience (Cambridgeshire, UK), Fisher (Loughborough, UK), Merck Life Science (Dorset, UK), and Toronto Research Chemicals (Ontario, Canada). Stable labelled internal standards were supplied by Alsachim (Strasbourg, France), Cambridge Bioscience (Cambridgeshire, UK), and Toronto Research Chemicals (Ontario, Canada). The calibration and QC concentrations (at low, medium, and high concentrations) are detailed in Table 1.
Sample Extraction
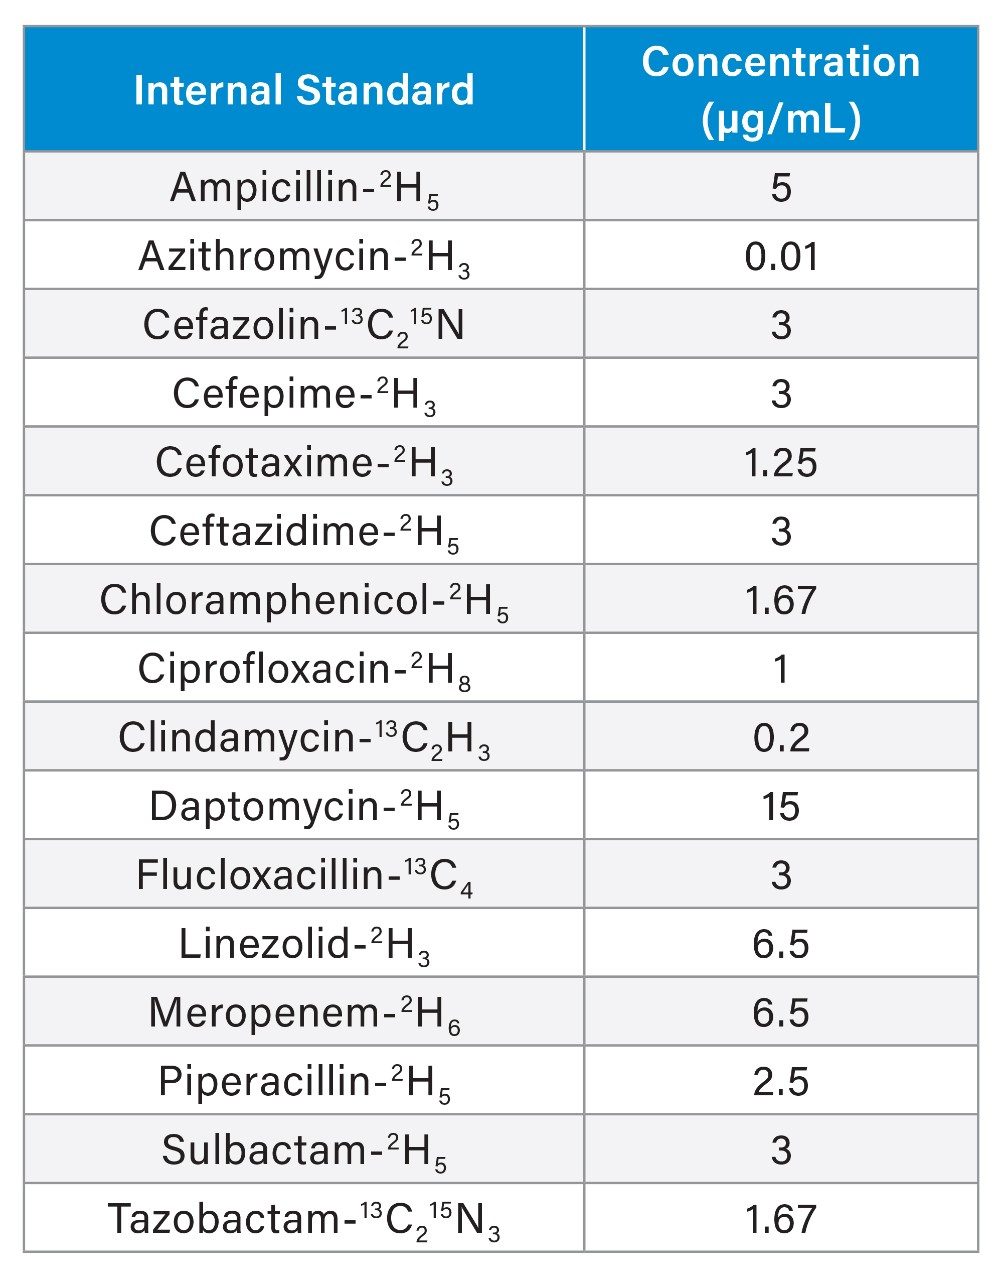
To 50 µL of sample in a microcentrifuge tube, 150 µL of internal standard in methanol was added, the concentrations of internal standards are detailed in Table 2.
Tubes were placed on a multi-tube vortex mixer at 2500 rpm for 30 seconds, then centrifuged for 2 minutes at 16,100 g. 100 µL of supernatant was transferred to a 1 mL 96-well plate and 300 µL water containing 1% formic acid added. The plate was then centrifuged at 4,696 g for 2 minutes prior to analysis. The extracts were analyzed in two runs (Set 1 and Set 2). Meropenem samples should be analyzed first, as the extracts are unstable. It is recommended the analysis is completed within 8 hours.
UPLC Conditions
|
System: |
ACQUITY UPLC I-Class with FTN |
|
Needle: |
30 µL |
|
Column: |
ACQUITY UPLC BEH C18 Column; 1.7 µm, 2.1 x 100 mm (p/n: 186002352) |
|
Mobile phase A: |
Water + 0.1% ammonia |
|
Mobile phase B: |
Methanol |
|
Needle wash solvent: |
80% Aqueous methanol + 0.1% formic acid |
|
Purge solvent: |
10% Aqueous methanol |
|
Seal wash: |
20% Aqueous methanol |
|
Column temp: |
60 °C (precolumn heater active) |
|
Injection volume: |
2 µL*/10µL** |
|
Flow rate: |
0.50 mL/min |
|
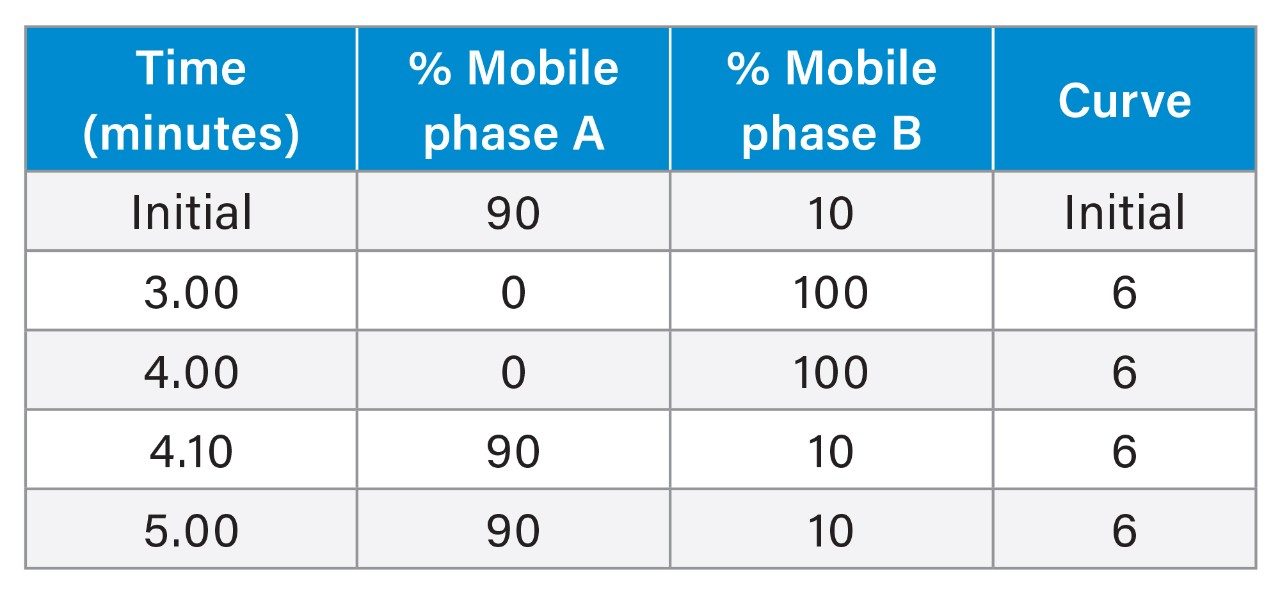
Gradient elution: |
Table 3 |
|
Run time: |
5.0 minutes (5.5 minutes injection-to-injection) |
* Set 1: Cefazolin, cefepime, ciprofloxacin, clindamycin, flucloxacillin, linezolid, meropenem, and piperacillin.
** Set 2: Ampicillin, azithromycin, cefotaxime, ceftazidime, chloramphenicol, daptomycin, sulbactam, and tazobactam.
Gradient Elution
MS Conditions
|
System: |
Xevo TQD |
|
|
Resolution: |
MS1 (0.7 FWHM) MS2 (0.7 FWHM) |
|
|
Acquisition mode: |
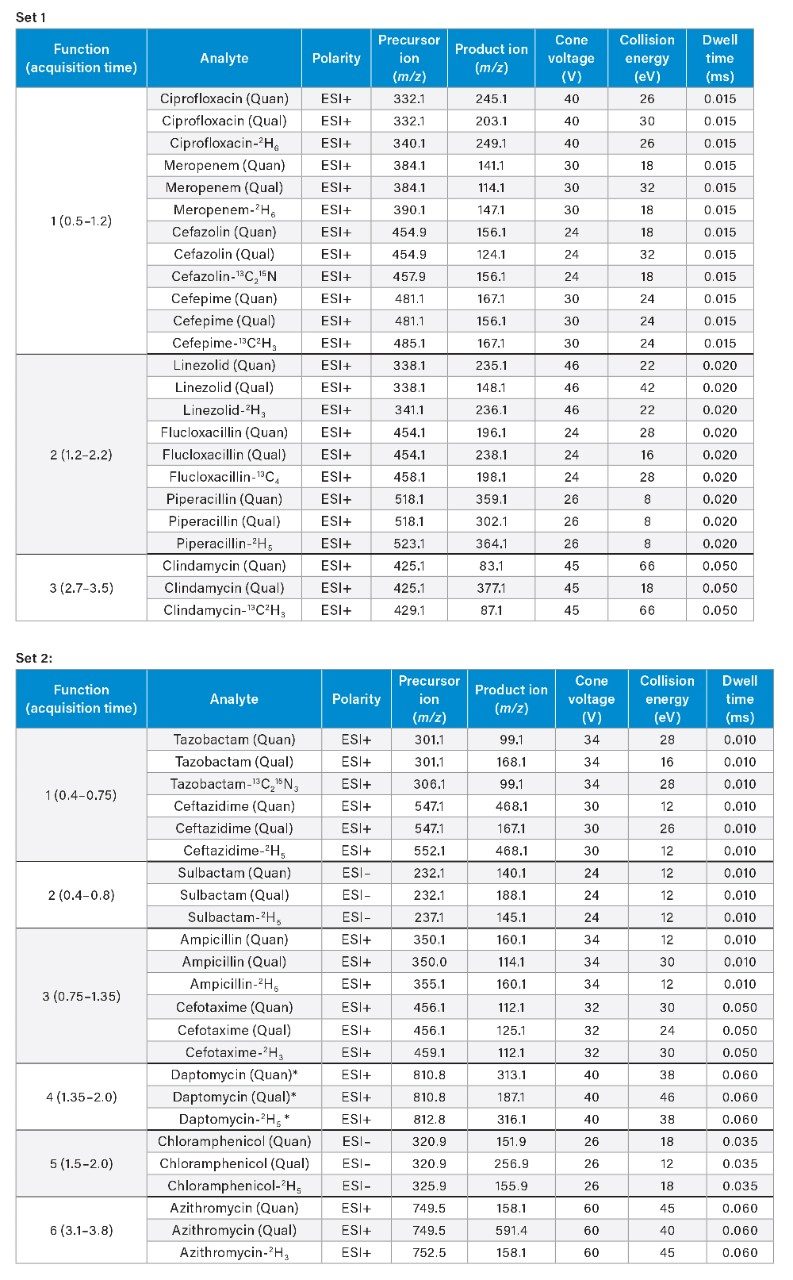
Multiple Reaction Monitoring (MRM) (see Table 4 for details) |
|
|
Polarity: |
ESI positive ionization/ESI negative ionization (ESI +/ESI -) |
|
|
Capillary: |
3.0 kV (ESI+)/3.0 (ESI-) |
|
|
Source temperature: |
150 °C |
|
|
Desolvation temperature: |
500 °C |
|
|
Cone gas: |
100 L/hr |
|
|
Inter-scan delay: |
0.003 seconds |
|
|
Polarity/mode switch inter-scan delay: |
0.020 seconds |
|
|
Inter-channel delay: |
0.003 seconds |
Data Management
|
Software: |
MassLynx v4.2 with TargetLynx Application Manager |
Method Conditions
*Note: Daptomycin has a molecular weight of 1620.7 g/mol, the doubly charged [M+2H]2+ ion is most abundant.
Results and Discussion
No system carryover was observed following analysis of plasma samples containing antibiotics at the corresponding highest calibrator concentration for each analyte shown in Table 1.
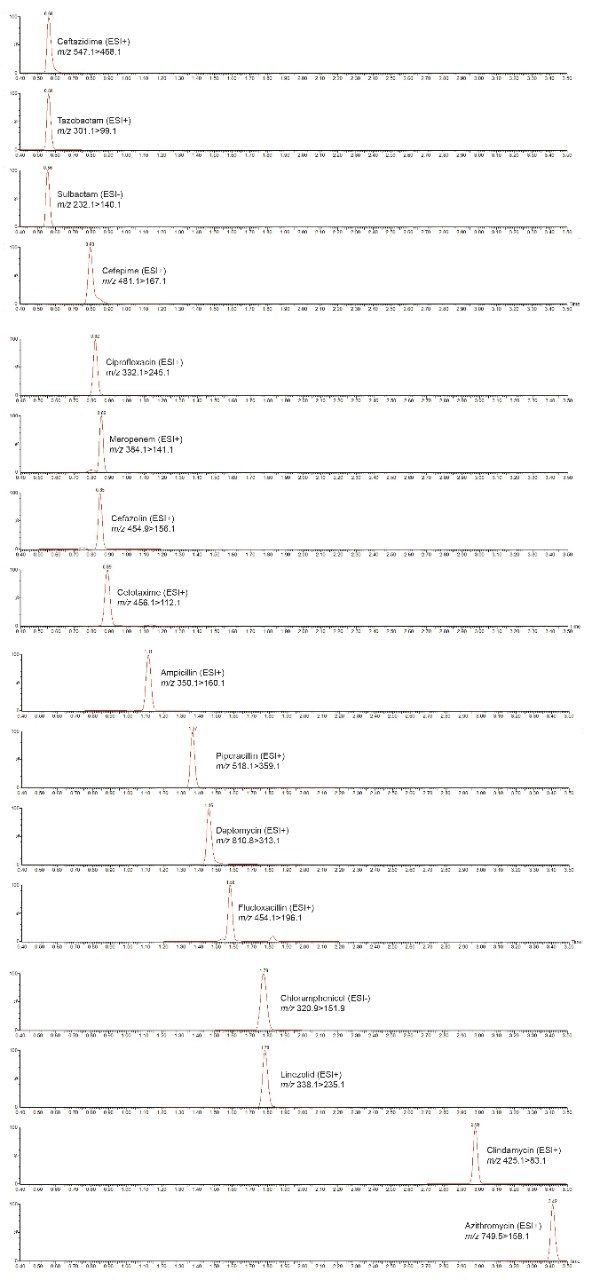
Figure 2 shows an example chromatogram for the analysis of the 16 antibiotics.
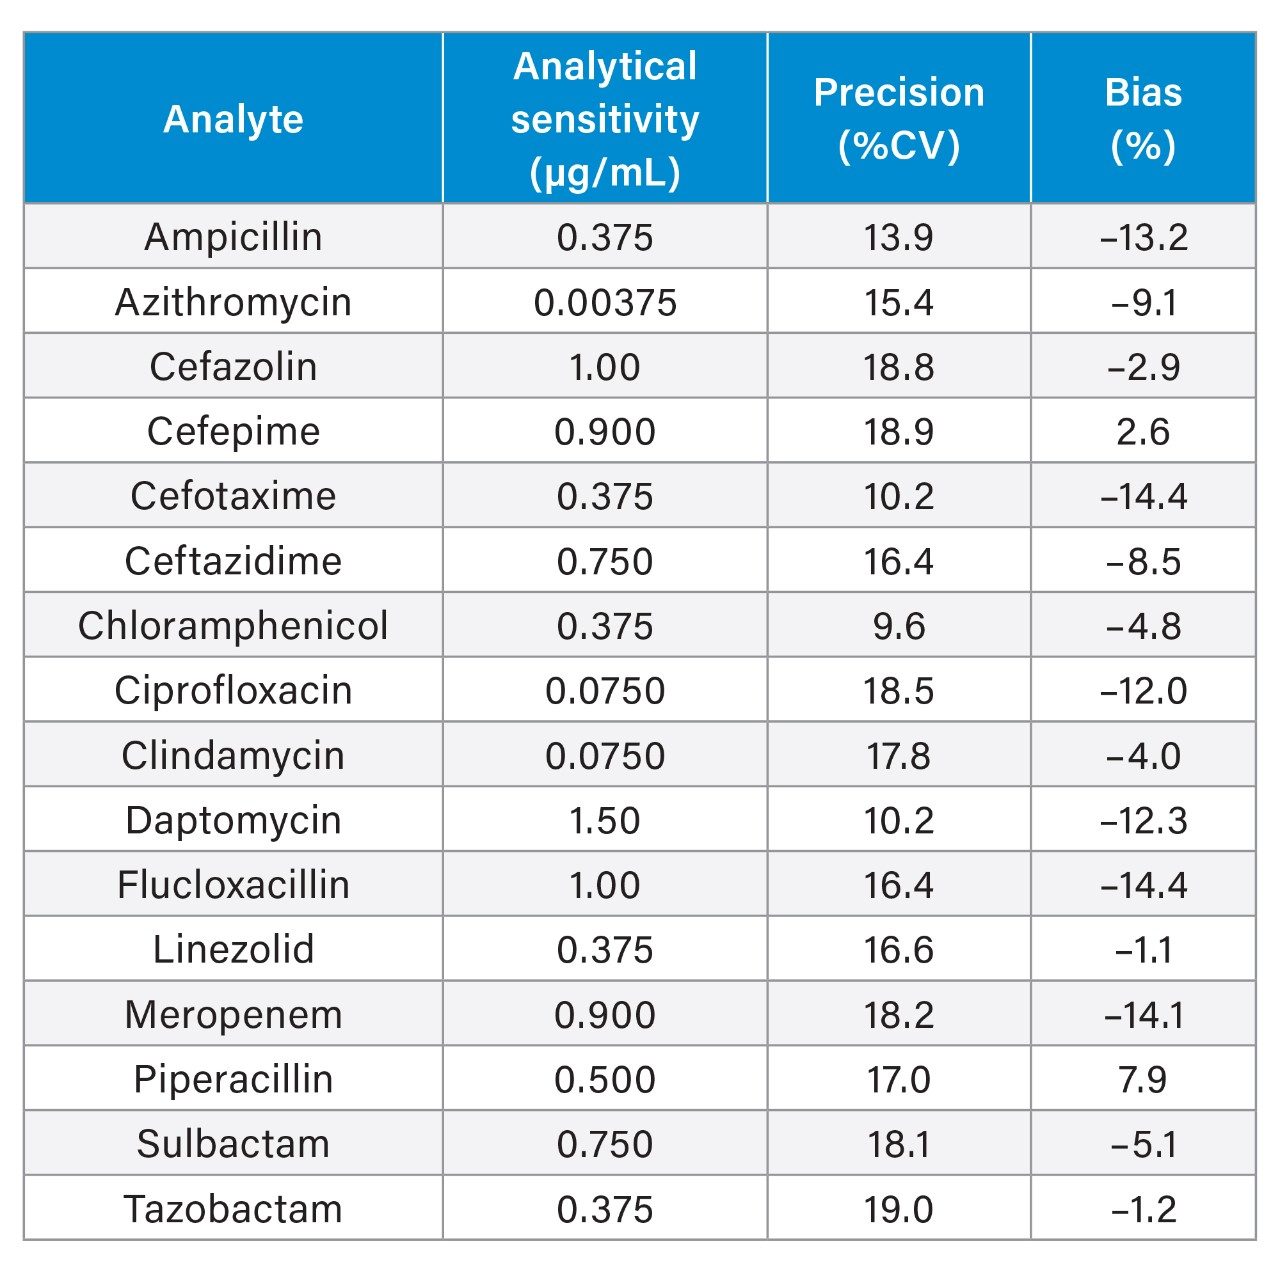
Analytical sensitivity was assessed by extracting and quantifying 10 replicates of low concentration samples prepared in plasma over five days (n=50). Investigations indicated the method would allow for precise quantification (≤20% CV, ≤15% bias) at the concentrations shown in Table 5.
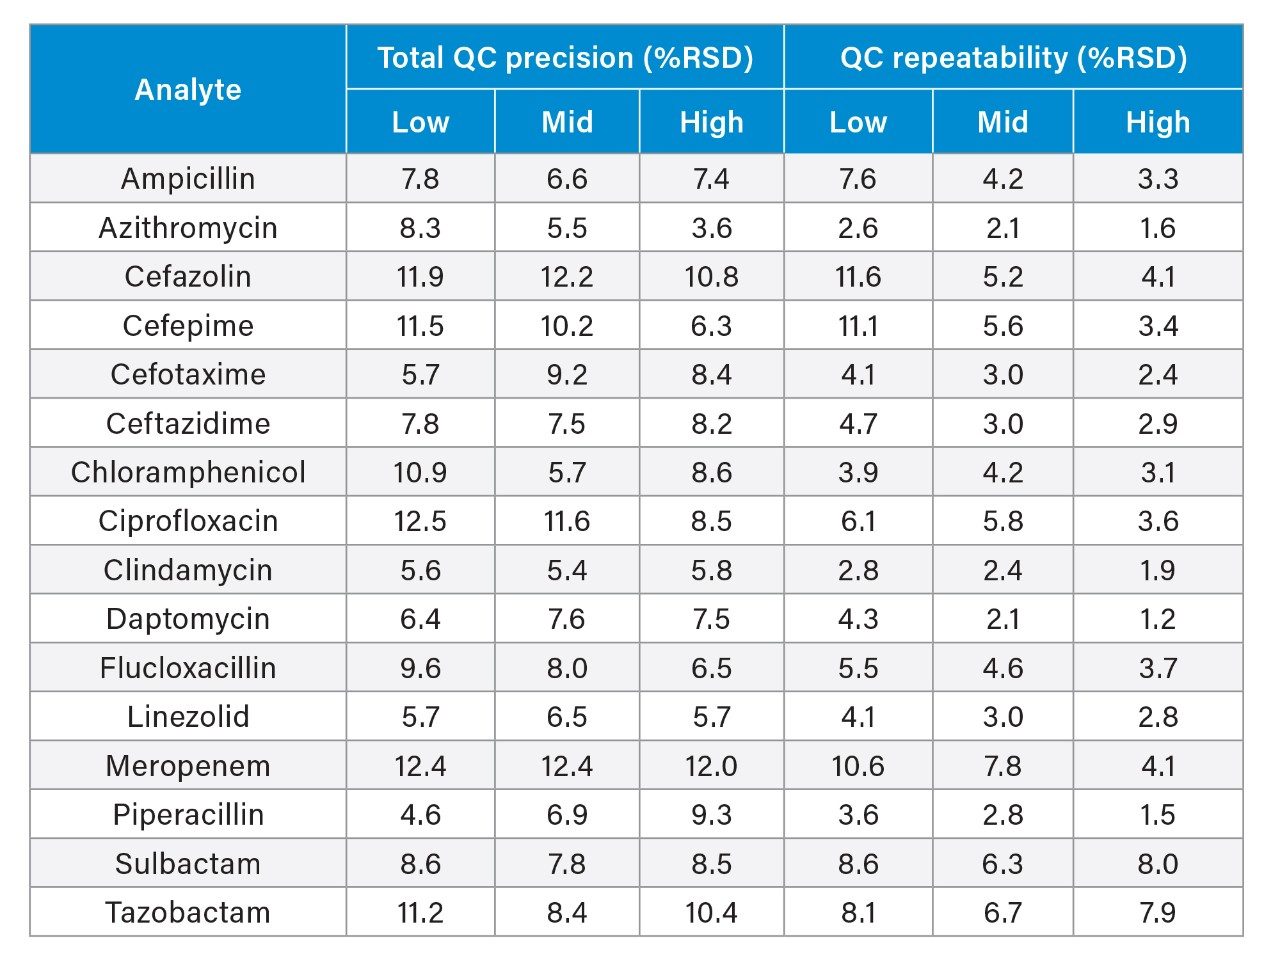
Total precision was determined by extracting and quantifying five replicates of three concentrations of plasma pools over five separate days (n=25). Repeatability was assessed by analyzing five replicates at each QC level. Table 6 presents results of these experiments, where total precision and repeatability at the three concentrations assessed was ≤12.5 % RSD.
The method was shown to be linear over the ranges shown in Table 1 for cefepime, daptomycin, piperacillin, and sulbactam when low and high pools were mixed in known ratios over the range. Ampicillin, azithromycin, cefazolin, cefotaxime, ceftazidime, chloramphenicol, ciprofloxacin, clindamycin, flucloxacillin, linezolid, and meropenem were determined to be quadratic fits over the ranges shown in Table 1.
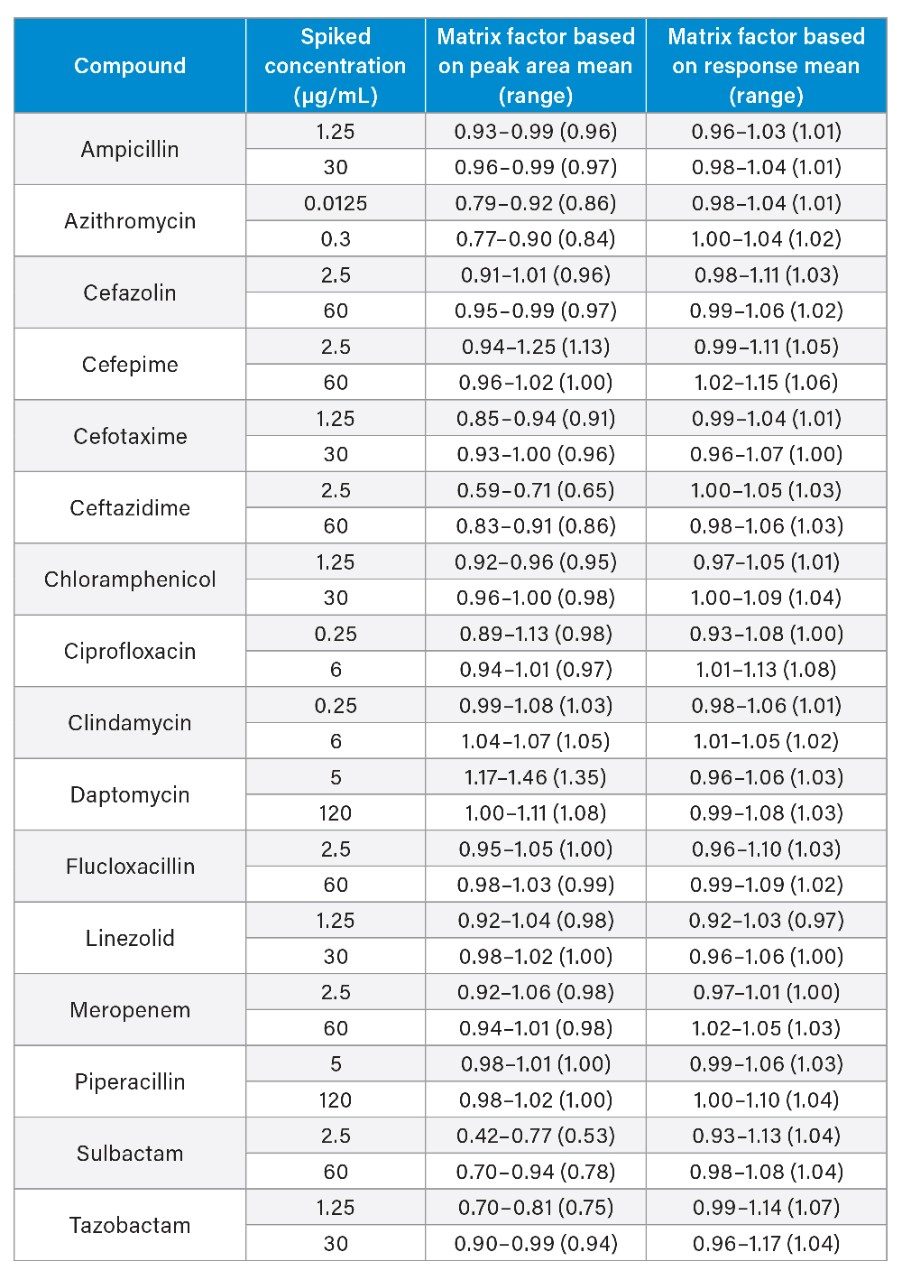
Matrix effects were evaluated at low and high QC concentrations in plasma (n=6) taken as a percentage of extracted solvent samples spiked to equivalent concentrations. Calculation using analyte: internal standard response ratio indicated compensation for signal enhancement or suppression by the internal standard (Table 7).
Potential interference from endogenous compounds (albumin, bilirubin, cholesterol, creatinine, triglycerides, and uric acid) spiked at high concentrations was assessed by determining the recovery (n=3) from low and high pooled plasma samples (QC1 and QC3 concentrations). Recoveries ranged from 85.7–115.5%.
Conclusion
The developed method for clinical research demonstrates the capabilities of the sample preparation and UPLC-MS/MS system to quantify 16 antibiotics in plasma, using one sample preparation procedure analysed in two runs. The method demonstrated no system carryover over the test range and matrix effects observed for each analyte were compensated for very effectively using the chosen stable labeled internal standards.
Featured Products
720007388, October 2021