• Application Note

High-Performance Vion IMS QTof for Monoclonal Antibody Intact and Subunit Mass Analysis

High-Performance Vion IMS QTof for Monoclonal Antibody Intact and Subunit Mass Analysis

  • Henry Shion
  • Ying Qing Yu
  • Waters Corporation

Abstract

This application note focuses on Vion system performance for intact mAb and subunit mass analysis, covering the sensitivity, mass accuracy, and consistency in relative quantitation of glycosylation while maintaining the data integrity. The complete system is comprised of an ACQUITY UPLC H-Class Bio System coupled to an ACQUITY UPLC Tunable Ultraviolet (TUV) Detector and a Vion IMS QTof Mass Spectrometer. Waters UNIFI Scientific Information System was used for automatic data acquisition, processing, and reporting.

Benefits

  • Minimal tuning effort for intact protein data acquisition
  • High sensitivity for intact mAb analysis: routine measurement with 1 ng of intact mAb loading on analytical scale chromatography
  • High mass accuracy and high resolution for intact and subunit analyses
  • Highly consistent relative quantitation

Introduction

Biotherapeutic protein products, including monoclonal antibodies (mAbs), are structurally heterogeneous molecules due to their naturally occurring post-translational modifications and process-induced changes that occur at different stages of the production. Regulatory agencies demand a thorough characterization of these protein products in order to establish a control strategy to ensure the consistency of product quality, and drug safety and efficacy. High-resolution mass spectrometry is a powerful tool for mass measurements of the intact mAb and its subunits, providing fast and accurate information for PTM profiling and quantitation of a heterogeneous mAb.

The major challenges of applying a high-resolution LC-MS approach for intact mAb and subunit analyses are: 1) the accuracy and reproducibility of the mass measuerments at the intact and subunit levels; and 2) confident identification and robust quantification of its modifications, such as glycosylation. In this study, we demonstrated the benefit of using Vion IMS QTof Mass Spectrometer integrated with a compliant-ready informatics tool, UNIFI Scientific Information System, for intact mAb and subunit analysis.

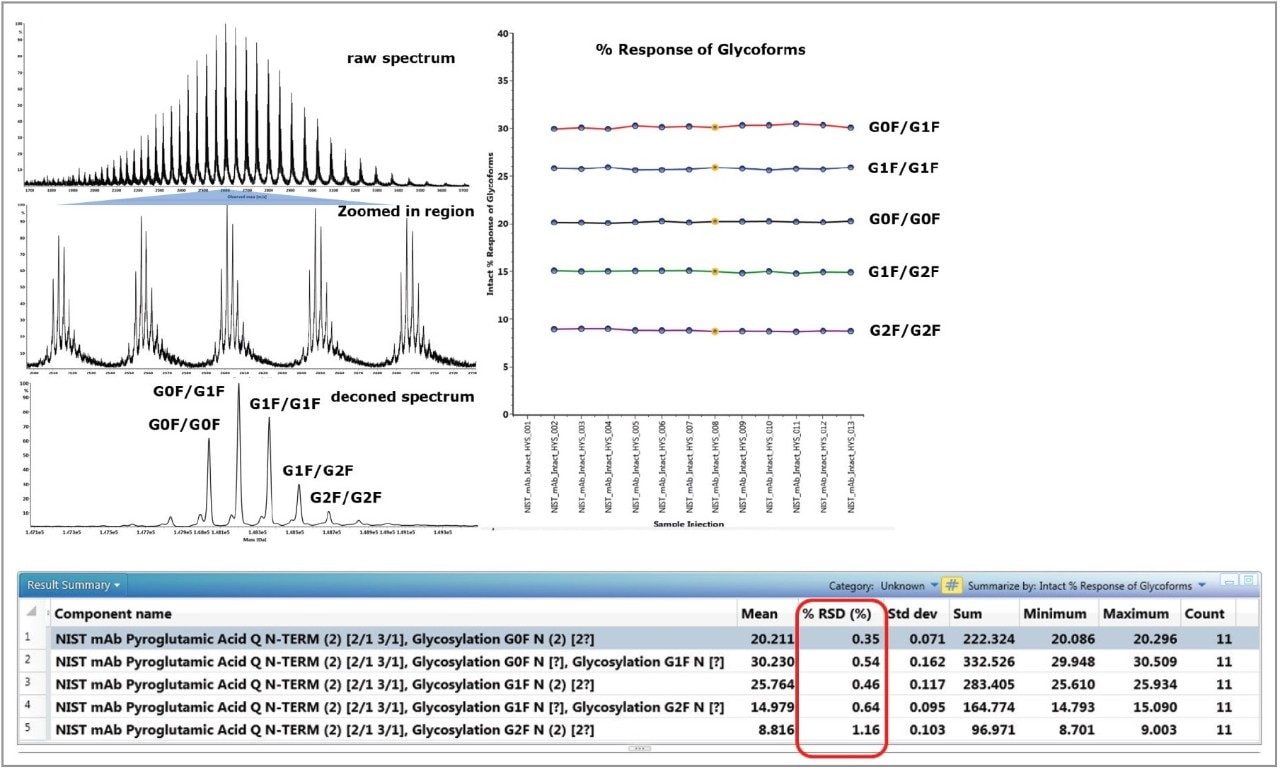
Vion is an advanced benchtop QTof IMS MS instrument from Waters. It is equipped with a new ADC2 detector (QuanTof2) for enhanced sensitivity and dynamic range, and employs a more efficient vacuum pump compared to predecessor QTof instruments. As a versatile mass spectrometer under the control of workflow-driven software (UNIFI), Vion is ideal for a variety of applications for the development and quality control of biopharmaceutical products. This application note focuses on Vion system performance for intact mAb and subunit mass analysis, covering the sensitivity, mass accuracy, and consistency in relative quantitation of glycosylation while maintaining the data integrity. The complete system is comprised of an ACQUITY UPLC H-Class Bio System coupled to an ACQUITY UPLC Tunable Ultraviolet (TUV) Detector and a Vion IMS QTof Mass Spectrometer. Waters UNIFI Scientific Information System was used for automatic data acquisition, processing, and reporting.

Figure 1. The Vion IMS QTof Mass Spectrometer – operated by  workflow-driven, compliant-ready UNIFI Scientific Information System –  provides a single platform for instrument control, data processing, and reporting.

Experimental

Reagents, solvents, and sample preparation

Intact mass analysis

Waters mAb standard (1 mg) was dissolved in 25 mM NH4HCO3 to prepare a stock solution of 1.0 mg/mL. The stock solution was then diluted (in 25 mM NH4HCO3) to 0.1 mg/mL and 0.01 mg/mL. NIST mAb (stock solution at 10 mg/mL) was diluted 100 fold to  a concentration of 0.1 mg/mL (µg/µL) in 25 mM NH4HCO3.

Subunit analysis

100 µg of trastuzumab protein (stock solution concentration: 21 mg/mL) was added to a strip well containing 100 units IdeS (Genovis, Sweden). Then digestion buffer solution (50 mM sodium phosphate, 150 mM NaCl, pH 6.6) was added to the well to  make a final protein concentration of 1 µg/µL. The digestion was allowed to proceed at 37 °C for 30 minutes. The digested sample was then reduced by 20 mM DTT in a buffer of 0.1 M TRIS-HCl (pH 8.0), 1 mM EDTA, and 7.5 M Guanidine hydrochloride (GuHCl)) at 37 °C for 30 minutes. An aqueous solution with 3% acetonitrile–0.1% formic acid was added to terminate the reduction reaction. 1.0 µL of the 0.1 µg/µL solution was injected for LC-MS analysis.


Gradient

For intact mass analysis

Gradient

For subunit analysis

Results and Discussion

For intact and subunit mass analysis using high-resolution mass spectrometry, the major challenges are to measure these molecular masses accurately and reproducibly, and to quantify glycoforms in a robust manner. In this section, we present experimental results for intact mass analysis data of Waters mAb and NIST mAb. In addition, the mass analysis data of trastuzumab subunits are also included. The performance of the Vion IMS QTof with UNIFI for biotherapeutic protein analysis is demonstrated by detection sensitivity, mass accuracy, and reproducibility of relative quantification of glycoforms.

Intact mAB mass analysis (Waters mAB and NIST mAB reference standard)

Figure 2. Combined raw (smoothed) spectra and deconvoluted spectra from an intact mass analysis dilution series (1.0 ng to 1000.0 ng loading on the column) with Waters mAb standard.

Figure 2 shows the mass spectra of Waters mAb from a series of injections of mass loadings ranging from 1.0 ng to 1000 ng. The left panel displays the combined raw (smoothed) mass spectra, the overall charge envelope, and a zoomed-in view of a single charge state (52+). The deconvoluted spectra of the series are shown on the right panel of the figure. The combined spectrum generated from an on-column injection of 1.0 ng* shows good signal-to-noise ratio for the charge envelope. Upon deconvolution, the major glycoform peaks showed consistent relative abundance compared to the combined spectra across data from different loading amounts.

*Please be advised that in a separate report (data will be published later), a lower limit of system detection and lower limit of quantitation were achieved at the 0.1 ng loading on-column level (for 2.1 mm column) when an intact trastuzumab protein sample containing 0.1% BSA as the carrier protein (matrix) was analyzed.

Figure 3 shows the experimental results in the UNIFI review panel for intact mass analysis of the commercially available NIST mAb. The component table on the top summarizes the five major glycoforms identified in NIST mAb, with the corresponding (customizable for display) intensity response, the observed and expected (theoretical) masses, the calculated mass error in ppm, and the relative abundance of the respective glycoforms in a highlighted injection. The summary plot on the bottom shows the mass errors of the five major glycoforms identified in 11 injections in one simple display. The average mass accuracies for the all  five major glycoforms are less than 10 ppm.

Figure 3. Automatically processed NIST mAb intact mass analysis experimental results displayed in the UNIFI review panel.
Figure 4. Spectral quality and data integrity are the key factors for successful intact mass analysis. Relative quantitation of the major glycoforms of the NIST mAb reference standard is displayed here. Across 11 injections, we were able to obtain a consistent relative percentage of the glycoforms. The %RSD is less than 1.5%, as highlighted in red.

In the intact protein mass analysis, high spectral quality and data integrity are the key factors for a successful experiment. In Figure 4, the raw spectrum (from the NIST reference mAb at 100 ng on-column) shows a very nice distribution of the charge envelope from m/z = 1800 to 3600. The zoomed/expanded region of the combined raw spectrum shows that each individual  charge state has a consistent relative abundance for the major glycoforms. The deconvoluted spectrum shows a similar pattern for the relative abundance of the major glycoforms compared to the raw spectrum. The relative abundances of the five major glycoforms identified in 11 injections were calculated and displayed in the trending plot on the right of the figure. The tight %RSD values indicate that the system offers excellent reproducibility and consistency in glycosylation profile measurements and their data deconvolution. 

Subunit analysis (trastuzumab)

To demonstrate the performance of a Vion System for subunit analysis, trastuzumab was digested with IdeS and then fully reduced by DTT in a tris buffer containing NaCl and EDTA (see experimental portion of this application note for details). Figure 5 shows the  raw spectra for trastuzumab (50 ng on-column) subunits: scFc, LC, and Fd. Excellent signal-to-noise ratios and complete charge distribution envelopes for the subunits indicate that high quality measurements can be readily achieved on the system. The expanded area of the LC spectrum at the 12+ charge state highlights the resolving power of the Vion System at the subunit level. 

Figure 5. Combined raw spectra for the trastuzumab (50 ng on-column) subunits scFc, LC, and Fd.

Figure 6 shows the experimental results, as displayed in the UNIFI review panel, for 50 ng of IdeS-digested trastuzumab on-column. The component summary table contains the MS responses, the deconvolution masses, the mass error, and the retention time for the respective scFc, LC, and Fd subunits. The mass accuracies for all the major peaks are found to be less than 10 ppm. The bottom left window of the review panel shows the TUV chromatogram containing three baseline resolved chromatographic peaks (scFc, LC, and Fd) with reported retention times of 5.19, 5.93, and 7.56 minutes, respectively. The bottom right window in the review panel shows the identified (and labeled) major glycoforms of the scFc after deconvolution in the component plot.

Figure 6. The analysis of trastuzumab (50 ng on-column) subunits displayed in the UNIFI review panel.

Conclusion

1. Overall system benefit: High-performance Vion IMS QTof combined with a workflow-driven, compliant-ready software is an ideal platform for biopharmaceutical characterization and attribute monitoring

2. Ease-of-use: Hassle-free system setup allows users to start the analysis quickly

3. Automated workflow: Automated workflow from data acquisition; mass deconvolution processing to report generation enables faster turnaround times for mAb analysis

4. High confidence in Vion data: High mass accuracy and highly consistent glycosylation profile measurements deliver confident results for intact and subunit analysis of mAbs (<1.5% RSD for relative glycoform quantitation).

720005906, January 2017

Voltar ao início Voltar ao início