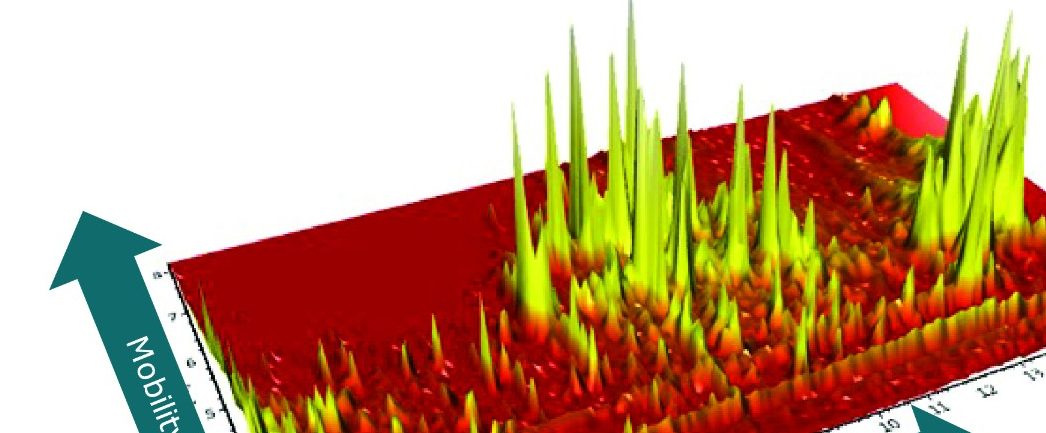
The combined peak capacity of UPLC-IM-MS and nitrogen buffer gas, travelling wave collision cross section measurements (TWCCSN2) can be used for routine unequivocal identification of marker flavonoid isomers in complex mixtures such as herbal tea products and dietary supplements. The genus Passiflora is comprised of approximately 450 species, but only a few are commercially exploited. Several Passiflora (Passifloraceae) species are utilized as phytomedicines (anxiolytics). These contain flavonoids, mainly C-glycosylflavones- apigenin and luteolin derivatives which frequently occur as isomers. Flavonoids are polyphenolic compounds that are ubiquitous in nature and are one of the largest and most widespread classes of compounds. To date, over 4,000 flavonoids have been identified and they have attracted considerable interest due to their diverse pharmacological and biological properties. Such attributes mean many flavonoid containing plant species may be used as functional foods or phytomedicines.
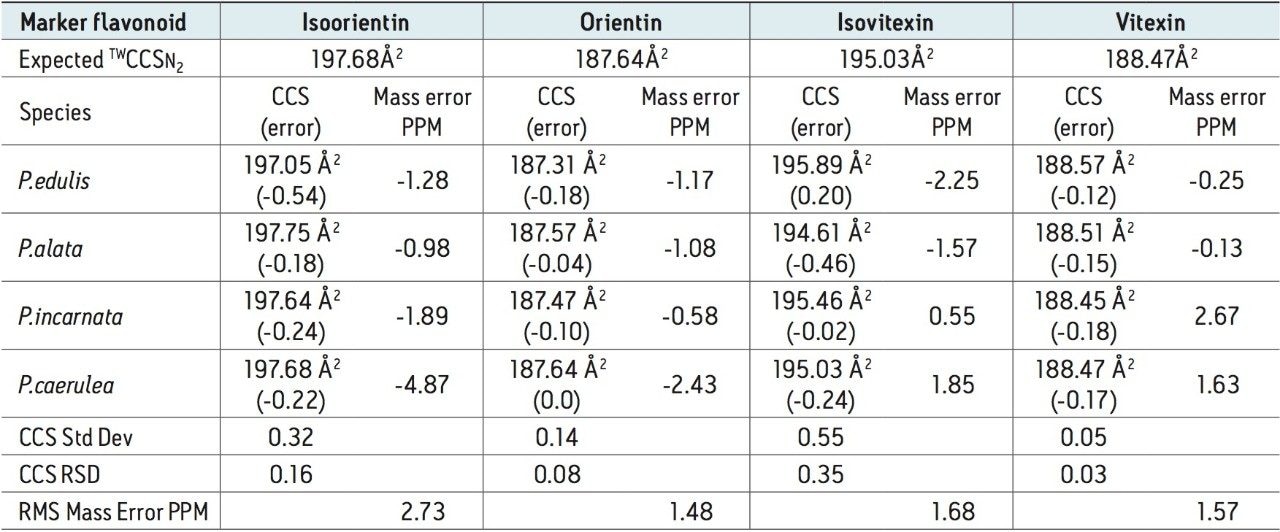
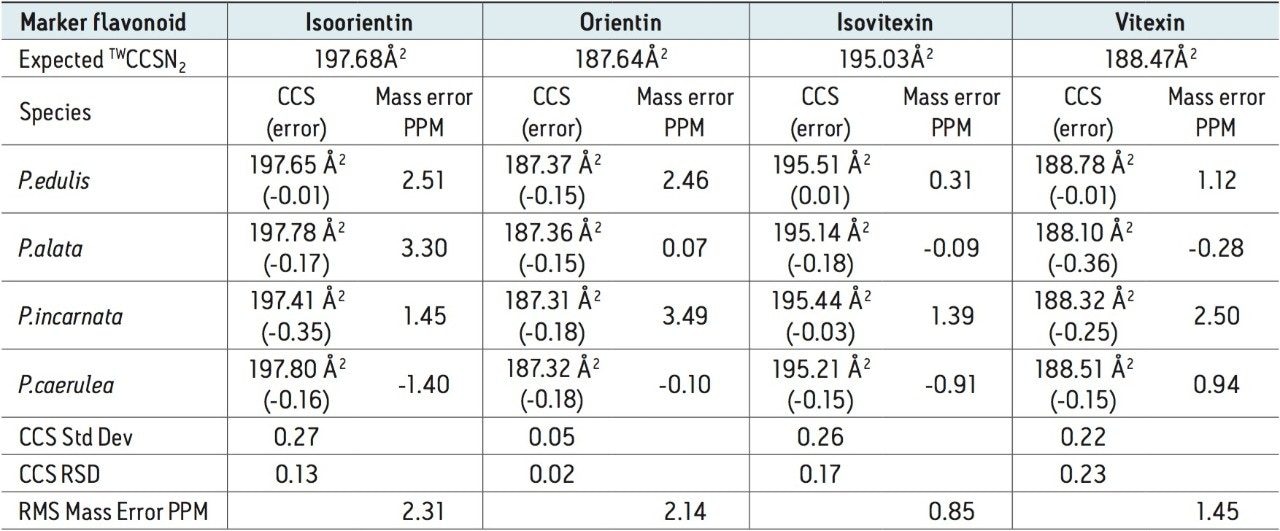
In the IM-MS authentication study performed P.incarnata, P.edulis, P.caerulea, and P.alata species have been profiled. The most well-known species of this family is Passiflora incarnata, which is found in Europe and North America. Originally from Brazil, P.edulis is very popular and cultivated in many countries for its edible fruits. Passion fruit (P.edulis and P.alata) is known as Maracujá in Brazil, the largest producer of P.edulis in the world. In the U.S. and EU it is popular because of its pleasant taste and sedative/traquilizing effects from infusion of its leaves. Leaf extracts are also utilized for flavoring and in juices by the food industry.2 The fruit are used in juices, ice creams, or eaten naturally. Passiflora edulis is also native to tropical areas of other South American countries, including Paraguay, Argentina, and Peru.
In addition to its anxiolytic effects P.edulis leaves are recognized for their anti-inflammatory activity. The protective role that the intake of P.edulis aqueous extract might exert in an organism has been studied. The phytochemical analysis of P.edulis leaves contained twice the flavonoid content of P.alata.3 A consumer product containing P.edulis will therefore have a greater phytochemical content that will produce greater sedative effects than a product containing an equivalent amount of P.alata. If P.alata. was substituted for P.edulis, the desired and expected sedative effects may not be experienced. Products labeled as “Natural” are not neccessarily safe, but such products can be, if produced to legisative standards. Manufacturers have to prove that their products have been made to strict standards and contain a consistent and clearly marked dose, as stipulated in EU Directive 2004/24/EC, which came into full effect 30 April 2011.
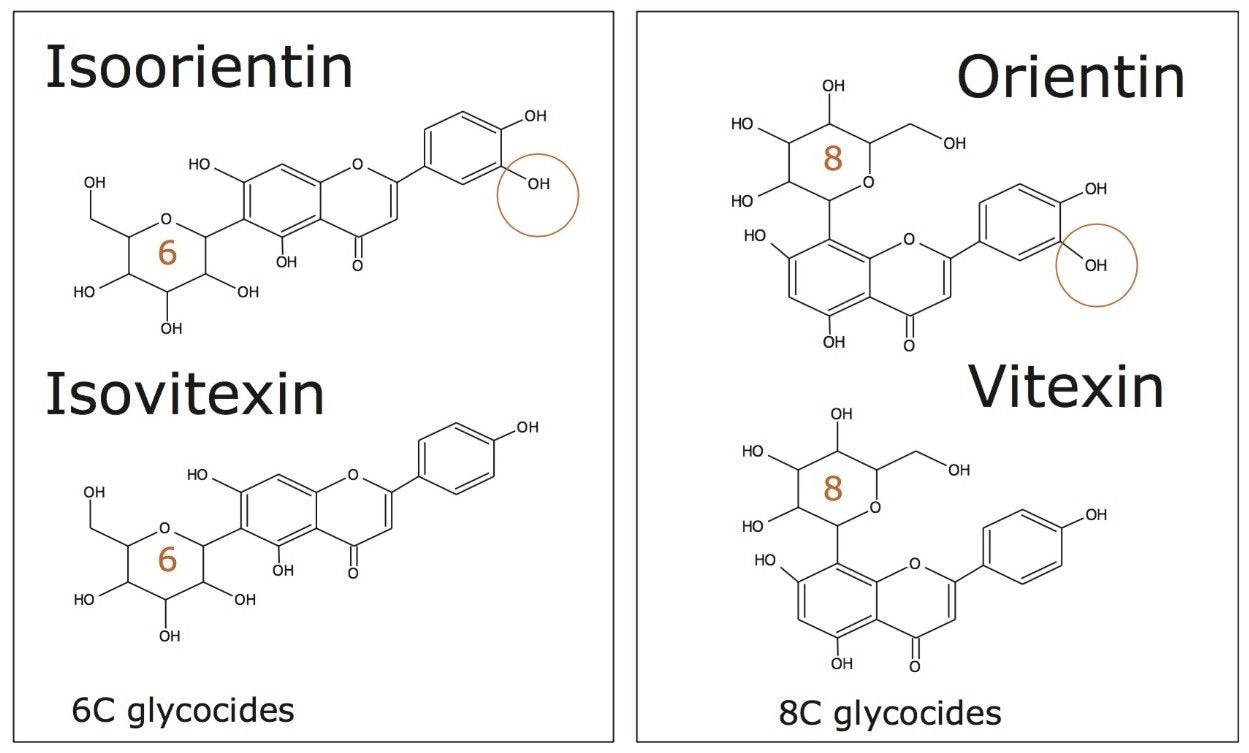
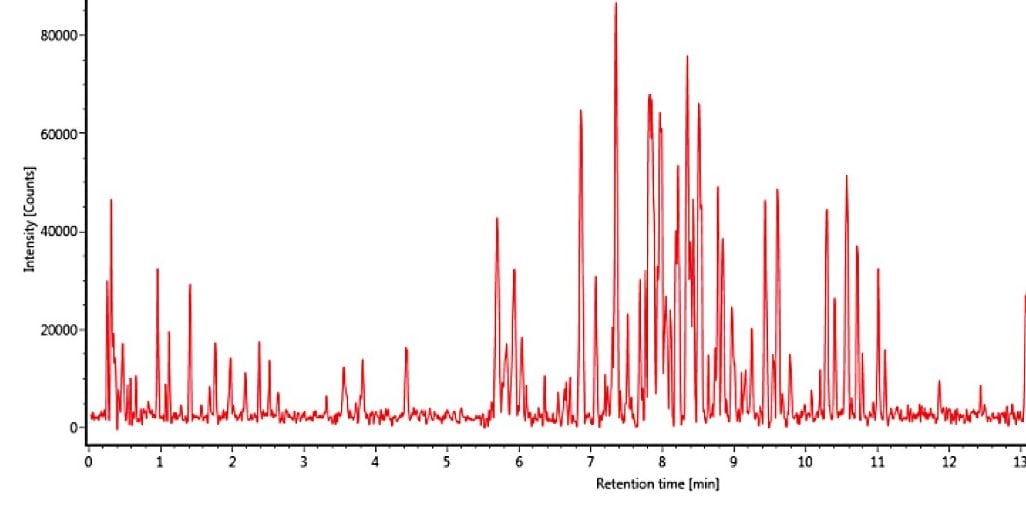
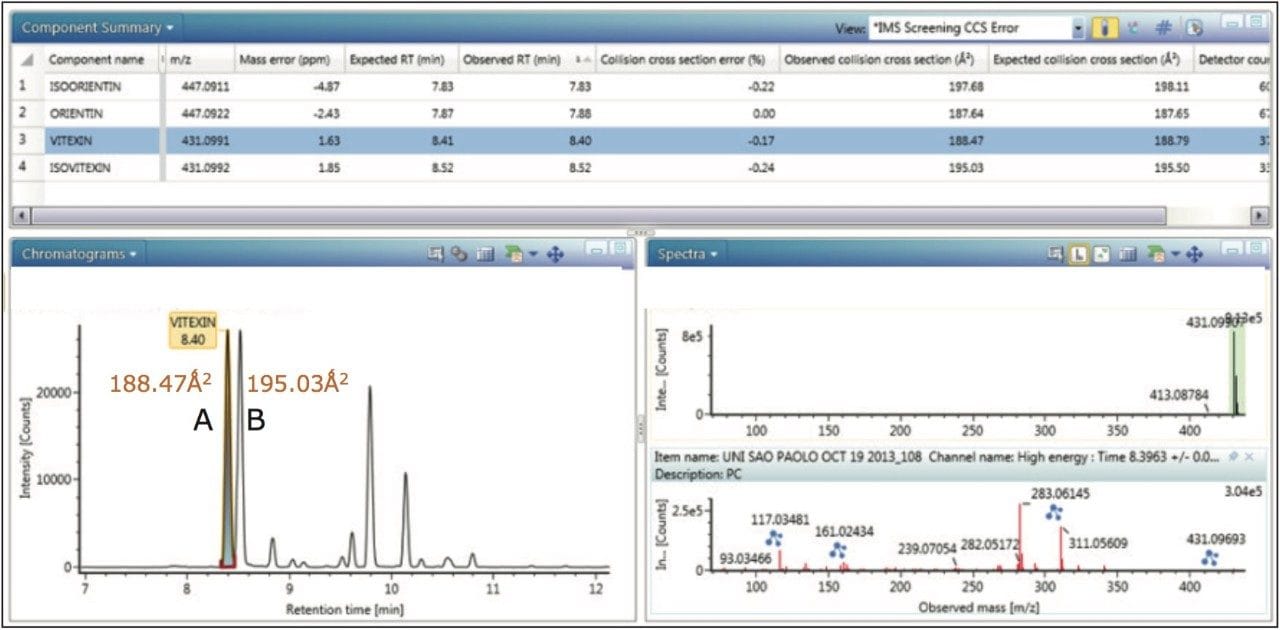
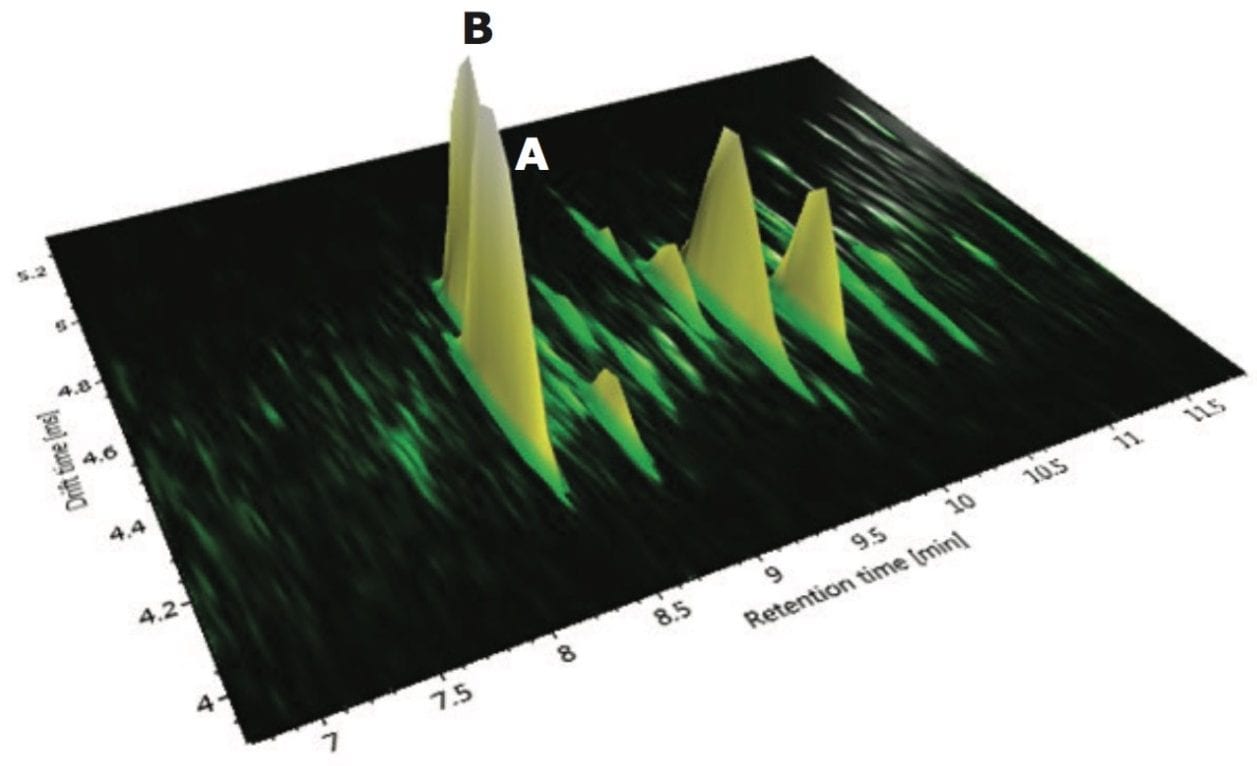
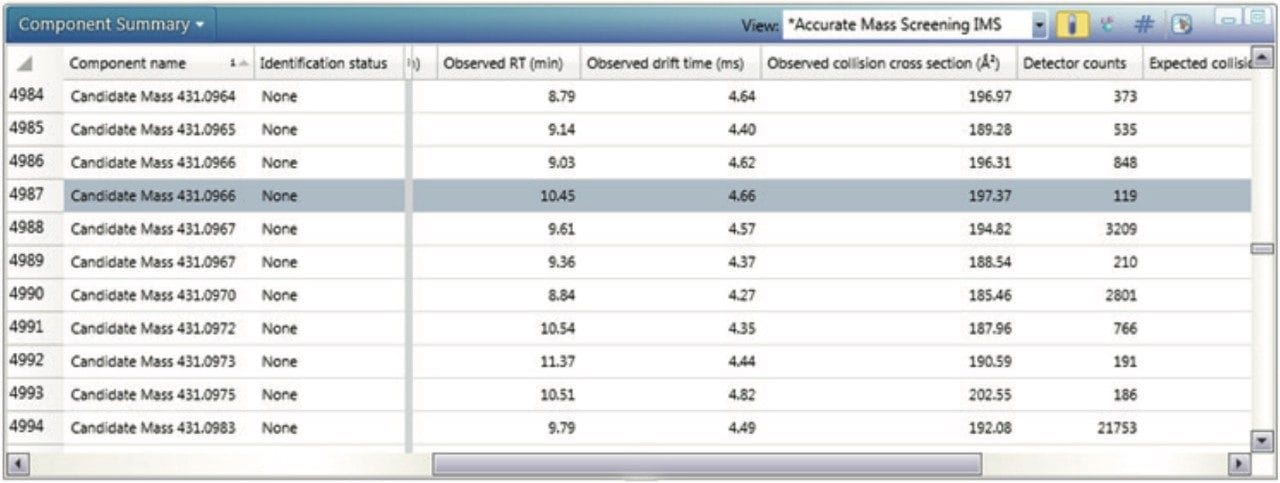
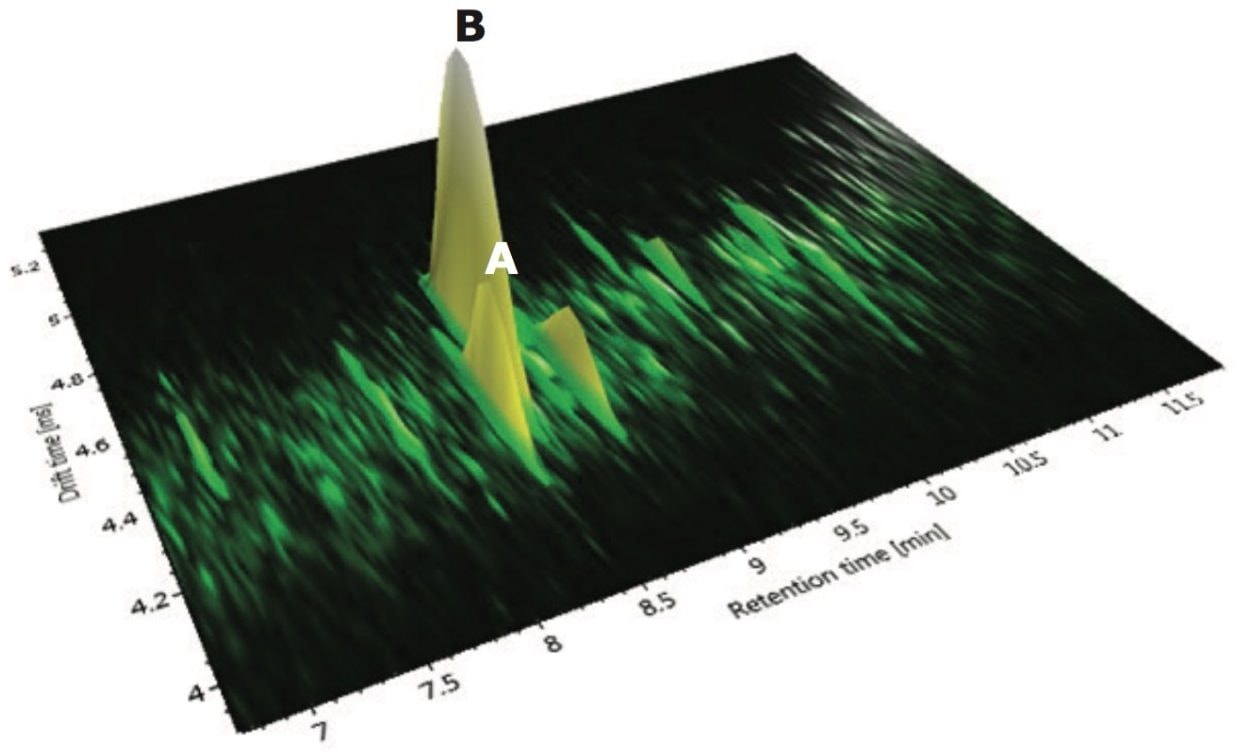
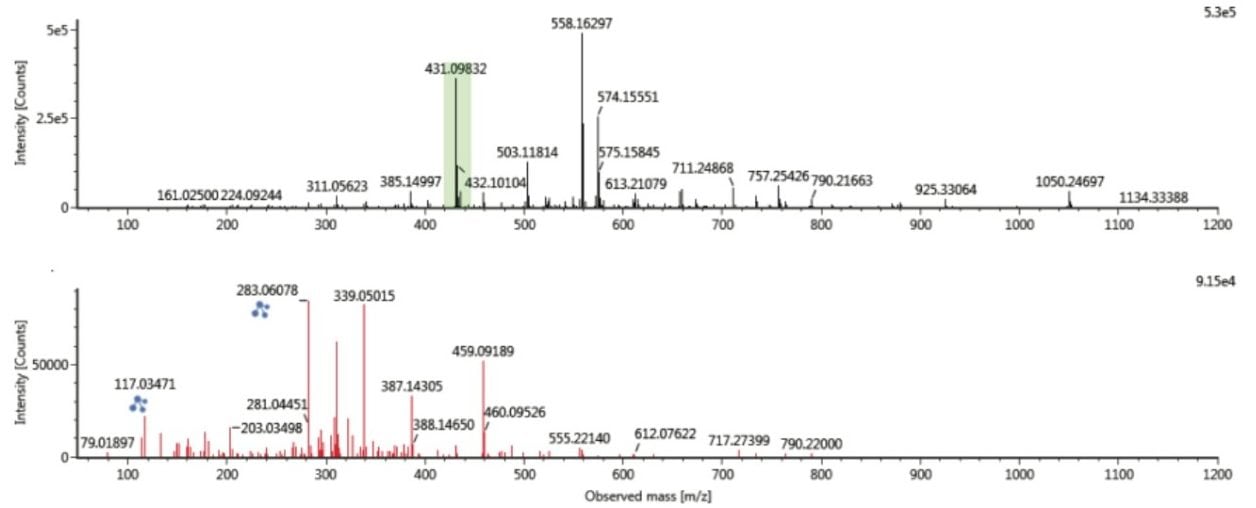
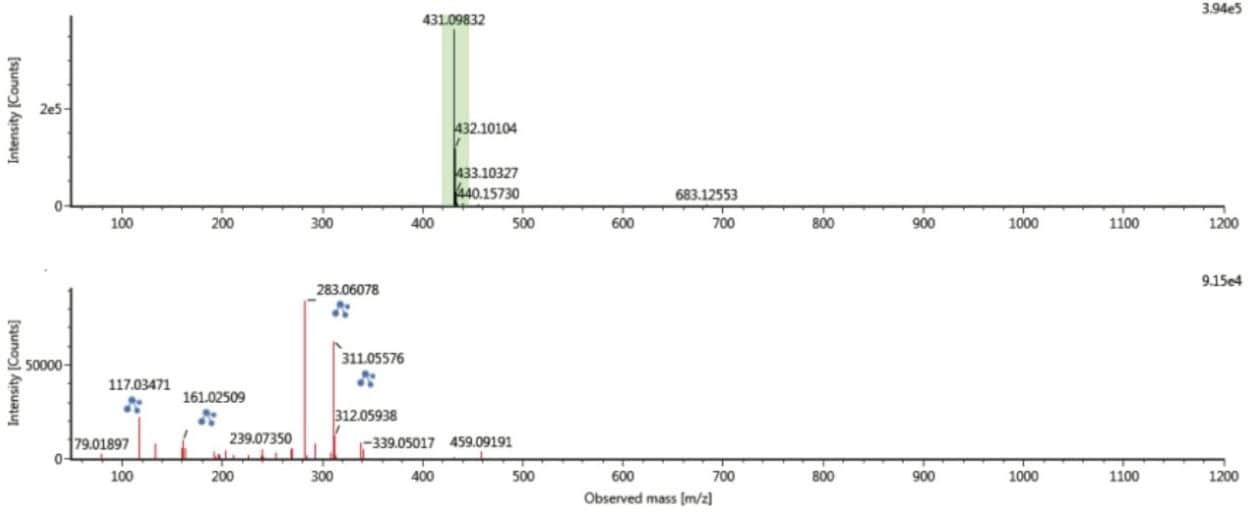
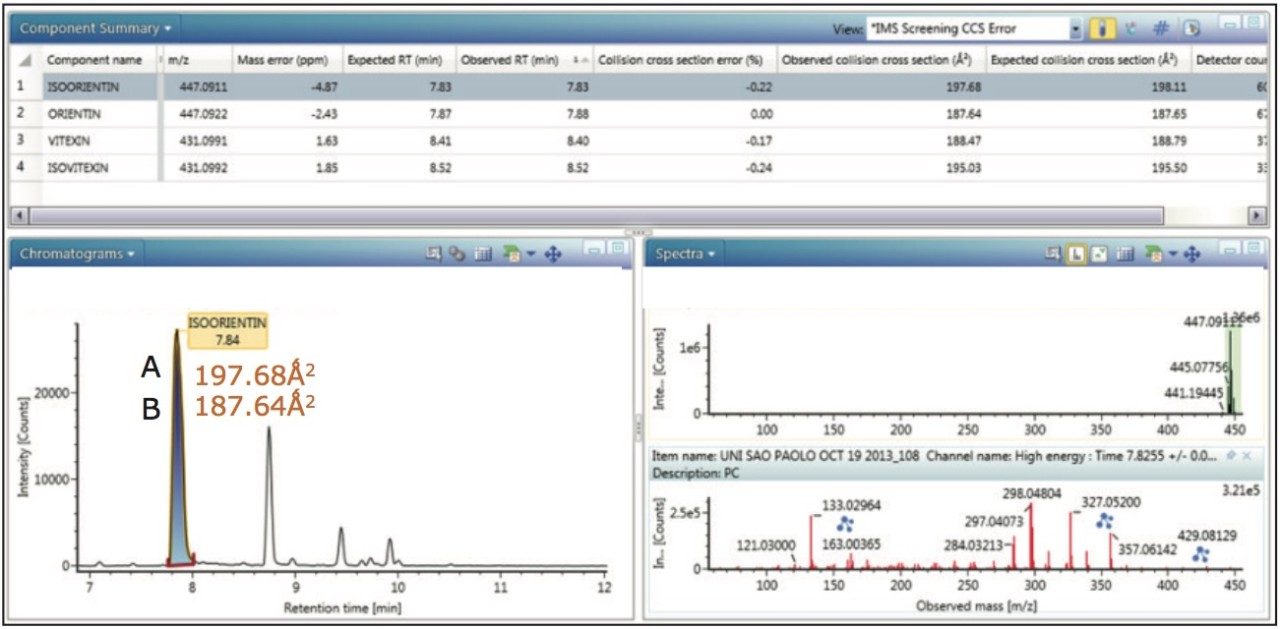
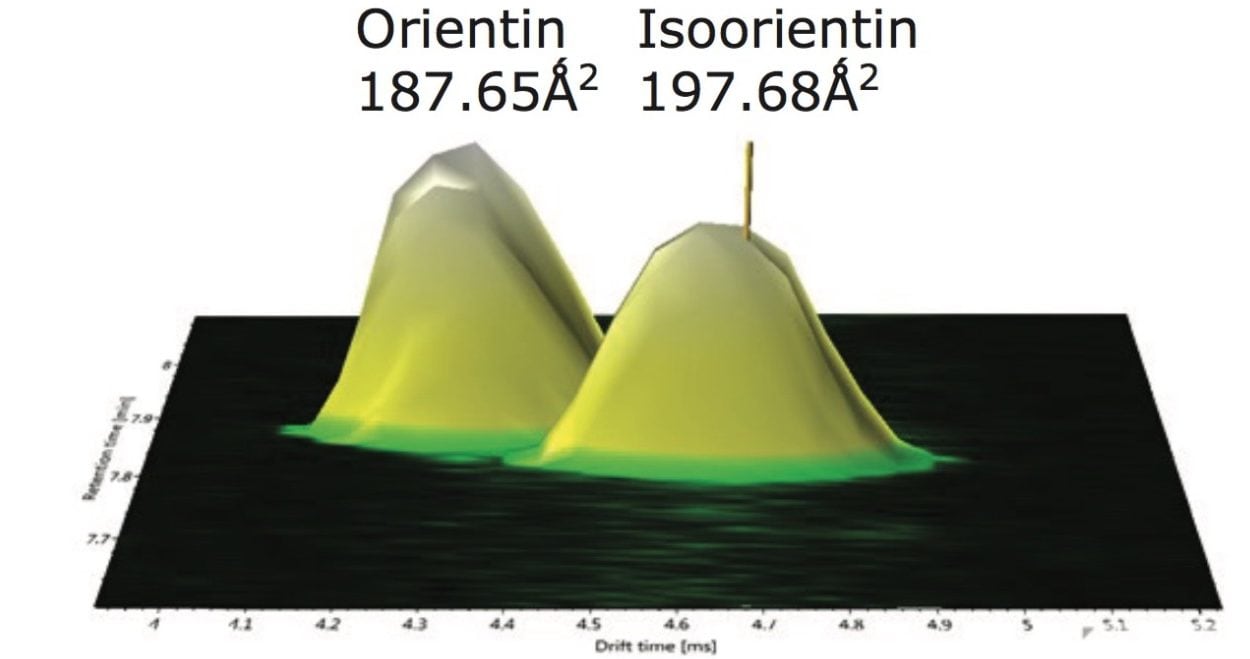
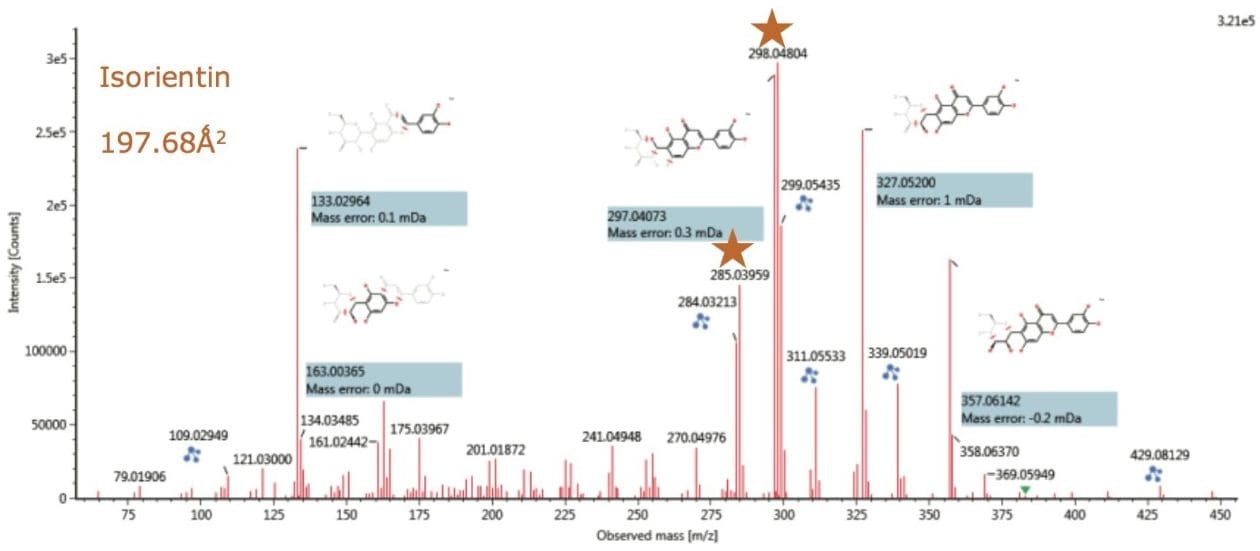
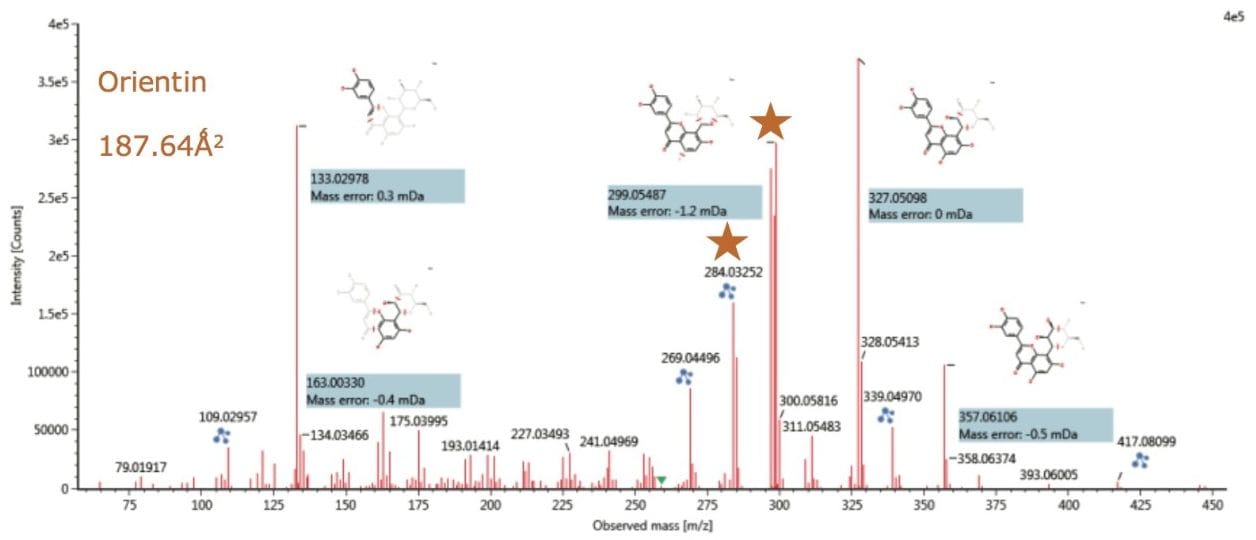
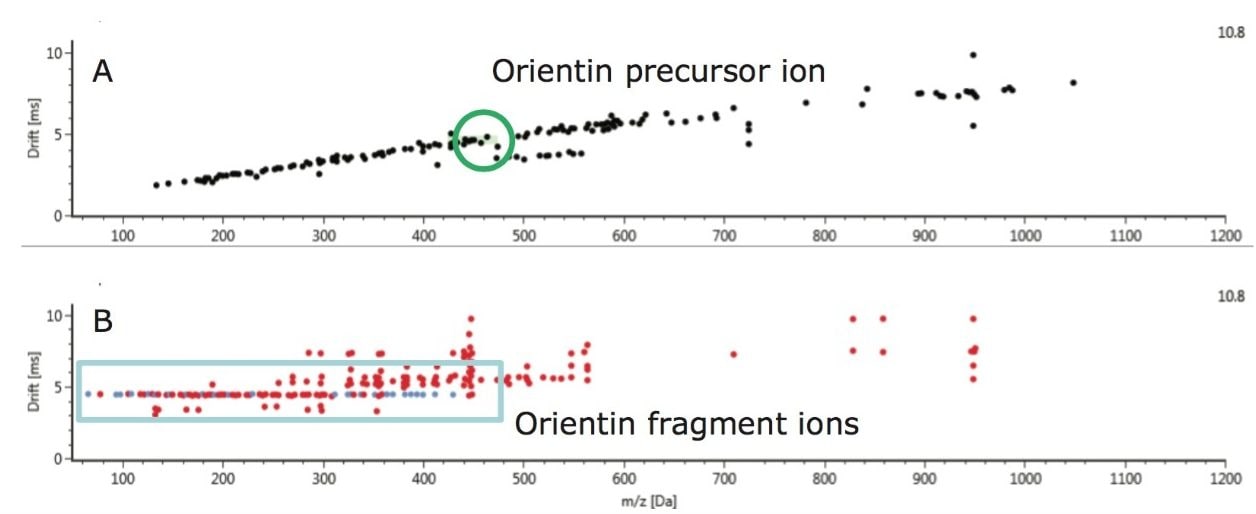
The sedative properties of the Passiflora species are related to its phytochemical makeup. It is therefore important that consumer products be authenticated with confidence, and that an accurate profile of the phytochemical composition is obtained. The use of HPLC-MS and HPLC-MS/MS based methods to profile flavonoids has become more routine. The use of flavonoid compounds as markers to profile a species or authenticate a consumer product is important and also a challenge due to sample complexity. Zucolotto et. al.,4 performed an analysis of C-glycosyl flavonoids from the South American Passiflora species, where vitexin was not identified in Passiflora edulis, as was the case for Pereira et. al.5 However utilizing UPLC and time-of-flight (Tof) MS, the presence of vitexin in P.alata was confirmed.6 Analysis of such complex samples can be difficult when the sample is comprised of isomers. Subtle changes in chromatography resulting from the sample matrix, column loading, and chromatographic conditions can result in the coelution of isomers. Even using mass spectrometry alone, with MS/MS or CID, it is difficult to determine true identification, especially when the isomers produce the same fragment or product ions. However Pereira et. al. reported distinctive fragmentation patterns produced for 6-C and 8C glycocides,7 while March et. al.8 further confirmed these observations. Since the phytochemical makeup can affect biological properties, further advances in analytical techniques to profile flavonoids could impact the design of functional food products by providing additional information about their health and safety benefits, as well as improved taste.
In this application note, we investigate the use of UPLC-IM-MS as a route to specific and unambiguous identification of flavonoid isomers, as this technique offers some unique advantages to profiling complex mixtures. It is a combination of high resolution mass spectrometry and high efficiency ion mobility based measurements and UPLC separations. Ion mobility is a rapid orthogonal gas separation phase technique that allows another dimension of separation to be obtained within an LC timeframe. Compounds can be differentiated based on size, shape, and charge.