• Application Note

Lipid Visualization and Identification Through Collisional Cross Section Aided Correlation of MS Imaging and Ex Situ MS Data for MS-MS Identification

Lipid Visualization and Identification Through Collisional Cross Section Aided Correlation of MS Imaging and Ex Situ MS Data for MS-MS Identification

  • Mark Towers
  • Emmanuelle Claude
  • Waters Corporation

For research use only. Not for use in diagnostic procedures.

This is an Application Brief and does not contain a detailed Experimental section.

Abstract

This application brief demonstrates how collisional cross section (CCS) areas can be utilized to correlate MS imaging data with ex situ MS data followed by MS-MS identification.

Benefits

CCS areas used to compare multiple datasets for increased lipid identification.

Introduction

Mass spectrometry (MS) imaging is rapidly becoming an established technique within lipidomics research. Using MSI, a broad range and number of lipid species can be visualized within a tissue section. However, subsequent identification of lipids can be particularly challenging due to the large number of isobaric or near isobaric lipid species.

Lipids can be identified by extracting them from the same, or a consecutive, tissue section that was used for MS imaging analysis and subsequently performing MS-MS experiments on those extracted lipids. However, when correlating MS imaging and ex situ MS data, definitive molecular identifications can be complicated due to the lack of certainty that the lipids extracted and identified, relate to the m/z peaks seen in the MS imaging data. This can be especially challenging when relying on accurate mass alone to identify an extracted lipid species.

Here, we propose that the CCS area of a peak of interest can be used as an additional qualifying factor to ensure that the peaks identified in the two data sets represent the same molecular species.

Results and Discussion

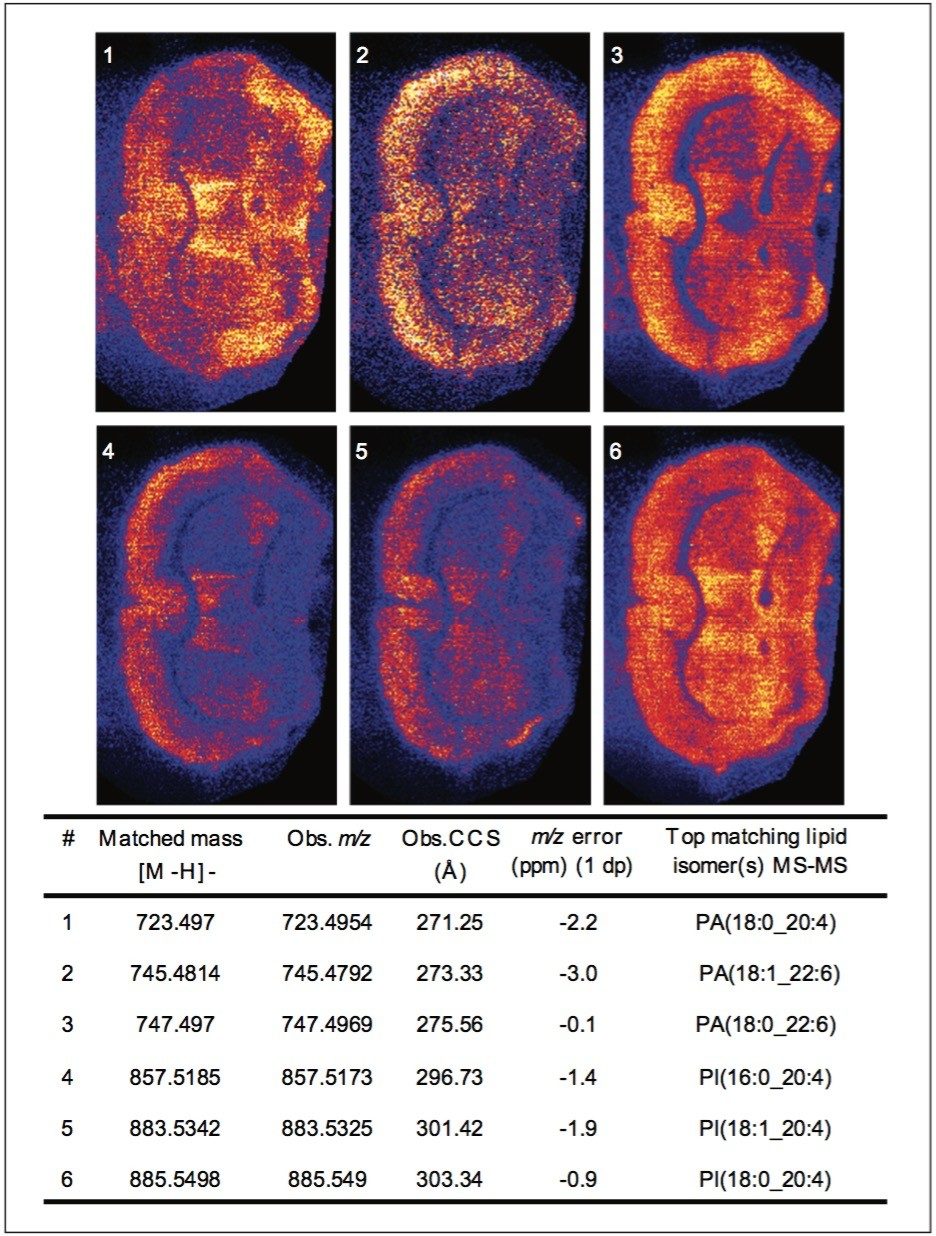
This study shows how CCS areas can be used as an additional point of reference to add confidence to the correlation between a MS imaging data set (collected using MALDI), and the subsequent molecular identifications by MS-MS.

The ion mobility cell of the SYNAPT G2-Si HDMS Mass Spectrometer can be easily calibrated via IntelliStart which automatically calculates the necessary calibration constants. For the calibration of the system poly-alanine was deposited on a MALDI target plate, mixed with the negative mode matrix 9-aminoacridine (9-AA).

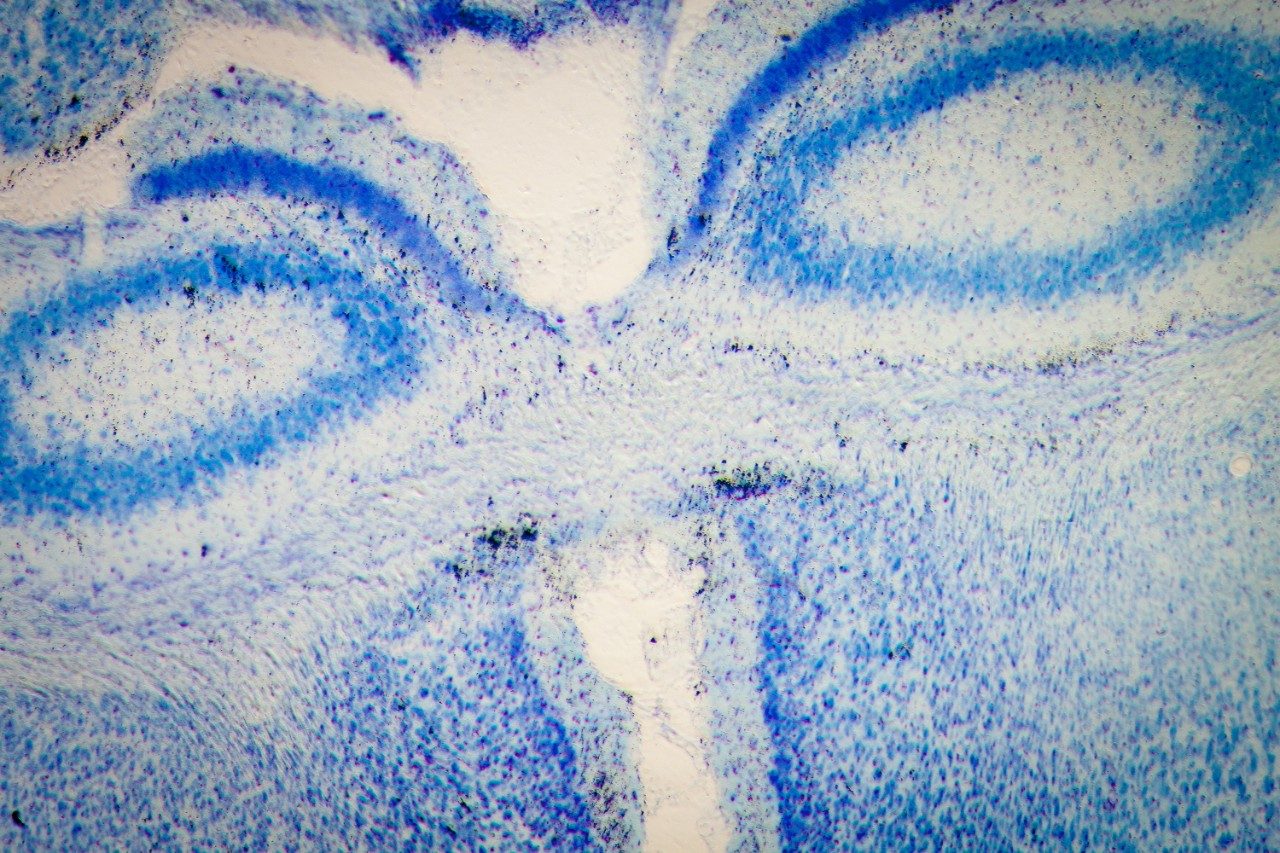
For the MS imaging experiment, a thin section of mouse brain was produced using a cryotome and deposited on a non-conductive glass slide. The 9-AA matrix was applied evenly to the sample by spray coating. The MS imaging data was acquired at a spatial resolution of 45 μm in negative ion mode across a mass range of m/z 50-1,150, utilising TriWave ion guide optics. This acquisition mode can separate ions according to their ionic mobility in the gas phase. To maintain high accurate mass performance, an external lock mass was used. The MS imaging dataset was subsequently processed using High Definition Imaging (HDI) Software v1.3 for detailed image analysis. Lipid peaks present in the imaging data were compared to the Lipid Maps data base (www.lipidmaps.org). In this case, 168 lipid candidates were identified based on mass accuracy better than +/-3 ppm. The CCS areas of the lipid candidates were calculated using the polyalanine calibration constants.

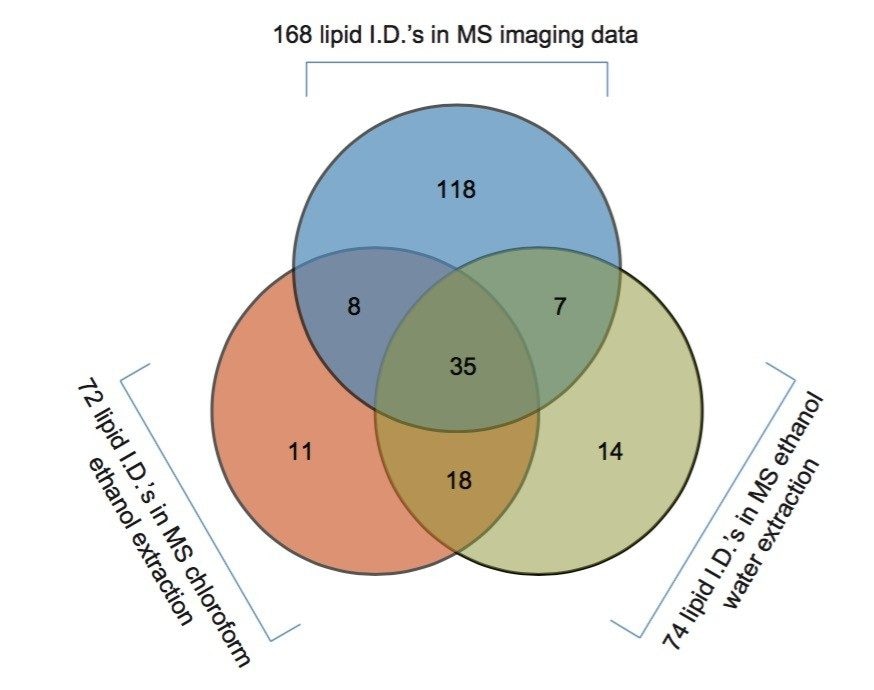
Lipids were extracted from two consecutive tissue sections by carefully depositing droplets of a solvent mixture onto the tissue section. Then, the extracted lipids were withdrawn by removing the extraction solvent. A 2:1 chloroform:ethanol solvent mixture was used for lipid extraction on one of the tissue section, while 4:1 ethanol:water was used on the second serial tissue section to be consistent with the solvent mixture used in the MS imaging experiment. It also offered a more complete picture of the lipids characterizing the tissue section.

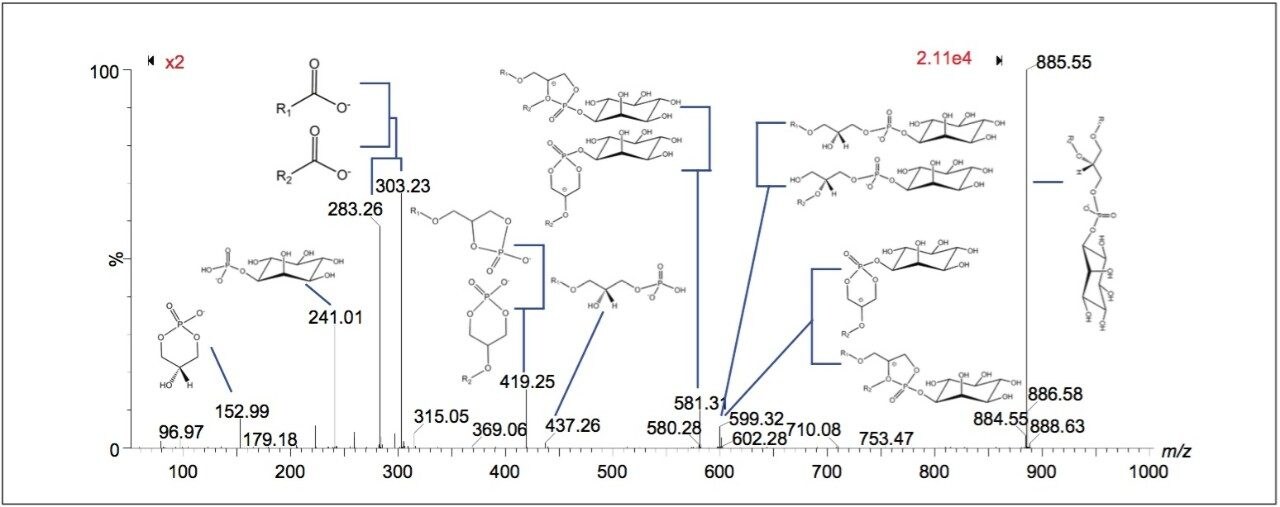
The two lipid extracts were spotted separately onto a standard MALDI target plate using 9-AA as the matrix. After MS analysis of each lipid extract, the peaks present were compared to the lipid maps database and the CCS areas calculated. The resulting lipid candidate lists were then compared to the list of 168 lipid candidates from the MALDI MS imaging dataset. The CCS areas of the peaks were cross validated (+/-0.5%) between the three datasets. The average CCS difference for the matches was found to be +/- 0.11%. 50 candidate lipid peaks were identified as being common to the MALDI imaging data set and one of the two lipid extract MS datasets (Figure 1).

Figure 1. Graphical representation of the results of a database search on lipids identified by MALDI imaging and by MALDI MS of extracted lipids using two different extraction solvents, showing the number of peaks unique and common to both data sets.

Peaks indicated to be possible glycerophospholipids, were selected for MS-MS measurement by collision-induced dissociation (CID). In total, 34 of 36 potential glycerophospholipid species were successfully identified. Although it was possible to distinguish the head group and the length of the fatty acid chains, it was not possible to determine the order of the chains (sn1/sn2) due to the pattern of fragmentation in negative mode. Figure 2 shows a subset of six ion images with the corresponding MS-MS identification based on mass accuracy and fragmentation information. Figure 3 shows an example of a MS-MS spectrum typically obtained for a glycerophospholipid by CID in negative mode. 18 fragment peaks matched the 21 possible peaks listed in the Lipid Maps database for phosphatidylinositol (PI) (18:0_20:4). Annotations show the possible structures of the intense fragment peaks.

Figure 2. Example of a subset of six peaks identified by MS-MS with the corresponding MS ion images assigned using accurate mass and CCA area.
Figure 3. MS-MS spectrum, identifying the glycerophospholipid at m/z 885.549 (CCS 303.34Å) to be phosphatidylinositol (PI) (18:0_20:4).

Conclusion

Collisional cross section (CCS) areas can be utilized as an additional chemical property to aid in the comparison of datasets. This is particularly true when analyzing samples that may contain a large number of isobaric or near isobaric species. The use of CCS areas provided an additional level of confidence regarding the molecular identification. It supplemented and confirmed the results obtained from the accurate mass analysis, and let to a more definitive identification of the lipid species of interest.

720005354, April 2015

Voltar ao início Voltar ao início