• Application Note

Simultaneous Determination of Molecular Size, Concentration, and Impurity Composition of Biotherapeutics with SEC and the Biopharmaceutical Platform Solution with UNIFI

Simultaneous Determination of Molecular Size, Concentration, and Impurity Composition of Biotherapeutics with SEC and the Biopharmaceutical Platform Solution with UNIFI

  • Robert E. Birdsall
  • Thomas E. Wheat
  • Henry Shion
  • Weibin Chen
  • Waters Corporation

Abstract

The Waters Biopharmaceutical Platform solution with UNIFI is developed to streamline the analytical workflow to increase the productivity in the characterization of biotherapeutic samples. Its ability to perform size exclusion chromatography (SEC) using conditions that minimally perturb aggregate composition make its use ideal in the assessment and communication of multiple attributes of biotherapeutics such as size, aggregate composition, and concentration. Through the use of calibrated standards, tools within the UNIFI Scientific Information System can simultaneously determine the molecular size (apparent molecular weight) and the concentration of chromatographically resolved species in a biotherapeutic sample in the same analysis.

The objective of this application note is to demonstrate the ability to determine molecular weight and amount of the constituents of an antibody sample using UNIFI informatics. A purified antibody from human serum was used as a model protein to test the application.

Benefits

  • Efficient and integrated workflow for running batched samples to maximize analytical information content of biotherapeutics.
  • Increased productivity through the automation of an analytical workflow including data acquisition, processing, and reporting.
  • Increased productivity through automated assessment of protein aggregates.

Introduction

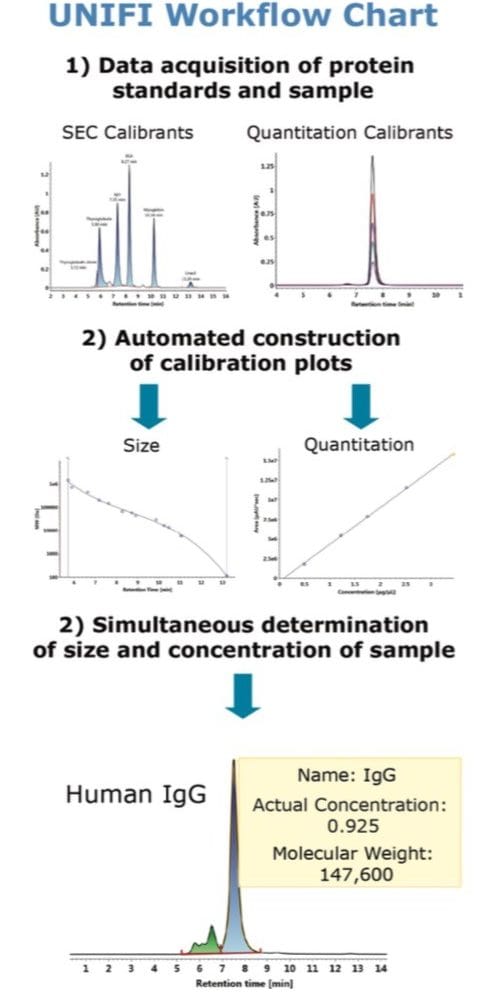
Size exclusion chromatography (SEC) is often used to assess the size distribution of molecular species for therapeutic proteins in a solution (e.g. protein clips, aggregates, etc.). The non-denaturing buffers commonly employed in SEC allow for the characterization of proteins in their native state. In addition to measuring molecular size, peak areas from SEC can be readily used in the relative and absolute quantitation of biological samples for increased productivity. As such, this technique has been particularly useful in the biotechnology industry for detecting and quantifying protein aggregation of biotherapeutics.

Protein aggregation in biotherapeutics have been linked to potential loss of therapeutic efficacy as well as unwanted immunogenic responses.1,2 Controlling factors that contribute to aggregate formation, for example, protein misfolding during expression stages,3 protein denaturation during purification processes,1 and high protein concentration during formulation,4 has been an area of continuing interest in the pharmaceutical industry.

Increasing demand from regulatory bodies to provide detailed information about the quantity and nature of aggregates in biotherapeutics, combined with rising development costs and a demanding work environment, require cost-effective solutions that have minimum impact on productivity. Efficient workflows that seamlessly combine characterization and quantitation information for biotherapeutics are highly desirable. 

Experimental

LC conditions

LC system:

ACQUITY UPLC H-Class System with Auto•Blend Plus Technology

Detector:

ACQUITY UPLC TUV

Absorption Wavelength:

220 nm

Vials:

Total recovery vial: 12 x 32 mm glass, screw neck, cap, nonslit (p/n 6000000750cv)

Column:

ACQUITY UPLC Protein BEH SEC, 200Å, 1.7-μm, 4.6 x 150 mm (p/n 186005225)

Column temp.:

25 °C

Sample temp.:

4 °C

Injection vol.:

2 μL

Flow rate:

0.150 mL/min

Mobile phase A:

100 mM sodium phosphate monobasic monohydrate (NaH2PO4)

Mobile phase B:

100 mM sodium phosphate dibasic (Na2HPO4)

Mobile phase C:

1000 mM NaCl

Mobile phase D:

18 MΩ H2O

Autoblend Plus Method:

Isocratic (150 mM NaCl in 20 mM phosphate buffer; pH 7.4)

Informatics for data collection and processing

UNIFI Scientific Information System, v1.6

The Waters Biopharmaceutical Platform solution with UNIFI is developed to streamline the analytical workflow to increase the productivity in the characterization of biotherapeutic samples. The ability to perform SEC using conditions that minimally perturb aggregate composition make it ideal in the assessment and communication of multiple attributes of biotherapeutics such as size, aggregate composition, and concentration. Through the use of calibrated standards, tools within the UNIFI Scientific Information System can simultaneously determine the molecular size (apparent molecular weight) and the concentration of chromatographically resolved species in a biotherapeutic sample in the same analysis. 

UNIFI workflow chart

The objective of this application note is to demonstrate the ability to determine molecular weight and amount of the constituents of an antibody sample using UNIFI informatics. A purified antibody from human serum was used as a model protein to test the application.

Protocol

A Waters ACQUITY UPLC Protein BEH SEC Column was conditioned as outlined by the manufacturer. Waters BEH200 SEC protein standards (p/n 186006518) and BEH125 SEC protein standards (p/n 186006519) were prepared in 1 mL and 0.2 mL of 18 MΩ water, respectively. Apoferritin (p/n A3660), β-amylase (p/n A8781), carbonic anhydrase (p/n C7025), insulin (p/n I0516), sodium phosphate monobasic monohydrate (p/n S3522), sodium phosphate dibasic (p/n S5136), and sodium chloride (S5886) were purchased from Sigma Aldrich. The Waters Glycoworks control standard (p/n 186007033; purified human IgG) was used as an “unknown” and prepared at a concentration of 1 µg/µL as per the labeled amount using 18 MΩ water. Apoferritin, β-amylase, carbonic anhydrase, and insulin were prepared at concentrations of 10 µg/µL, 2.9 µg/µL, 1.5 µg/µL, and 5.0 µg/µL, respectively. The Waters mAb mass check standard (p/n 186006552) used for quantification was prepared at concentrations of 0.49 µg/µL, 1.22 µg/µL, 1.74 µg/µL, 2.51 µg/µL, and 3.46 µg/µL in 18 MΩ water.

Results and Discussion

Integrated informatics tools for the construction of calibration plots

Size exclusion chromatography is often employed by the pharmaceutical industry for the assessment of aggregate content in biotherapeutic samples. In principle, the elution time of a protein in a SEC separation is determined by how much of the intra-particle pore volume is accessible to the protein.6 In practice, this separation mechanism prescribes that protein species will elute in order of decreasing hydrodynamic radius. This chromatographic behavior is illustrated by the lower left panel of Figure 1, where Waters SEC protein standards (calibrants) are separated using an ACQUITY UPLC Protein BEH SEC Column (200Å, 1.7-µm, 4.6 x 150 mm). 

Using the known molecular weight of the calibrants defined in the component manager as shown in the top panel of Figure 1, the built-in UNIFI informatics tool automatically constructs a size calibration plot (log  MW vs. RT) for the standards as shown in the lower right panel of Figure 1. Proteins used in this optimized size calibration plot include thyroglobulin dimer, thyroglobulin, apoferritin, β-amylase, bovine serum albumin, ovalbumin, carbonic anhydrase, myoglobin, ribonuclease A, insulin, and uracil. The calibration plot can be constructed using the logarithmic scale of MW of protein standards as y-axis plotted against either the elution time or the elution volume (x-axis). The data is automatically fitted with a linear or a higher-order polynomial equation to acquire a calibration curve as shown in Figure 1. 

A separation calibration plot
Figure 1. Waters BEH200 SEC protein standards (p/n 186006518) are separated (bottom left panel) using an ACQUITY UPLC Protein BEH SEC Column (p/n186005225). A separation calibration plot of log MW versus retention time (lower right panel) is automatically constructed using UNIFI informatics tools from a set of defined protein standards (top panel).

For disparate measurements such as apparent molecular weight (elution time vs. molecular weight) and concentration (area vs. amount), individual assays that generate targeted data sets are usually required. UNIFI informatics allows for the incorporation of multiple calibration plots that can be applied to a single data stream for the measurement of such dissimilar attributes as size and concentration. 

Figure 2 illustrates how UNIFI constructs a concentration calibration curve in the same analysis as the apparent molecular weight measurement using a Waters mAb mass check standard as a calibrant for proof of principle. Using the mAb standard, 200 µL of 18MΩ water was added to the 1 mg of lyophilized protein to generate a stock calibrant solution with a concentration of 5.00 µg/µL. From the stock calibrant, five standard samples were prepared at concentrations of 0.493 µg/µL, 1.22 µg/µL, 1.74 µg/µL, 2.51 µg/µL, and 3.46 µg/µL. Three replicates of the five standard samples were performed in a serial fashion with a constant volume (2 µL) injected on an ACQUITY UPLC Protein BEH SEC Column (200Å, 1.7-µm, 4.6 x 150 mm). Using the defined concentrations as indicated by their concentration level in the component summary window of Figure 2, UNIFI automatically constructs the concentration calibration plot as shown in the bottom right panel of Figure 2.  

calibration plot of peak area versus sample concentration
Figure 2. The Waters mAb mass check standard was injected at five different concentration levels (lower left panel). Using the supplied concentrations as indicated by their level in the component summary panel, UNFI informatics automatically constructs a calibration plot of peak area versus sample concentration (bottom right panel).

The ability to automate the construction of multiple calibration plots and apply them in a single data stream to discern uniquely disparate critical quality attributes makes the Waters Biopharmaceutical Platform Solution with UNIFI a preferred system for increasing productivity during the method development process.

Simultaneous determination of apparent molecular weight and concentration of purified human IgG from a single injection

The experimental results for the calibration plots show that as an integrated platform, UNIFI is fully capable of determining the apparent molecular weight and concentration of biotherapeutics analyzed in the same sample set as the protein standards. A purified human IgG sample (p/n 186007033) was analyzed using the method to demonstrate the capability of the platform to generate such information for an “unknown” sample. The lyophilized sample was reconstituted in 100 µL of 18 MΩ water to a concentration of 1 µg/µL. Three replicate injections of the sample were analyzed within the same sample set of the calibration standards as shown in the bottom left pane of Figure 3. For each run, 2 µL of the sample was injected.  

UNIFI reports the concentration, amount, and molecular weight of a human IgG
Figure 3. UNIFI reports the concentration, amount, and molecular weight (top pane) of a human IgG parent peak (lower left pane) using the calibration plots constructed from reference standards (lower right pane). 

At the end of the analysis workflow, UNIFI automatically reports the calculated concentration (µg/µL),  amount (µg), and molecular weight (Da) of the parent peak or monomer peak of the human IgG sample as shown in the upper component summary pane of Figure 3. Using the data from the component summary pane, the mean concentration and apparent molecular weight of the human IgG parent peak were calculated to be 0.93 µg/µL ± 0.01 µg/µL and 147,600 Da ± 100 Da, respectively. The ability to automatically determine apparent molecular weight and concentration of a sample within a single injection confirms that Waters Biopharmaceutical Platform with UNIFI is an integrated solution for increasing productivity and maximizing characterization content for the analysis of biotherapeutics.

Bioinformatics tools for automated reporting of SEC characterization of biotherapeutics

UNIFI integrates strong reporting functionalities with the ability to generate meaningful analytical measurements to form a seamless informatics workflow. These informatics tools allow for custom reports to be automatically generated for the efficient communication and cataloging of analytical results. Report templates can be readily constructed and customized for assessment of analysis results.

Figure 4 is an example of a report template designed for SEC characterization of biotherapeutics such as monoclonal antibodies. Using the results for the purified IgG sample from Figure 3, a summary report on the apparent molecular weight, concentration, and relative amount of the parent peak (monomer) and corresponding statistical evaluation (e.g. mean and % R.S.D) is generated after data acquisition and processing. In addition, pertinent biotherapeutic information on the level of relative aggregation in each sample is also assessed and reported as a percentage of monomer and the percentage of higher molecular weight (HMW) species (collectively).  

A report template example created by UNIFI
Figure 4. A report template example created by UNIFI. The calculated molecular weight concentration, amount, as well as the relative higher molecular weight species content is shown in the report for the IgG sample.

The flexibility to design custom report templates based on analysis needs makes the Biopharmaceutical Platform Solution with UNIFI a powerful integrated system for the acquisition, processing, and reporting of analysis results. 

Conclusion

Assessing and controlling aggregate content in therapeutic proteins is a critical component in the manufacturing process. Increasing sample complexity coupled with the rising research and development costs highlight the need for more efficient analytical methods that are readily deployable in therapeutic protein characterization. Waters’ Biopharmaceutical Platform Solution with UNIFI offers answers to these challenging problems. 

The efficient built-in workflow aided by the UNIFI’s data acquisition, processing, and reporting capabilities enable simultaneous determination and reporting of the apparent molecular weight, concentration, and aggregate composition of biotherapeutic proteins. This process, which is fully automated, makes the Biopharmaceutical Platform Solution with UNIFI ideal for increasing productivity through efficient method deployment for biotherapeutic characterization.

References

  1. Rosenberg, A. Effects of Protein Aggregates: An Immunologic Perspective. The AAPS Journal. 2006; 8 (3): E501-07.
  2. Cromwell, M., Hilario, E., Jacobson, F. Protein Aggregation and Bioprocessing. The AAPS Journal. 2006; 8(3): E572-79.
  3. Zhang et al. Protein aggregation during overexpression limited by peptide extensions with large net negative charge. Protein Expression Purification. 2004; 36(2): 207-216.
  4. Shire, S., Shahrokh, Z., Liu, J. Challenges in the Development of High Protein Concentration Formulations. Journal of Pharmaceutical Sciences. 2004; 93(6): 1390-1402.
  5. Hong, P., Fountain, K. Method Development for Size-Exclusion Chromatography of Monoclonal Antibodies and Higher Order Aggregates. 2011; 720004076en.
  6. Hong, P., Koza, S., Bouvier, E. A Review Size-Exclusion Chromatography for the Analysis of Protein Biotherapeutics and their Aggregates. Journal of Liquid Chromatography & Related Technologies. 35(20): 2923-2950.

720005025, April 2014

Voltar ao início Voltar ao início