• Application Note

Structural Confirmation of Polymeric Material Using MS/MS and Fragmentation Mechanisms

Structural Confirmation of Polymeric Material Using MS/MS and Fragmentation Mechanisms

  • Kirsten Craven
  • Michael McCullagh
  • Pascal Gerbaux
  • Julien DeWinter
  • Waters Corporation
  • University of Mons
Blue plastic polymer granules in hand

Abstract

This application note uses polylactide to demonstrate how MS/MS fragmentation patterns can be used to help determine the backbone architecture of a polymer.

Benefits

  • Rapid data collection
  • Exact mass elemental composition
  • Polymeric architecture confirmation

Introduction

Polymeric materials are abundant in modern society covering a broad range of applications in industries such as automobiles, textiles, packaging, medical, and pharmaceutical, to name a few. This increasing complexity in applications has driven the need to produce highly complex polymeric materials. Full characterization of a sample has become a vital part of the development process.

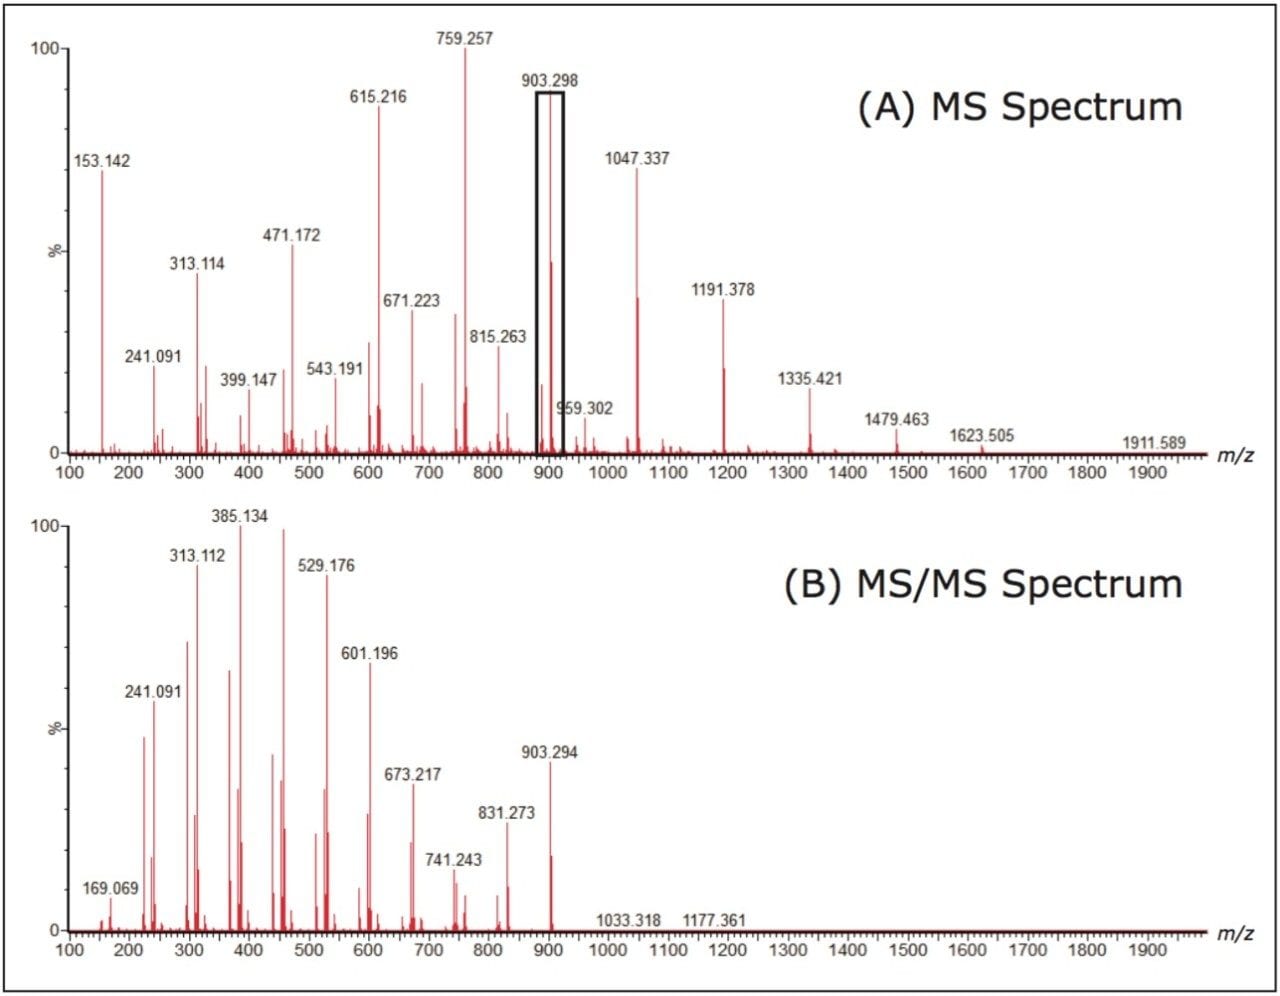
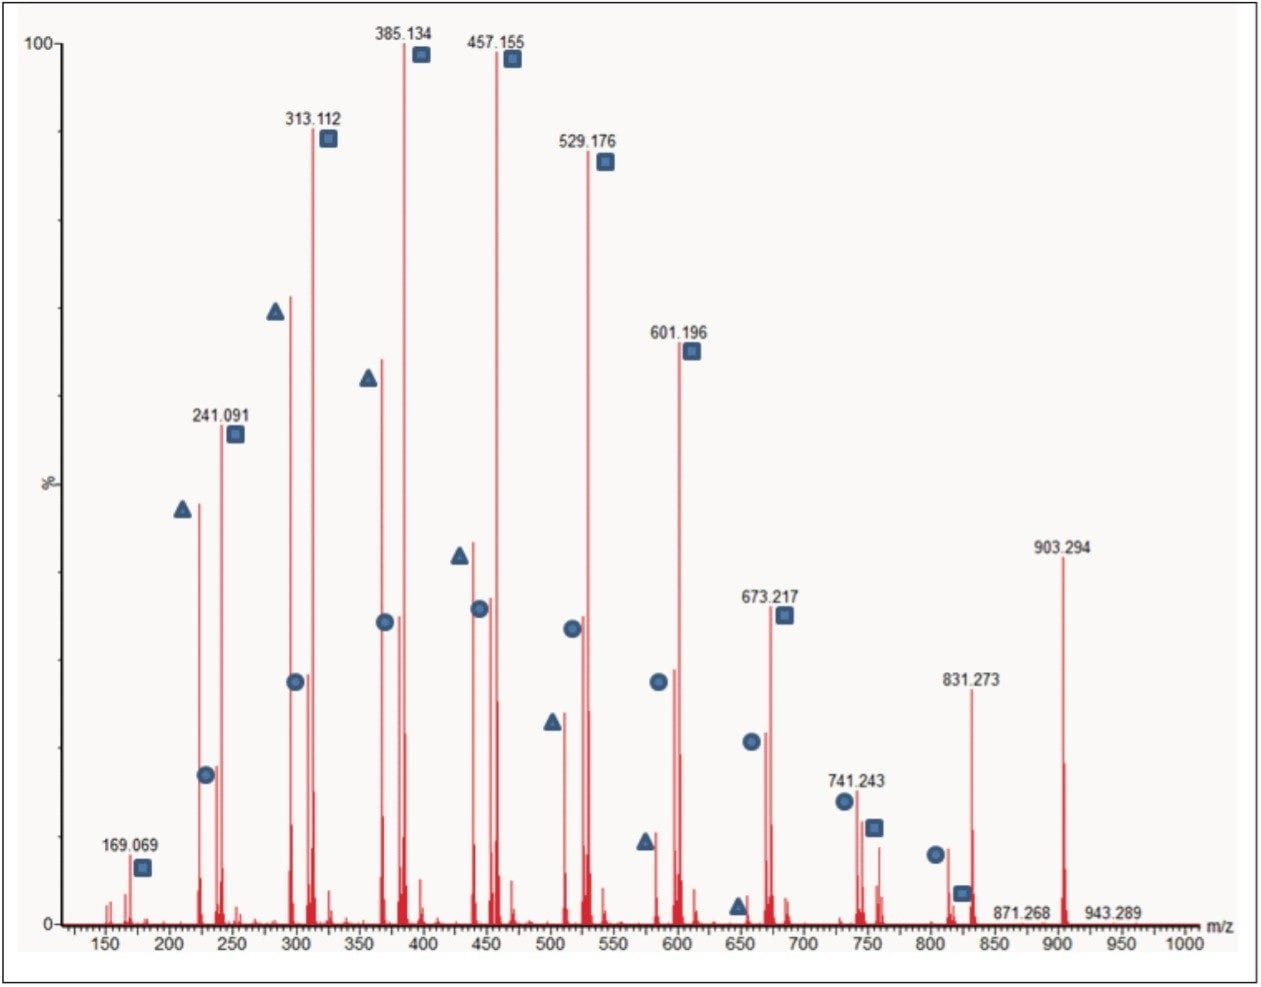
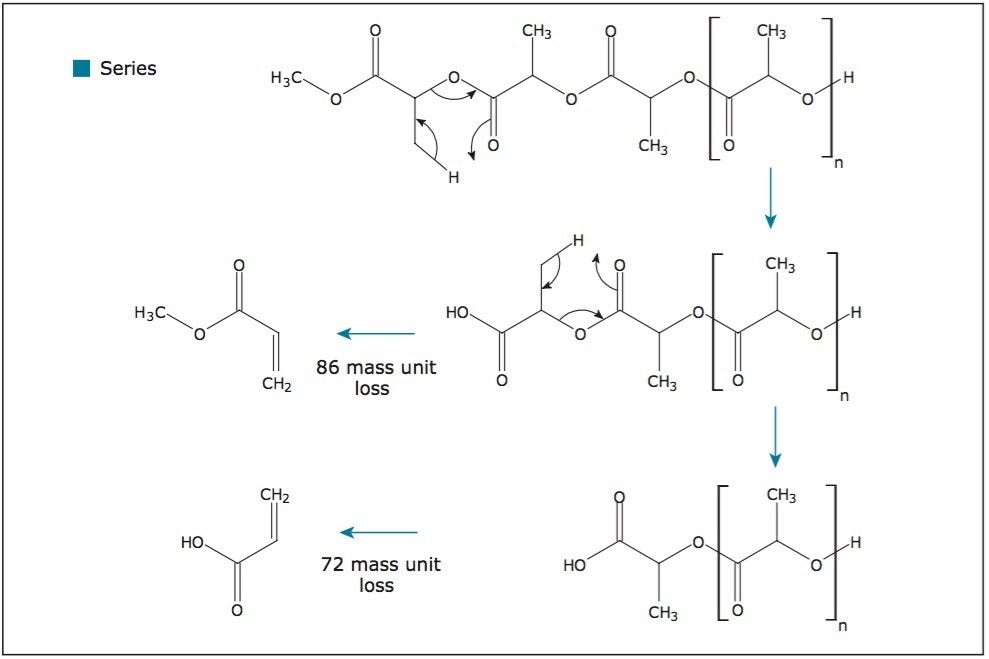
Mass spectrometry can be used to answer many questions regularly asked by polymer scientists, including identifying end groups, back bone architecture, and repeat unit chemistry. A single-stage mass spectrometry experiment can provide information about the molecular weight of polymers and polymeric dispersity. Performing a dual-stage mass spectrometry experiment (MS/MS) while inducing fragmentation provides an extra layer of information regarding the architecture of the polymer and more detail about the end groups.1

Confirming the architecture of a polymer is important because it impacts its physical properties, such as density, strength, viscosity, and glass transition temperature. The physical properties of a polymer directly affect its applications.

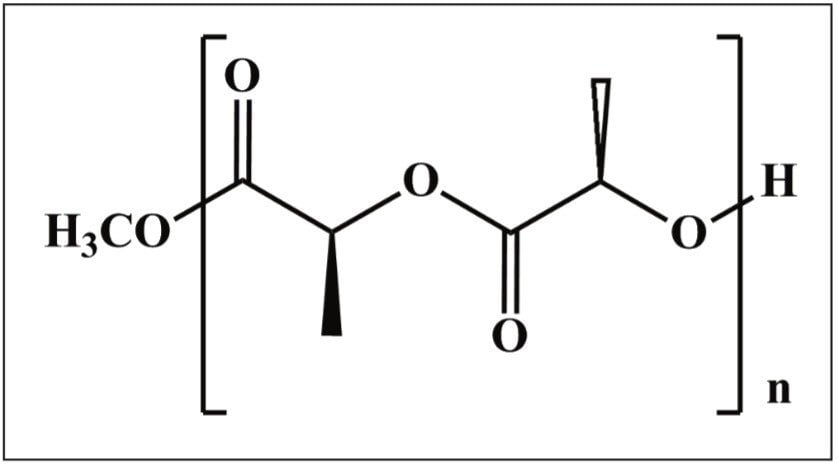
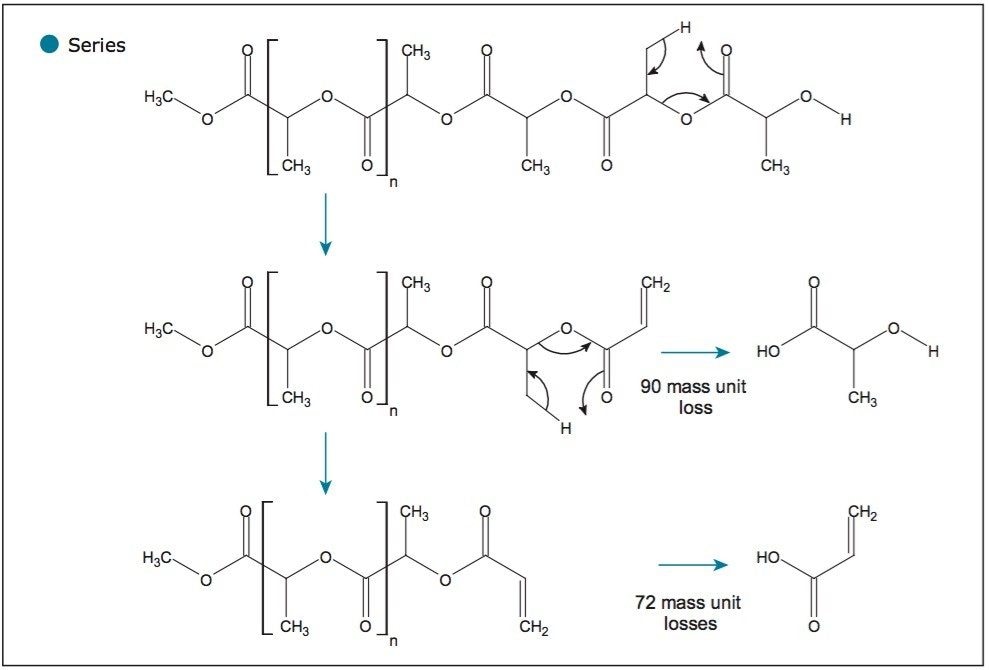
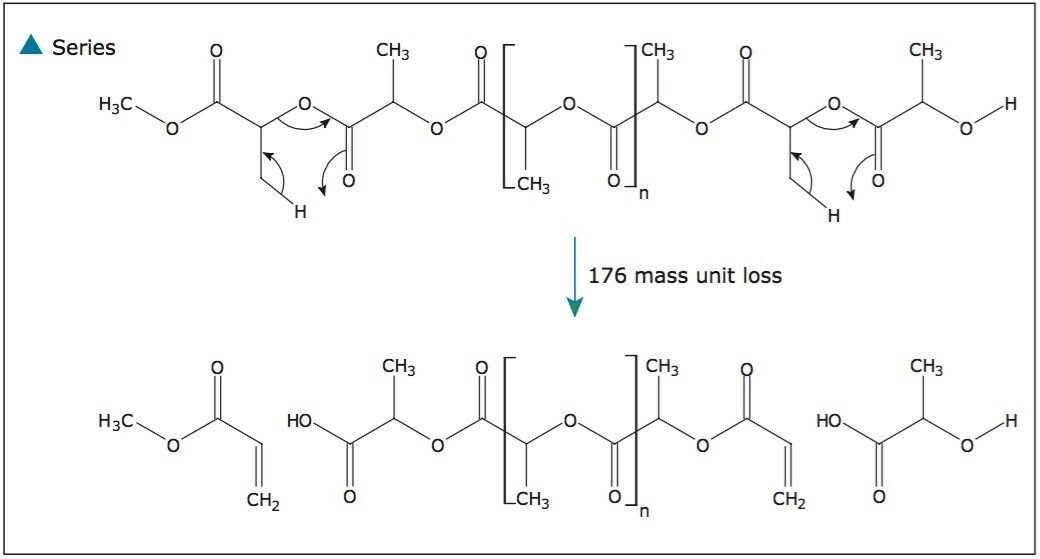
Polylactides have recently attracted increased attention from both academic and industrial researchers due to their bio-compatible and bio-degradable nature. This application note uses polylactide to demonstrate how MS/MS fragmentation patterns can be used to help determine the backbone architecture of a polymer.

Experimental

Sample Description

The sample was first dissolved in acetonitrile before further dilution and the addition of lithium chloride to produce the following:

90 ppm polylactide and 10 ppm lithium chloride (in acetonitrile).

MS conditions

Mass spectrometer:

Xevo G2-S Q-Tof

Ionization mode:

ESI positive

Infusion rate:

10 μL/min

Scan time:

1 s

Capillary voltage:

3.0 kV

Sample cone:

45 V

Extraction cone:

5.0 V

Source temp.:

120 °C

Desolvation temp.:

200 °C

Cone gas:

Nitrogen, 20 L/h

Desolvation gas:

Nitrogen, 800 L/h

LockSpray conditions

Compound:

Leucine enkephalin

Mass:

m/z 556.2771

Flow rate:

20 μL/min

Capillary voltage:

3 kV

Collision energy:

6.0 V

Results and Discussion

Figure 1 shows the structure of the polylactide repeat unit, which has a nominal mass of 144 Da, and the end groups for this sample. The first step in this experiment was to collect an MS spectrum, allowing the most appropriate ion to be selected for MS/MS analysis. The precursor ion selected was m/z 903. Both the MS and MS/MS spectra are shown in Figure 2.

Polylactide repeat unit and end groups
Figure 1. Polylactide repeat unit and end groups.
MS and MS/MS spectra
Figure 2. (a) MS spectrum of lithiated polylactide, the ion at m/z 903 has been highlighted, (b) MS/MS spectrum showing the fragment ions from the m/z 903 precursor ion.

Closer interpretation of the MS/MS spectrum shows three series of ions, each 72 mass units apart. Figure 3 shows each series labeled with a circle, a square, or a triangle. Understanding the fragmentation mechanisms that occur to create these ions is extremely important as it allows the scientist to determine the polymer architecture. The exact mass data that is generated can help guide this process by providing possible elemental compositions.

MS/MS spectrum of lithiated polylactide
Figure 3. MS/MS spectrum of lithiated polylactide. Three ion series have been identified and labeled with a circle, a square, or a triangle.

Figure 4 proposes a fragmentation mechanism responsible for the initial 86-mass unit loss and consecutive 72-mass unit losses (labeled with a square). This pattern is consistent with the loss of the initiating end group from a linear polylactide. This polymer was synthesized by ring opening polymerization using methanol as the initiator.

The fragmentation mechanism
Figure 4. The fragmentation mechanism responsible for the initial 86-mass unit loss and consecutive 72-mass unit losses.

Figure 5 shows a very similar fragmentation mechanism; however, this time the polymer is losing the terminating end group (ion series labeled with a circle). Again, this mechanism is consistent with a linear polymer. This is confirmed by a single 90-mass unit loss as a branched polymer would lose multiple 90-mass units. Finally, Figure 6 proposes two fragmentation mechanisms that are responsible for the series labeled with a triangle, which is caused by both end groups being lost.

The fragmentation mechanism
Figure 5. The fragmentation mechanism responsible for the initial 90-mass unit loss and consecutive 72-mass unit losses.
 The two fragmentation mechanisms
Figure 6. The two fragmentation mechanisms responsible for a total of 176 mass unit loss.

The fragmentation pattern that was observed is consistent with that published in scientific literature.2

Interpretation of the MS/MS results and an understanding of fragmentation pathways allow us to confirm that the sample is a linear polylactide. Knowing the architecture of the polymer is of great value. It can confirm the target compound has been synthesized, thereby determining if the product can be used for the desired application.

Conclusion

  • The Xevo G2-S Q-Tof was successfully used to collect MS and MS/MS data on a polylactide sample.
  • This information was used to propose the architecture of a polymeric material. A measurement that is vital to the industry to confirm the target compound has been produced.
  • This application note demonstrates an approach that is appropriate for many polymer systems.

References

  1. Wesdemiotis C, Solak N, Polce MJ, Dabney DE, Chaicharoen K, Katzenmeyer B. Mass Spectrometry Reviews DOI 10.1002/mas.2028
  2. De Winter J, Lemaur V, Marsal P, Coulembier O, Cornil J, Dubois P, Gerbaux P. J Am Soc Mass Spectrom. 2010; 21: 115-1168.

720004606, February 2013

Voltar ao início Voltar ao início