• Application Note

Simultaneous in vivo Quantification and Metabolite Identification of Plasma Samples Using High Resolution QTof and Routine MSE Data Analysis

Simultaneous in vivo Quantification and Metabolite Identification of Plasma Samples Using High Resolution QTof and Routine MSE Data Analysis

  • Mark D. Wrona
  • Paul D. Rainville
  • Eric Langlois
  • Nigel Ewing
  • Julie Laterreur
  • Waters Corporation
  • Vertex Biopharmaceuticals
Tubes of blood plasma samples in rack

Abstract

This application note summarizes the collaboration between Vertex and Waters to test and demonstrate a quan/qual workflow to determine robustness and reliability of QTof measurements, and compare them against the gold-standard tandem quadrupole workflows.

Benefits

  • Selectivity and specificity of accurate mass for quantification
  • Discovery bioanalysis
  • Quan/Qual
  • Metabolite identification

Introduction

QTof mass spectrometry platforms have long been used in DMPK groups to understand complex metabolic pathways and provide support for key activities, including metabolic hotspot screening, generating preclinical animal and in vitro in vivo correlation (IVIVC) information, supporting first-in-man dosing, and providing support for regulatory submission. Advances in sensitivity, detector linear response, and robustness have opened up the possibility for QTof MS platforms to be a viable alternative for use in bioanalysis laboratories with traditional use tandem quadrupole MS platforms (also referred to as triple quadrupole, or QQQ).

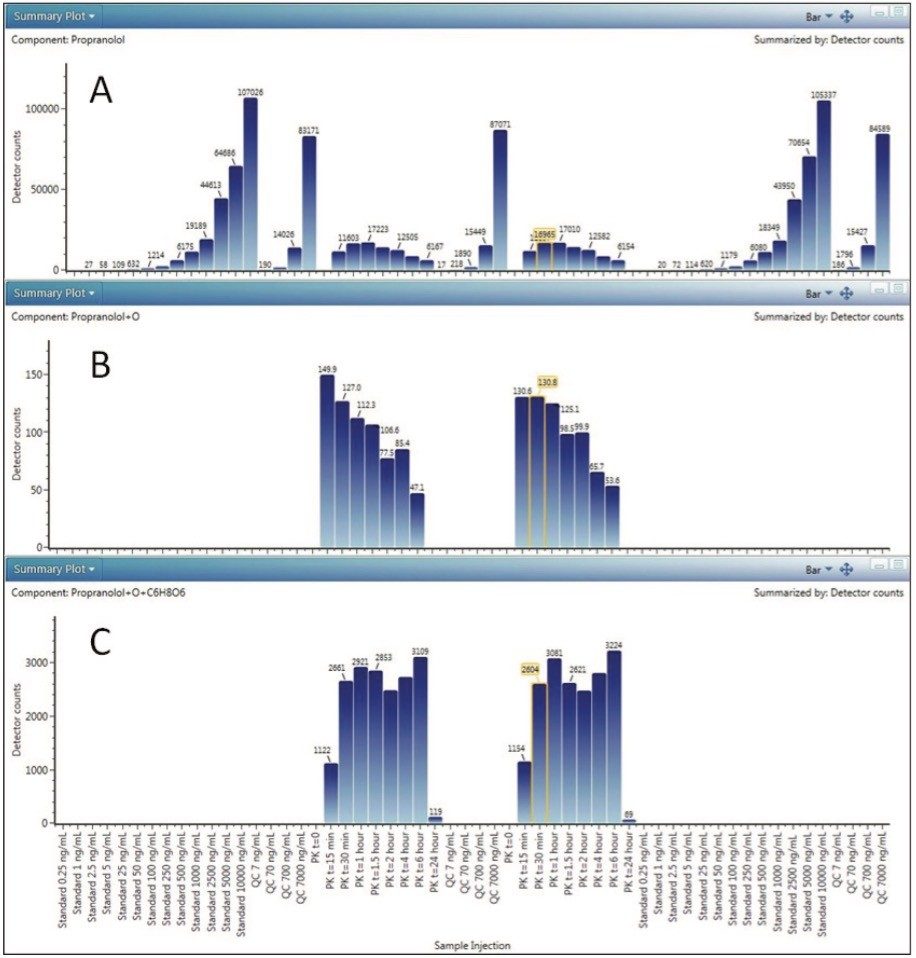
There is strong interest to develop workflows that not only provide robust and accurate quantitative information on the parent compound, but that also simultaneously collect additional information about metabolism or other potential pharmacodynamic (PD) markers, ultimately providing data for DMPK scientists containing accurate quantitative data with rich qualitative information to inform and drive programs. The flexibility of QTof platforms for quan/qual analysis allows for both a better alignment with QQQ information and workflows, and the potential to complement as well as shift workflows and assays to high resolution MS (HRMS) for value added DMPK programs.

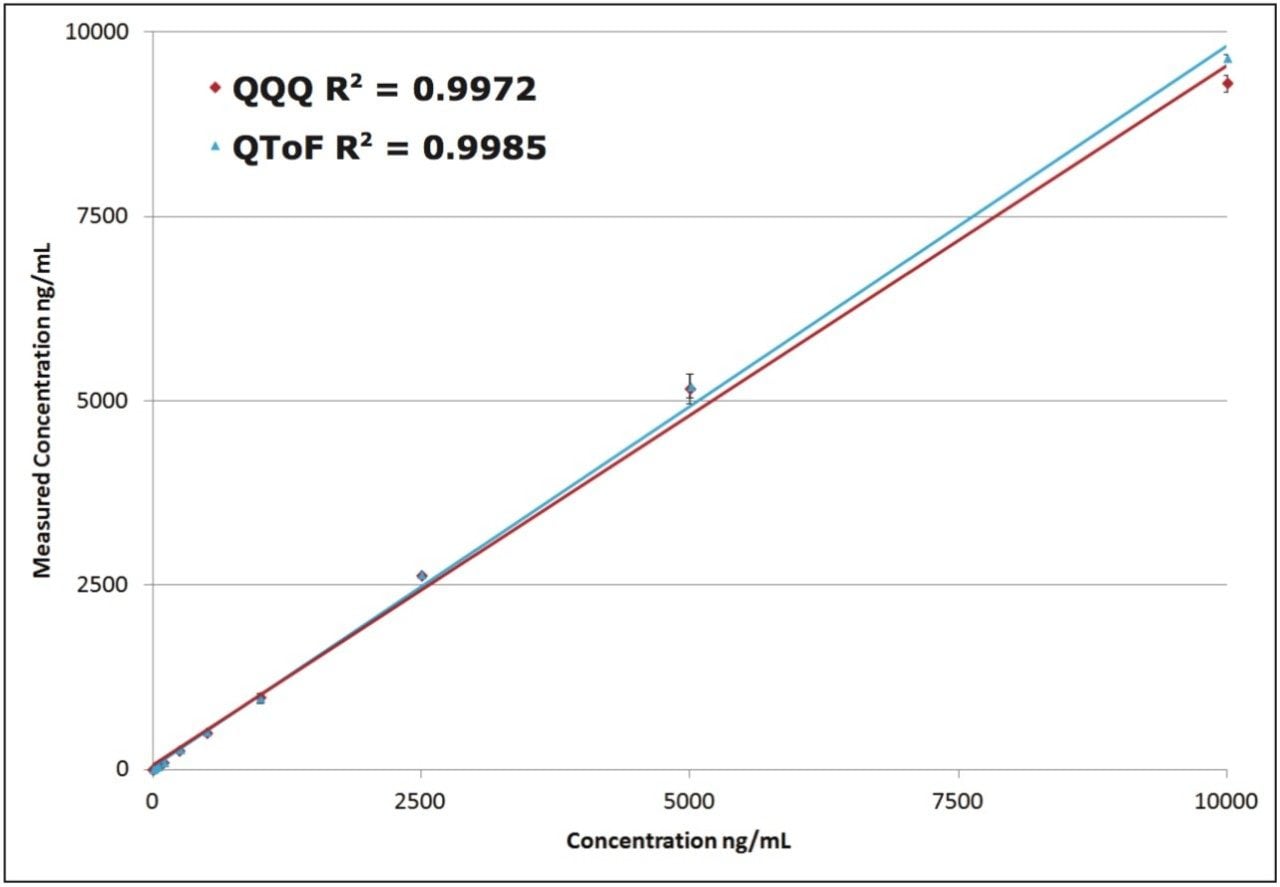
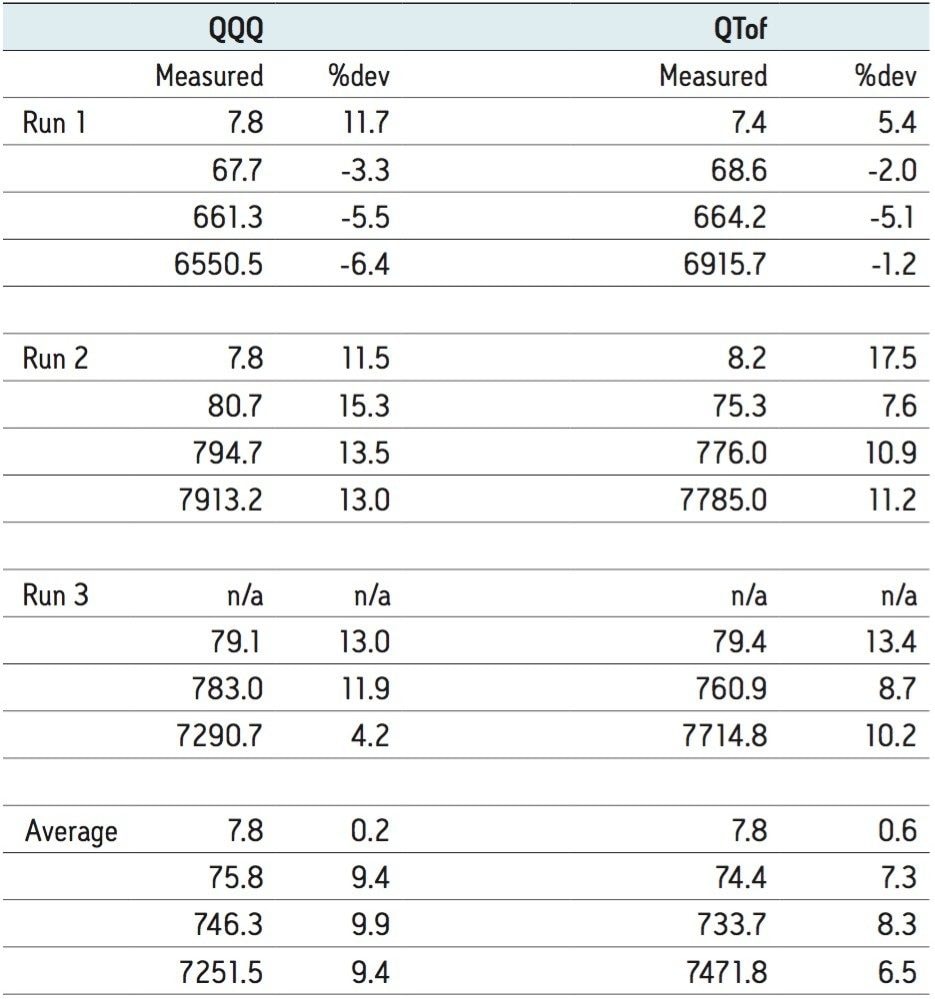
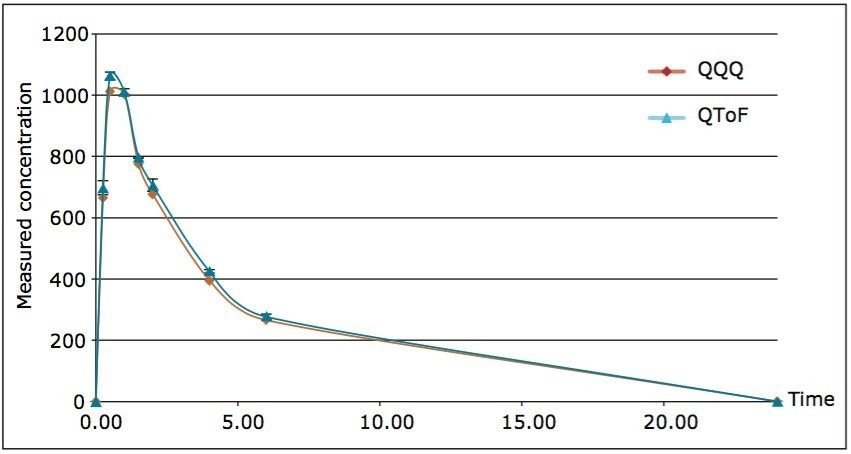
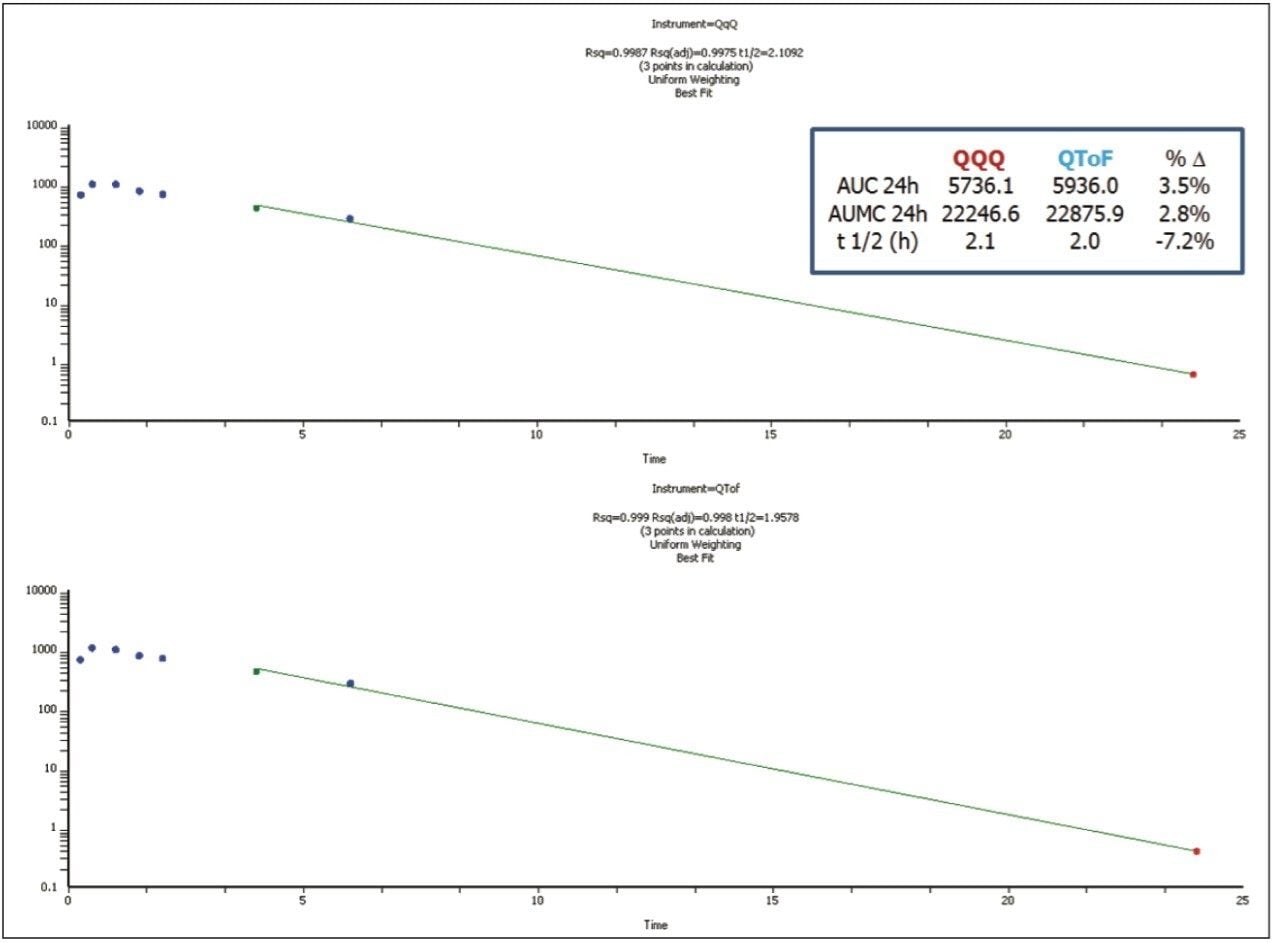
In this example, propranolol was used as a model compound and a pharmacokinetic (PK) rat study (containing standard curves, PK runs, and QCs) was conducted by Vertex Pharmaceuticals using a Xevo G2 QTof MS System for analysis. The sample set was also run at Vertex using a triple quadrupole platform with a typical MRM-based workflow under the same chromatographic conditions to provide a reference comparison data set.

This application note summarizes the collaboration between Vertex and Waters to test and demonstrate a quan/qual workflow to determine robustness and reliability of QTof measurements, and compare them against the gold-standard tandem quadrupole workflows. This work was presented as an oral presentation at ASMS 2012 in Vancouver, Canada on May 20, 2012.

Experimental

Four rats (Sprague-Dawley) were dosed PO with propranolol (75 mg/kg) by the Vertex DMPK discovery group using typical dosing protocols. Rat plasma was collected over 24 hours (predose, 15 minutes, 30 minutes, 1.0 hour, 1.5 hours, 2.0 hours, 4.0 hours, 6.0 hours, and 24.0 hours). Three sets of QCs and bracketed full standard curves (0.1 ng/mL to 10.0 ng/mL) were also analyzed. All time points for the four rats were pooled time points, with the goal of the study to test platform variability rather than biology variability.

All samples were processed using 5:1 protein precipitation with acetonitrile + 0.1% formic acid containing internal standard (IS propranolol-d7), and diluted 1:1 with water prior to injection. Samples were analyzed using a ballistic gradient (ACQUITY UPLC BEH C18 1.7 μm, 2 x 50 mm, 5% to 95% B over two minutes, A: water + 0.1% formic acid, B: acetonitrile + 0.1% formic acid, 0.5 mL/min, column temperature at 35 °C, four minute total runtime including re-equilibration). An injection volume of 5 μL was used. A tandem quadrupole Thermo Scientific Quantum Ultra mass spectrometer and a Waters Xevo G2 QTof MS System were utilized at Vertex.

The tandem quadrupole was run in MRM mode under typical discovery bioanalytical conditions. Data for the QTof was collected using MSE mode, where full scan and full scan fragmentationdata are collected simultaneously. Software deconvolution is used to align and provide precursor and fragmentation ion information for all detected components in the mixture in a generic fashion. QTof data were processed locally using MassLynx Software and its TargetLynx Application Manager, and were subsequently processed at Waters using the UNIFI Scientific Information System for quan/qual approaches

Results and Discussion

The standard curve of propranolol prepared in plasma is shown in Figure 1. Both the QTof and QQQ platform produce r2 correlation values >0.99 over the entire tested range (2.5 to 10,000 ng/mL) meeting basic discovery bioanalysis acceptance criteria of +/- 20% for all Standard Curve and QC values reported. Both platforms were able to detect standards below 2.5 ng/mL, however the deviations exceeded 20% and were not reported. The standard curves reported for both platforms are virtually indistinguishable.

Standard curve comparison by platform

QCs were evaluated at four different concentrations: 7, 70, 700, and 7000 ng/mL to cover the range of the evaluated compound. Figure 2 shows the QC results of the analyses by platform. The same QC failed on both platforms, and was excluded during run three.

QCs (7, 70, 700, and 7000 ng/mL) compared by platform

Figure 3 shows the PK curves plotted for the two platforms. Areas under the curve (AUCs) for both platforms generated nearly identical profiles. The data derived from each platform would provide the same information to DMPK program teams working on a project.

PK curves, overlay of the QTof and tandem quadrupole data

Additional PK values were calculated for both data sets and reported using Phoenix WinNonLin 13 (Pharsight Software, St. Louis, USA). Concentration values were evaluated by using NCA analysis to determine key PK parameters. Log plots and WinNonLin output is shown in Figure 4. Noncompartmental Analysis (NCA) analysis with automatic best-fit parameters and linear trapezoidal linear interpolation parameters were used and AUCs, area under the moment curve (AUMCs), and half-lives (t ½) were calculated (Figure 4). All reported values for the two instruments were within 7.2% of each other, providing a high degree of confidence that the data reported from either platform would offer the same level of information for a given study.

PK analysis in WinNonLin

Although much of the work contained in this application note compares the data between HRMS and QQQ platforms for quantitative purposes, there is additional information inherently present in an HRMS PK data set. Once we know what is happening to the parent compound, we extract additional information about the production of phase I and phase II metabolism. Furthermore, we can relate this information back to the stability of the parent
compound and/or potentially provide early indication of long-lived metabolites that may need further profiling.

Figure 5 shows trendplots for propranolol as well as two major metabolites present in the PK samples. The benefit of HRMS is now revealed, along with full PK bioanalytical data, many metabolites were observed, 5 +O, 2 +O2, 2 +glucuronide, 3 +O +glucuronide, and additional cleavage products were easily detected and tracked as circulating metabolites in these samples. These metabolites can also be tracked by MRM, however HRMS full scan techniques offer a distinct advantage by easily and confidently identifying metabolic pathways over tandem quadrupole technologies with high precursor mass specificity and fragment ion confirmations. Extensive method development and development or prediction of MRMs is avoided and a true representative picture of metabolism is obtained on the first injection with access to XICs and spectral information for all components.

Trendplots in UNIFI for HRMS QTof data set across all samples

Conclusion

  • HRMS has been shown to be fully capable of providing both quantitative and qualitative data sets.
  • The sensitivity afforded by the HRMS platform was sufficient to define the PK curve for a model compound dosed in rats.
  • Linearity of the HRMS instrument was highly comparable to the tandem quadrupole MS (QQQ) in this study and was more than adequate for performing the rat PK analysis.

Major metabolites could be easily detected and monitored over the time course with HRMS data, proving useful for determining the fate of parent in vivo. Informatics packages such as UNIFI will bridge these historically disparate workflows, and provide tools to process and visualize quantitative and qualitative data simultaneously.

720004723, May 2013

Voltar ao início Voltar ao início