• Application Note

Monitoring Sugar Content of Fruit Juice Using ACQUITY UPLC H-Class and BEH Amide Column Chemistry with Evaporative Light Scattering Detection (ELSD)

Monitoring Sugar Content of Fruit Juice Using ACQUITY UPLC H-Class and BEH Amide Column Chemistry with Evaporative Light Scattering Detection (ELSD)

  • Mark E. Benvenuti
  • Jennifer A. Burgess
  • Waters Corporation

Abstract

In this application note, we demonstrate a rapid analytical UPLC method for quantifying and profiling sugars in fruit juice with minimum sample preparation. 

Benefits

Using Waters ACQUITY UPLC H Class System with BEH Amide Column Chemistry and ELS detection provides many benefits including:

  • Run times of less than 10 minutes for food sugars.
  • ELS detection allows the option of gradient elution leading to better selectivity of saccharide analytes.

Introduction

With today’s emphasis on healthy lifestyles, the consumption of pure fruit juices rather than sugary soft drinks is considered to be beneficial for children and adults alike. Fruit juice provides other health benefits, such as being a good source of natural vitamins and antioxidants. For these reasons, fruit juices command premium prices compared to other types of liquid refreshments and they can be targets of adulteration. 

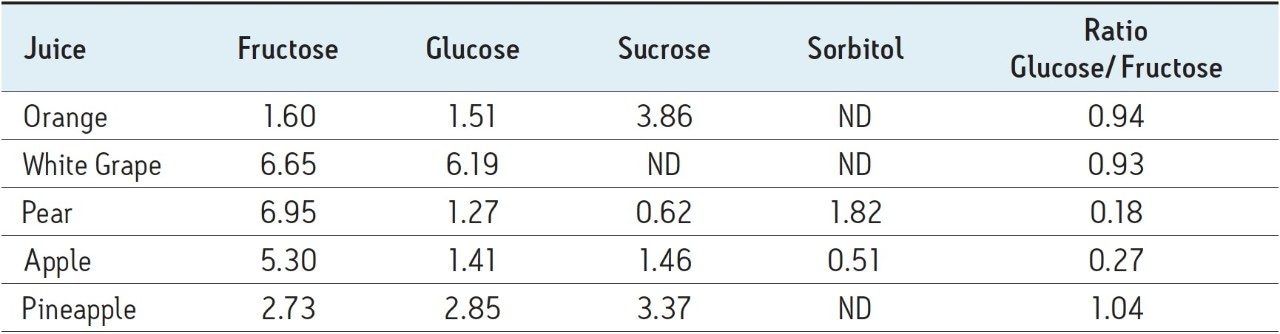
There are many markers which can be used to identify potential adulteration and these include amino acids, polyphenols and inositol content. Sugar content itself is an important marker for a particular fruit juice. The European Fruit Juice Association (www.aijn.org) provides information to its members regarding the expected sugar content of different cultivar juices. Other researchers have also published information regarding sugar content from different fruit juices, such as Sanz et al.1 While there can be some variation in sugar content among different cultivars, ratios of fructose, glucose and sucrose, the three most important food sugars in fruit juice, tend to be constant as a function of fruit juice type.2 This along with the presence of certain sugar alcohols such as sorbitol can also be used to determine excursions in fruit juice quality.

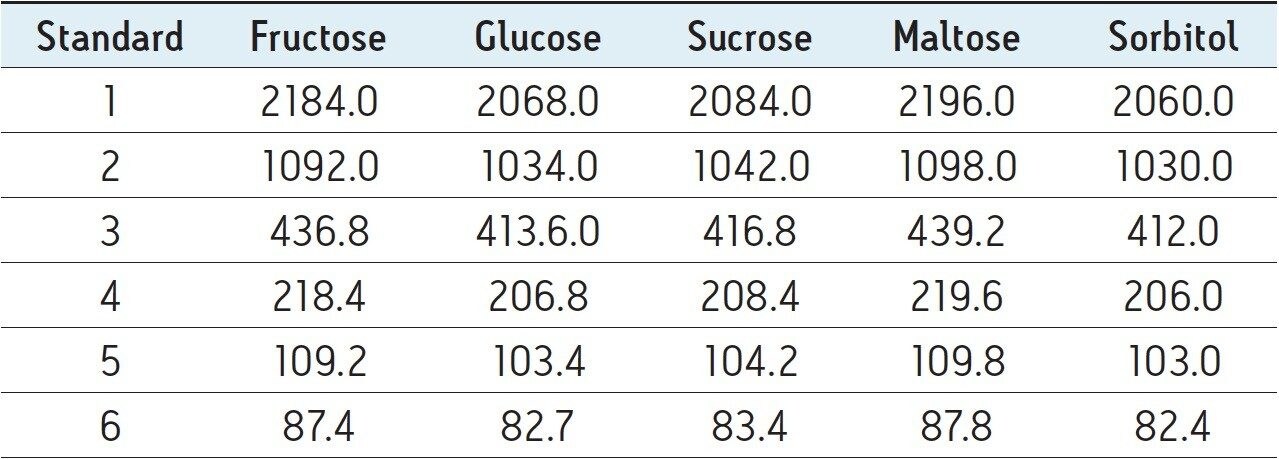
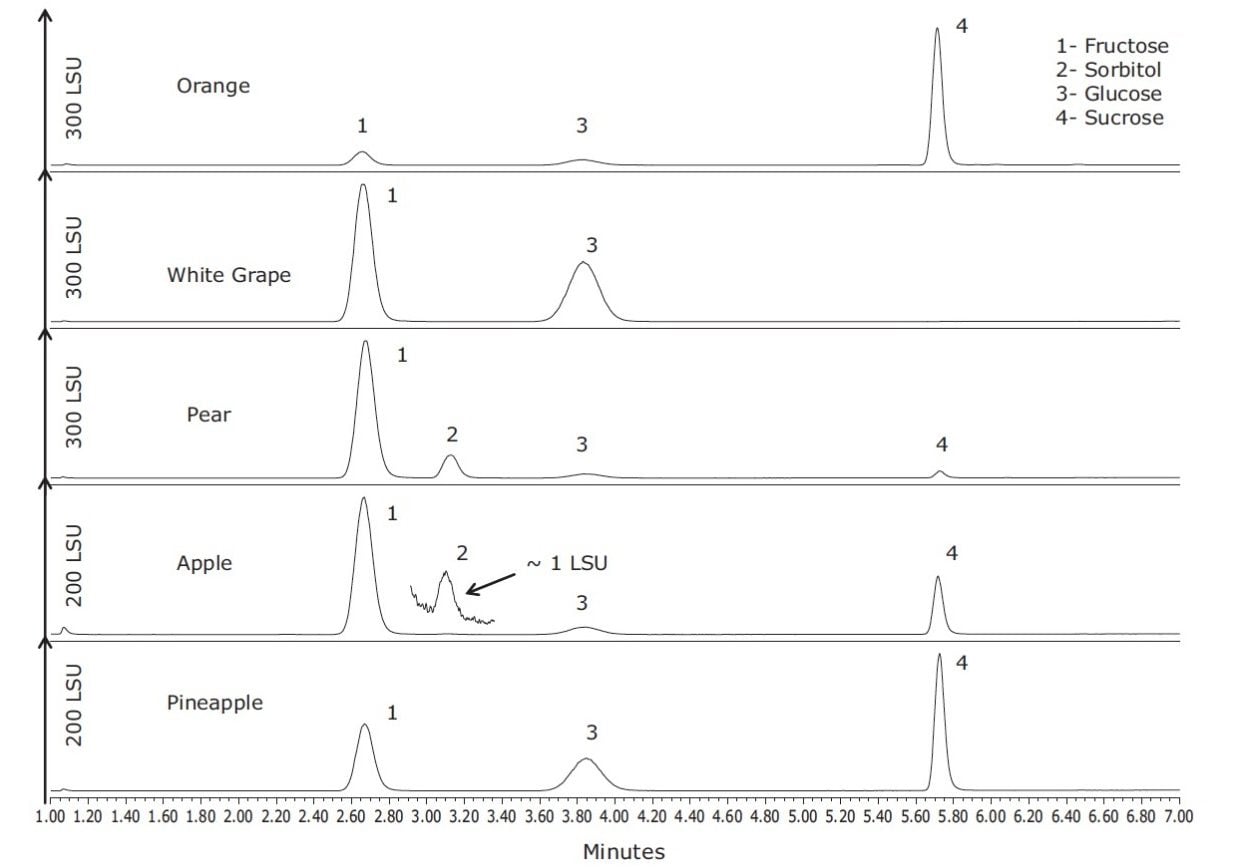
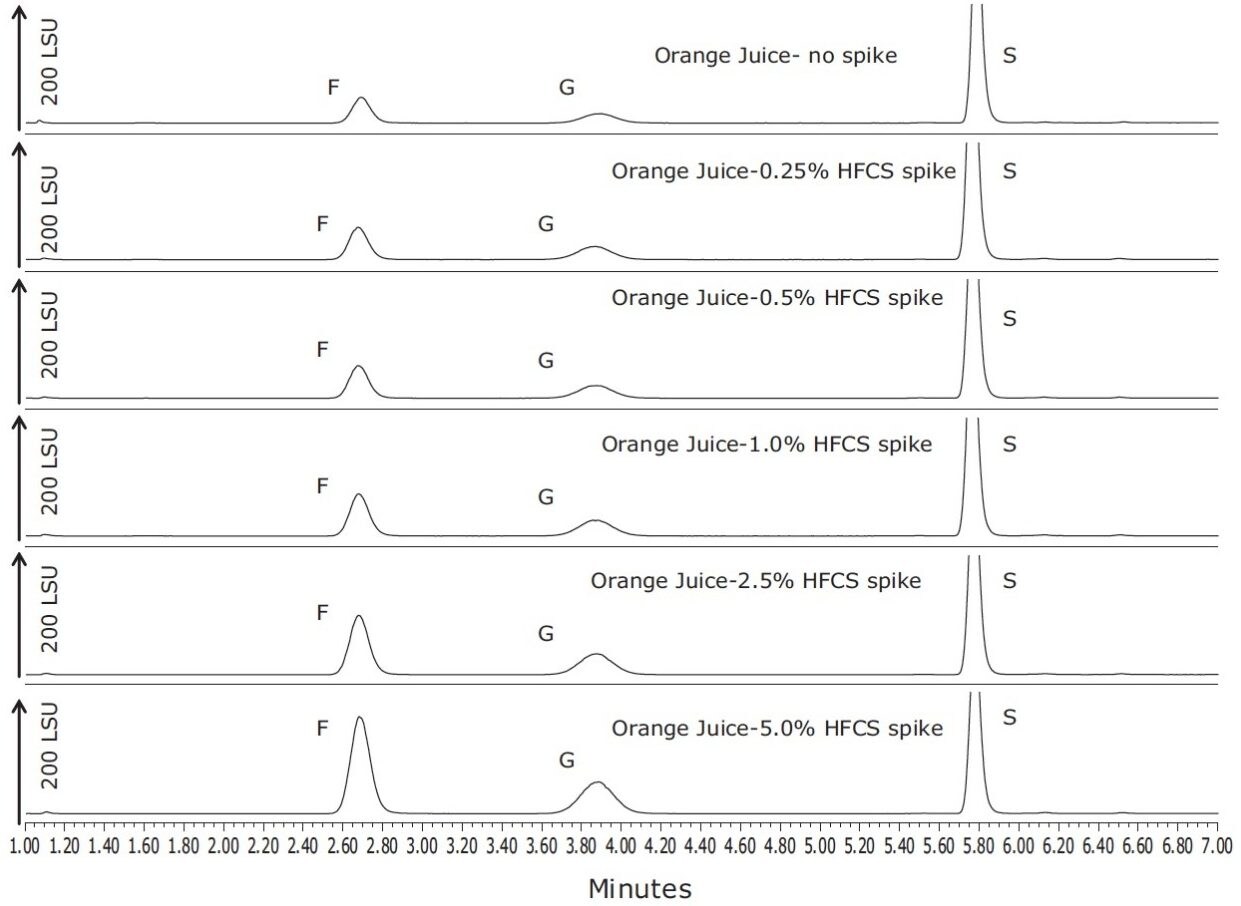
In this application note, we will show data on sugar content for several fruit juices along with their glucose/fructose ratios (G/F). Also we shall show the effect on these ratios of spiking orange juice with high fructose corn syrup (HFCS) at various levels. HFCS can be used as an adulterant for orange juice due to its low cost.3

Experimental

UPLC conditions

UPLC system:

ACQUITY UPLC H-Class

Runtime:

10.0 min

Column:

ACQUITY UPLC BEH Amide Column 1.7 μm, 2.1 x 100 mm

Column temp.:

85 °C

Mobile phase A:

0.05% Triethylamine (TEA) dissolved in water

Mobile phase B:

0.05% Triethylamine (TEA) dissolved in acetone

Injection volume:

3 μL

Gradient:

SL. No

Time (min)

Flow rate (mL/min)

%A

%B

1

Initial

0.25

10

90

2

1.0

0.25

10

90

3

10.0

0.25

50

50

4

10.1

0.25

10

90

ELSD conditions

Nitrogen flow:

40 psi

Drift tube:

55 °C

Nebulizer:

Cooling

Acquisition:

10 pts/sec

Gain:

50

Curve fit:

Quadratic

Standard preparation

A stock solution was prepared by accurately weighing 0.5 to 0.55 g each of reagent grade fructose, glucose, sucrose, maltose, and sorbitol and dissolving in 50 mL of 40:60 water/acetone. From this, a high concentration standard was prepared by diluting 2 mL of stock to 10 mL with 40:60 water/acetone. Five further dilutions of this standard were made to construct a six-point calibration curve using the standard values listed in Table 1. Each standard was injected in triplicate.

Table 1. Standards 1 to 6, units are mg/L.

Sample preparation

Samples of various fruit juices were purchased at a local market. Aliquots of these juices were centrifuged at 4000 rpm for 30 minutes. The supernatant was collected and diluted 1:50 with 40:60 water/acetone and injected in triplicate.

Samples of orange juice were spiked with varying levels of either 55 HFCS or 42 HFCS and prepared as described above to determine the effect on the glucose /fructose and fructose /sucrose (F/S) ratios (mean of three measurements).

Results and Discussion

An overlay of the six standards, each containing the four sugars and sorbitol are shown in Figure 1. As shown in Figure 1, baseline separation was achieved for the five compounds. ELS detection allows gradient elution which enhances the separation of these compounds and allows the separation of higher polysaccharides if desired.4 The BEH Amide Column chemistry prevents the formation of Schiff bases and enamines which can cause loss of reducing sugars. This robust column also allows the use of high pH modifiers and higher column temperatures which promote anomer collapse leading to better peak shape and quantitation.4,5

Figure 1. Overlay of Standards 1 to 6.

Using a quadratic fit for each of the calibration curves, coefficients of determination greater that 0.999 were achieved for all compounds, as shown in Figure 2. Typical profiles for orange, white grape, pear, apple, and pineapple juices that were purchased locally are shown in Figure 3. Differences in the sugar content for each juice were observed and sorbitol was detected only in the pear and apple juice, as has been previously reported in the literature.6 Table 2 lists the values for sugars found in the fruit juice matrices previously described.

Figure 2. Calibration curves for sugars and sorbitol.
Figure 3. Fruit juice profiles.
Table 2. Sugar content of various fruit juices; units are g/100 mL; ND=not detected.

An additional experiment was undertaken to investigate the effect of spiking two separate samples of orange juice each with varying levels of 42 and 55  (nominal % fructose) HFCS. The resulting chromatograms from spiking 55 HFCS into orange juice from 0% to 5% are shown in Figure 4, and column graphs showing G/F and F/S ratios for the two different types of HFCS are shown in Figure 5. The F/S ratios rose markedly as the orange juice was diluted by either of the non-sucrose containing HFCS. Typical ratios of sucrose:glucose:fructose are reported to be 2:1:1.3 This work suggests that monitoring the F/S ratio is a useful tool for detecting HFCS additions to orange juice.

Figure 4. Samples of orange juice spiked with varying levels of 55% HFCS.
Figure 5. G/F and F/S ratios for orange juice samples spiked with 42% and 55% HFCS respectively.

Conclusion

This application note has demonstrated a rapid method for determining sugars in fruit juices with minimum sample preparation. Use of Waters Technology for this purpose provides benefits such as:

  • Gradient elution at a higher temperature to improve selectivity and collapse sugar anomers, for better peak shape.
  • Quantification of sugars and determination of sugar ratios as potential markers of adulteration.
  • A method for rapid profiling of sugars and sugar alcohols in different fruit juices.
  • Confidence in sample quality for both incoming juice as well as finished product.

References

  1. Sanz et al. “Inositols and Carbohydrates in Different Fresh Fruit Juices” Food Chemistry. 87; (2004) pp. 326.
  2. Ibid pp 325.
  3. H S Lee, G A Coates. Quantitative Study of Free Sugars and Myo-Inositol in Citrus Juices by HPLC and a Literature Compilation. J Liquid Chromatography & Related Technologies. 23:14, 2124, 2000.
  4. K Fountain et al. UPLC-MS of Carbohydrates. Waters Application Note, No. 720003212en, October, 2009.
  5. C Hudalla et al. UPLC Analysis of Carbohydrates, Applications for Saccharide Analysis in Food and Beverage Products and Pharmaceutical Excipients. Waters Poster no. 72000321en, 2009.
  6. Richmond et al. Analysis of Simple Sugars and Sorbitol in Fruit by High Performance Liquid Chromatography. , J Agric Food Chem. 29:1, 6, 1981.

720004404, September 2012

Voltar ao início Voltar ao início