• Application Note

Eliminating Phospholipids in Drug Discovery Extractions Using a Fast, Generic Sample Clean-up Method

Eliminating Phospholipids in Drug Discovery Extractions Using a Fast, Generic Sample Clean-up Method

  • Jessalynn P. Wheaton
  • Erin E. Chambers
  • John Martin
  • Kenneth J. Fountain
  • Waters Corporation

Abstract

In this application note, Ostro 96-well sample preparation plates are used to eliminate both proteins and the vast majority of PLs while maintaining high analyte recovery, all with a simple single step method. A screening method for a group of 26 structural analogs and metabolites in plasma was developed using this technique.

Benefits

  • Simple, universal sample prep protocol
  • Speeds up workflow through direct injection of eluates
  • Eliminates the vast majority (>99%) of plasma phospholipids
  • Reduces sample variability, eliminating a major source of suppression
  • Facilitates use of shorter runtimes, improving throughput

Introduction

Drug discovery is a vital segment of pharmaceutical research where vast numbers of compounds are screened to determine therapeutic efficacy, activity, and ADME properties. This process helps identify the handful of drug candidates that will progress further. Many closely related drug compounds must be rapidly analyzed and quick decisions must be made as to which drugs will continue into development and eventually clinical trials. During the drug discovery stage, speed, time, ease of use, and high throughput are key aspects of everyday work. There is little time for method development, making simple and universal sample prep methods such as protein precipitation (PPT) an attractive choice. Crude techniques such as PPT are often quite efficient in terms of generating high analyte recovery but result in relatively dirty samples. In particular, PPT does little to eliminate phospholipids (PLs), a major source of concern in bioanalysis. PLs build up in LC-MS/MS systems and are one of the major sources of matrix effects in plasma-based assays. Amongst other problems, matrix effects also alter mass spectrometry response in an unpredictable manner, decrease method robustness, and add to method variability. In this publication, Ostro 96-well sample preparation plates are used to eliminate both proteins and the vast majority of PLs while maintaining high analyte recovery, all with a simple single step method. A screening method for a group of 26 structural analogs and metabolites (see Figure 1 for representative structures) in plasma was developed using this technique.

Representative structures of 6 of the 26 analogs utilized in this study.
Figure 1. Representative structures of 6 of the 26 analogs utilized in this study.

Experimental

ACQUITY UPLC Conditions

Column:

ACQUITY UPLC BEH C18, 2.1 x 50 mm, 1.7 μm

Mobile Phase A:

0.1% HCOOH in H2O

Mobile Phase B:

Methanol

Flow Rate:

0.6 mL/min

Injection Volume:

18.0 μL

Injection Mode:

Partial Loop

Column Temperature:

35 °C

Sample Temperature:

15 °C

Strong Needle Wash:

60:40 ACN:IPA + 0.2% conc. HCOOH (600 μL)

Weak Needle Wash:

80/20 H2O/MeOH (200 μL)

Gradient:

Time (min)

Profile

Curve

%A

%B

0.0

98

2

6

2.0

1

99

6

2.5

1

99

6

2.6

98

2

6

3.0

98

2

6

Waters Xevo TQ MS Conditions, ESI+

Capillary Voltage:

1.0 V

Desolvation Temp:

400 °C

Cone Gas Flow:

Not used

Desolvation Gas Flow:

1000 L/Hr

Collision Cell Pressure:

2.6 x 10(-3) mbar

MRM transition monitored, ESI+:

See Table 1

 MRM transitions and MS conditions.
Table 1. MRM transitions and MS conditions for the 26 structural analogs in plasma, generated using IntelliStart1

Sample Preparation Protocol

Ostro 96-well sample preparation plates

Sample preparation was performed using the standard protocol included with the Ostro 96-well plate (see Figure 2). Sample volume was 100 μL of plasma. This was extracted in the wells of the Ostro plate using 300 μL of 1% HCOOH in acetonitrile. Samples were mixed by aspiration. Vacuum was then applied to collect the eluates. Eluates were diluted 1:1 with water to ensure compatibility with the LC mobile phase and directly injected onto the LC-MS/MS system.

Ostro 96-well plate protocol.
Figure 2. Ostro 96-well plate protocol.

Results and Discussion

Separation of the 26 structural analogs (Figure 3) was achieved using a two-minute gradient at low pH with methanol. MS was performed in positive ion mode. Precursor and product ions were automatically optimized and an MS method automatically generated using IntelliStart software. A previous application note (720002569EN) by Rainville et al describes the capabilities of IntelliStart in detail.

Representative ESI+ MRM chromatogram.
Figure 3. Representative ESI+ MRM chromatogram of a mixture of 26 structural analogs and metabolites.

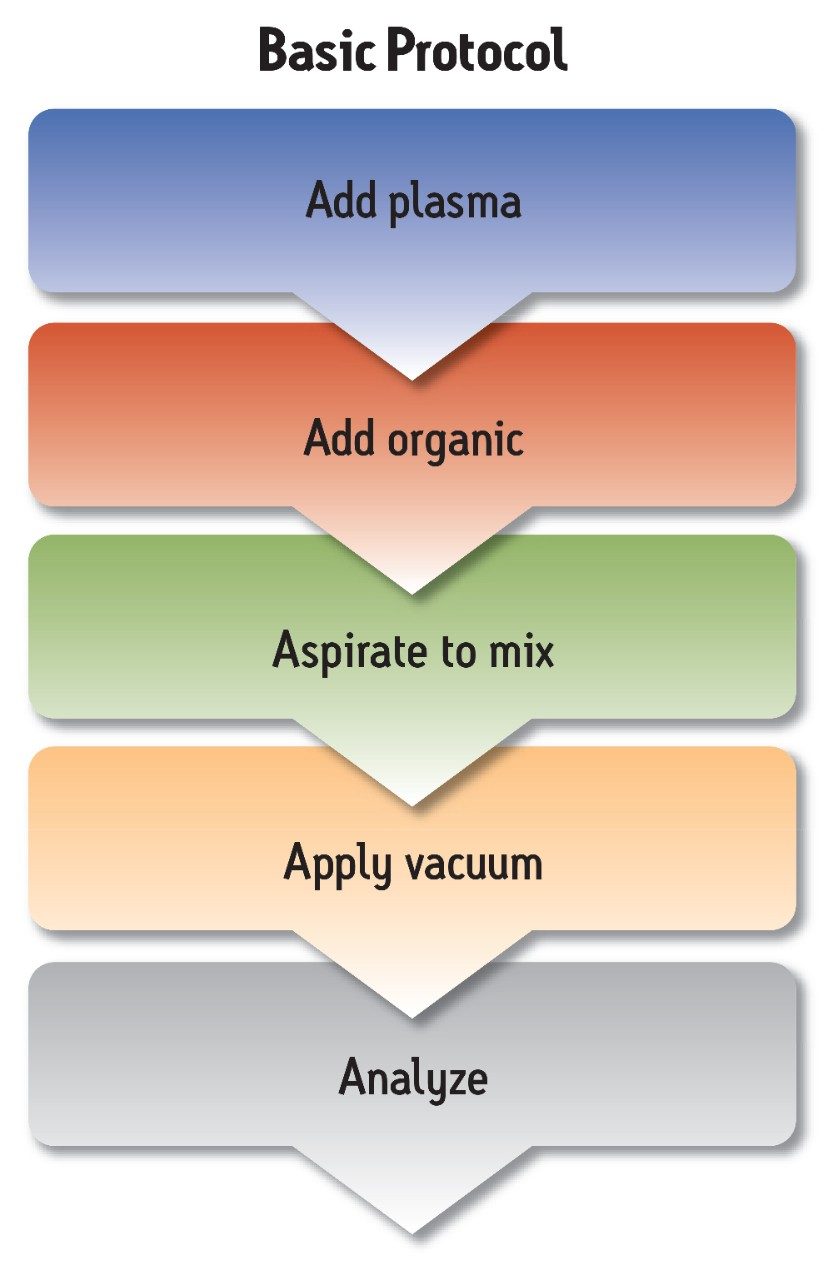
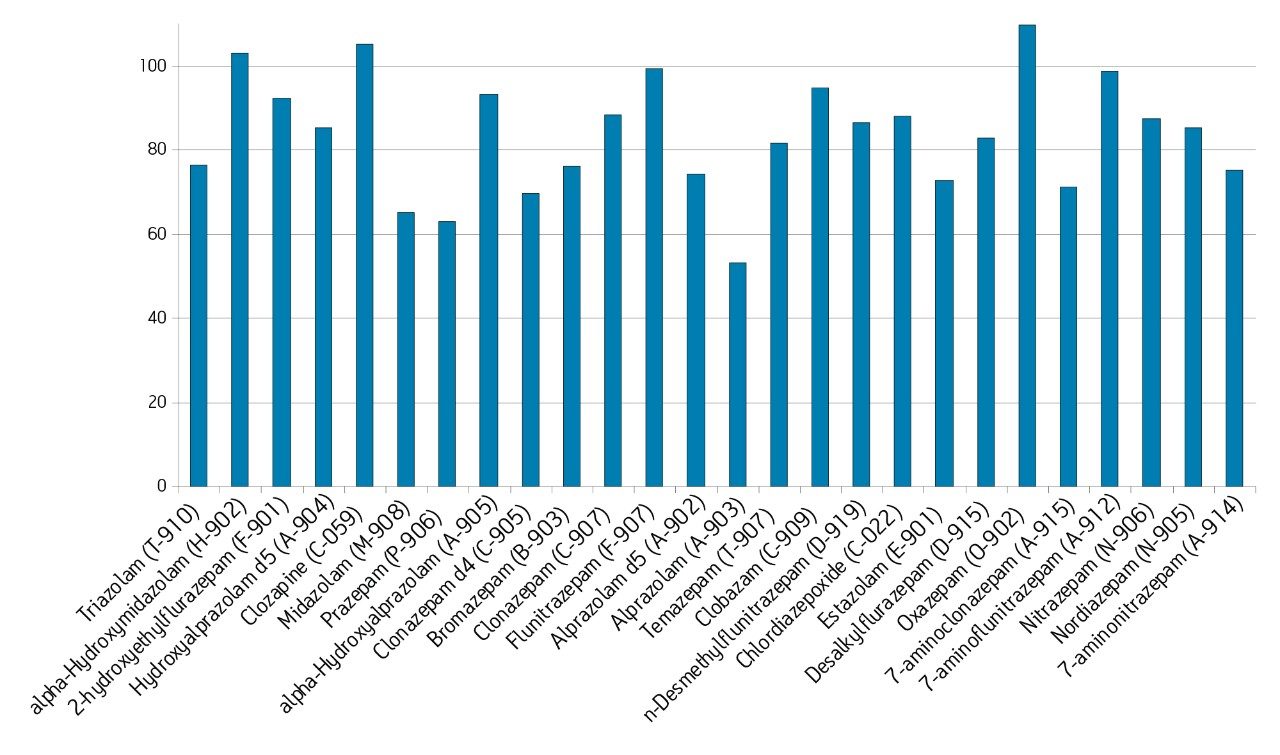
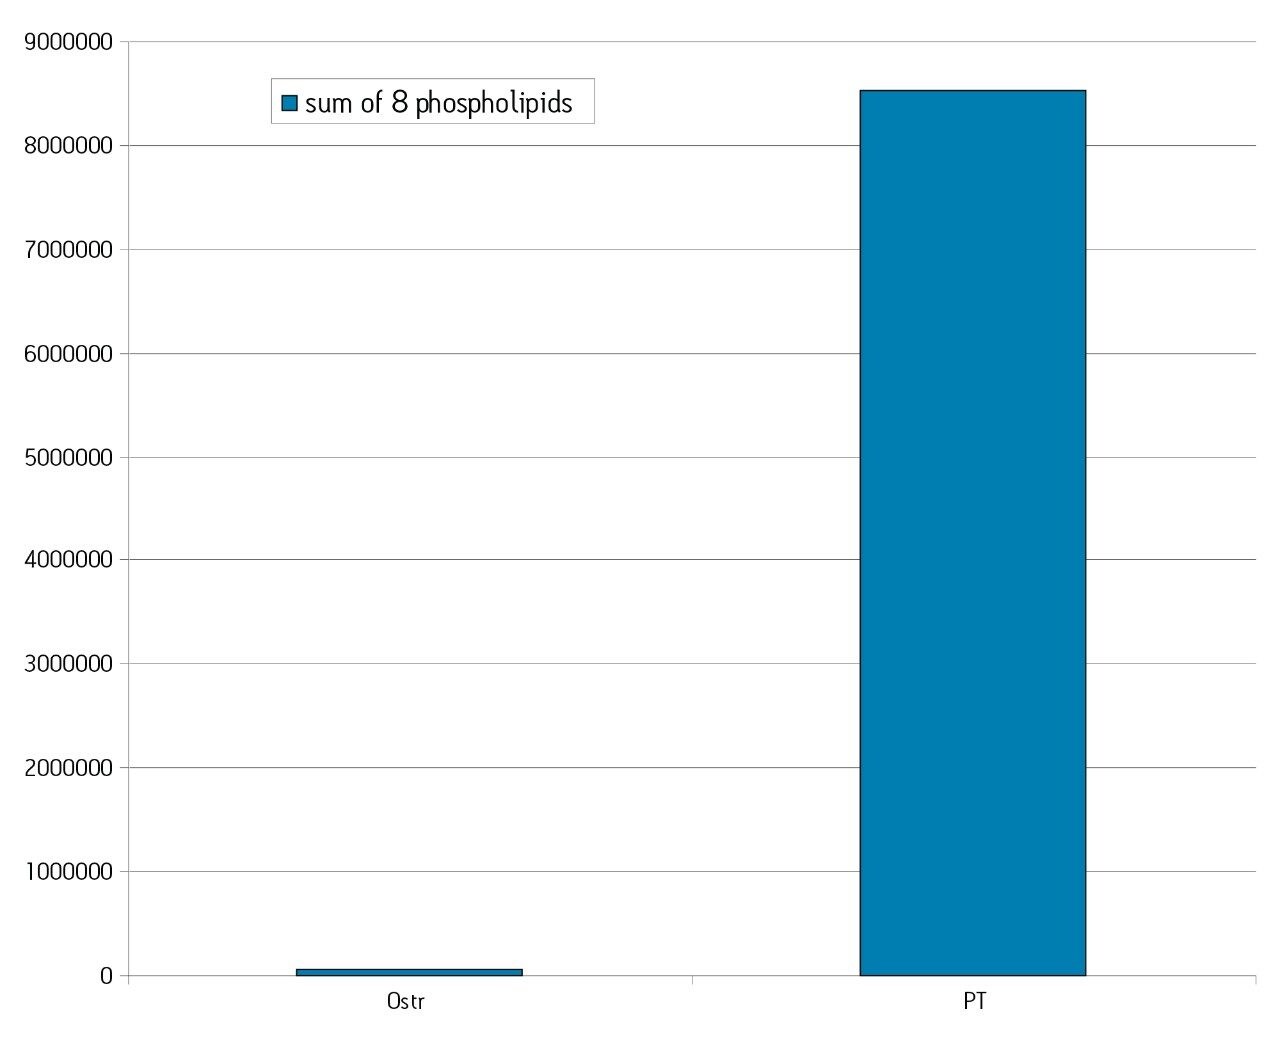
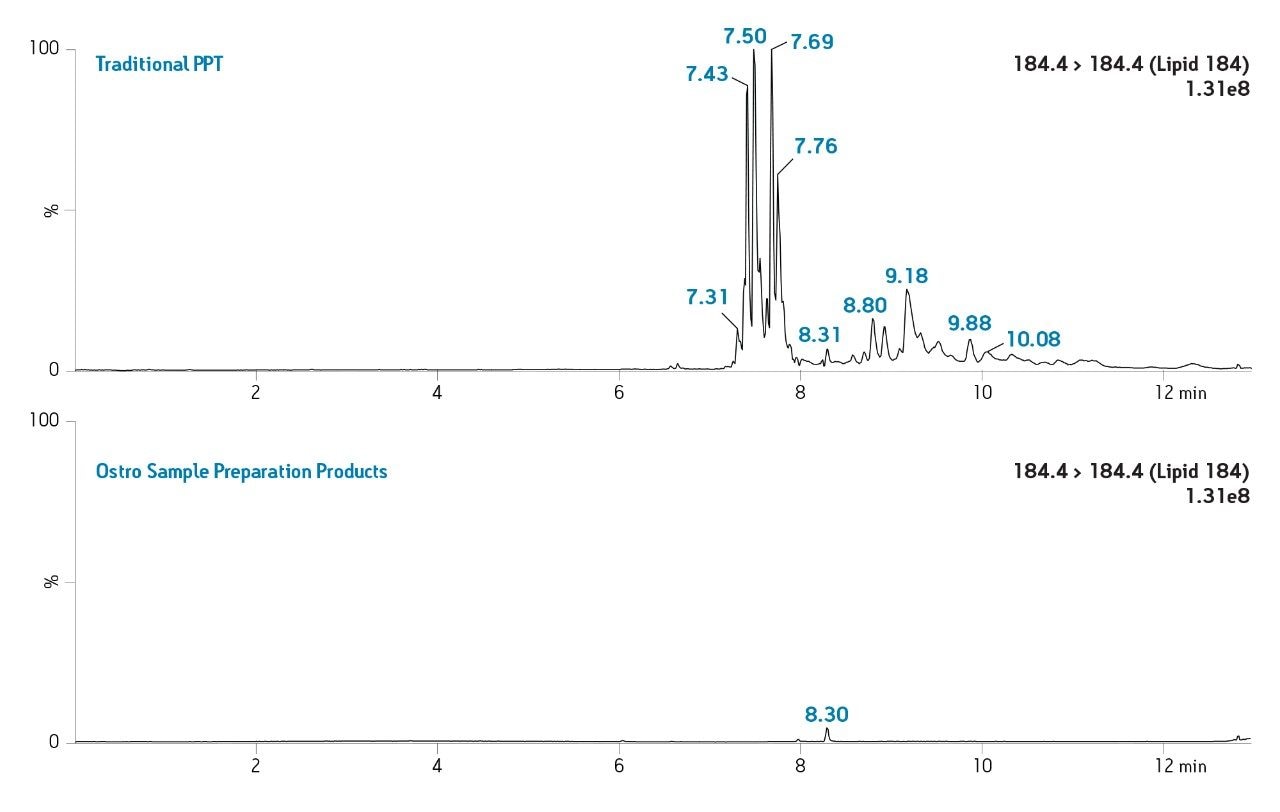
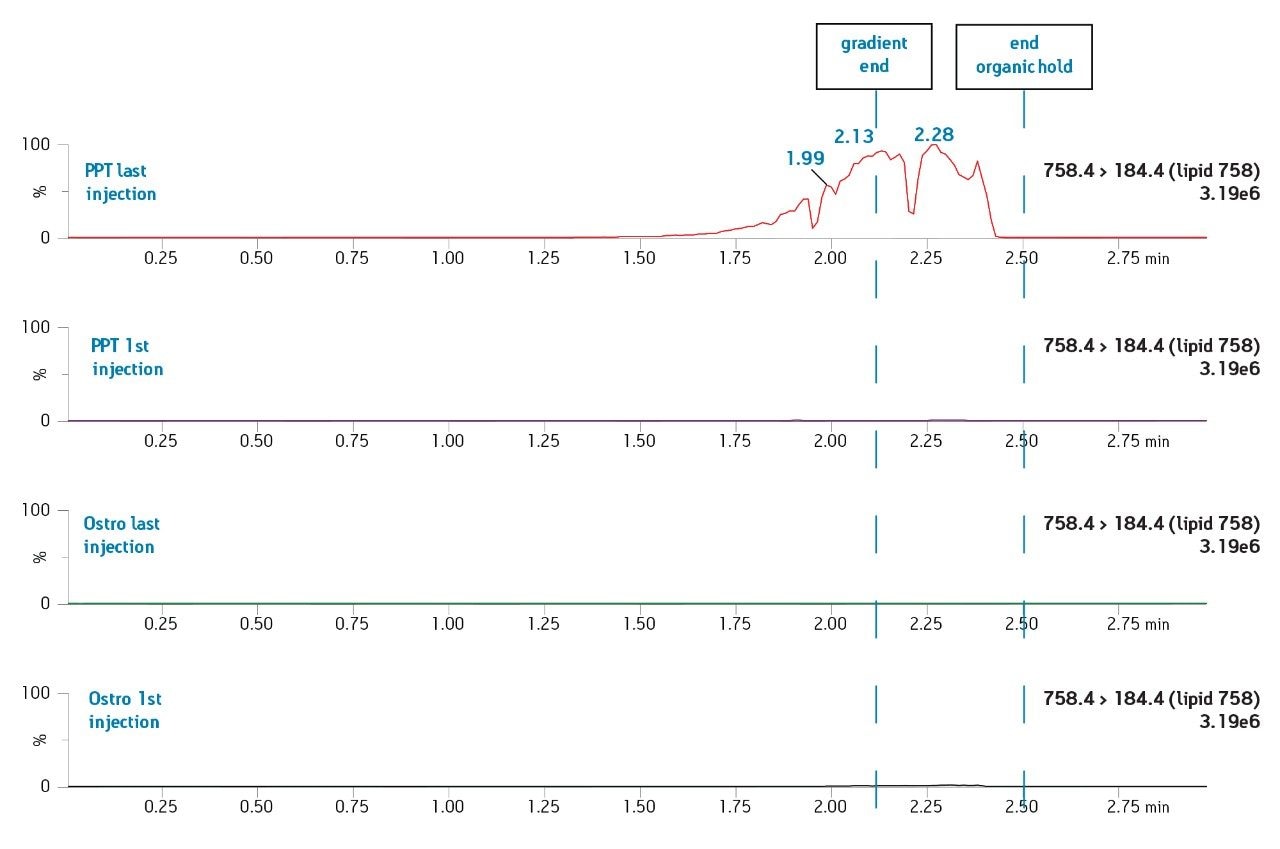
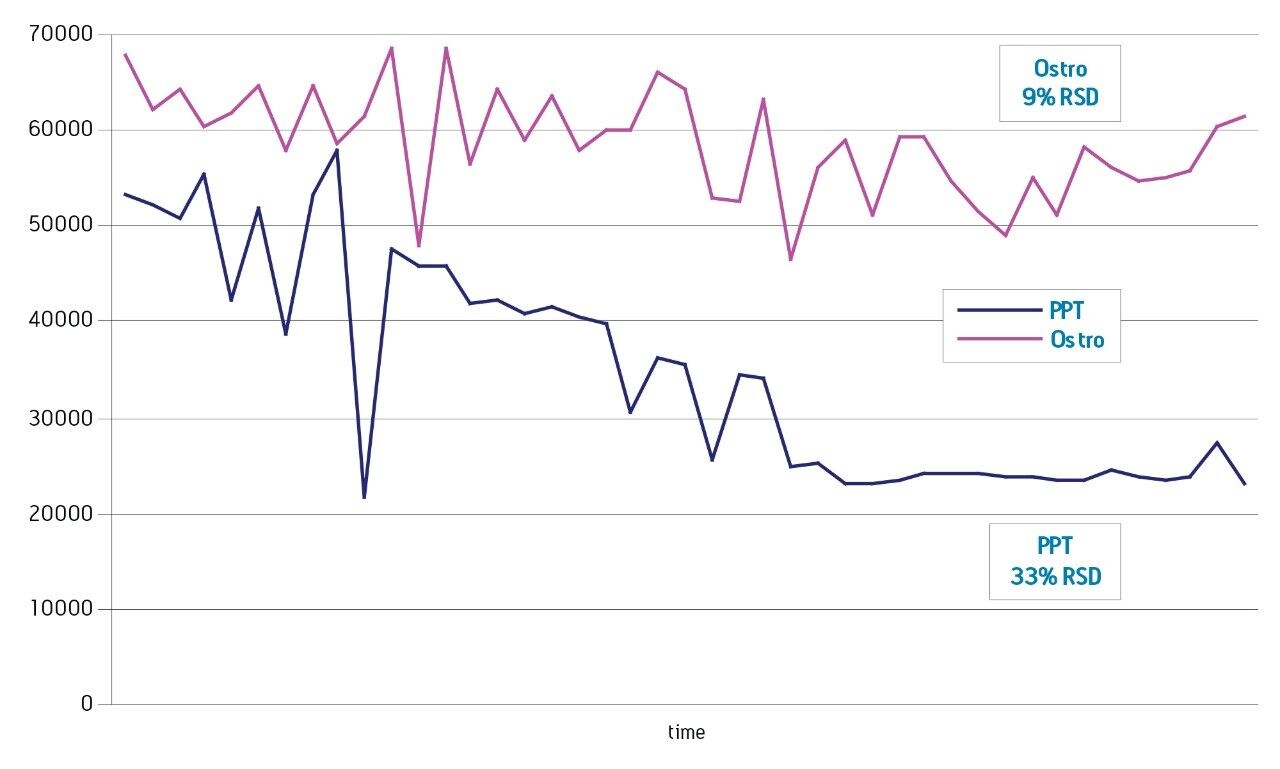
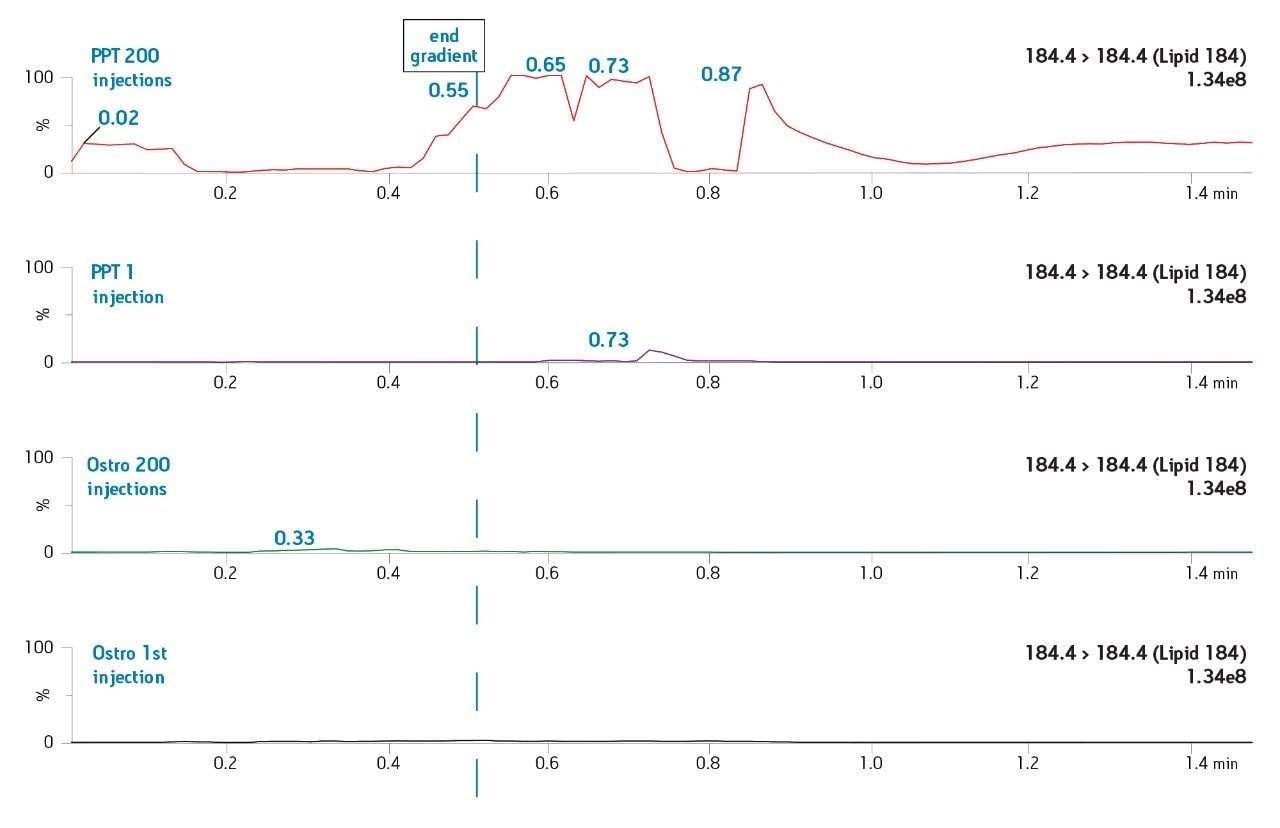
The Ostro 96-well plate was used to remove residual PLs prior to LC-MS/MS analysis. Utilizing the generic, simple protocol provided by the manufacturer (Figure 2), a group of analogous compounds were extracted. The resulting analysis demonstrated an average recovery of 86% for the group of structural analogs in plasma (Figure 4), which is equal to or better than traditional PPT. To assess PL removal, eight individual PLs were summed. Results showed that Ostro plates remove >99% of the 8 PLs relative to traditional PPT (Figure 5). In addition, the MRM transition, 184>184, was monitored to visually demonstrate the significant decrease in residual PLs using Ostro plates compared to traditional PPT (Figure 6). One of the primary reasons to eliminate PLs is to improve method robustness. Overnight runs of both Ostro plates and traditional PPT samples were carried out using the generic gradient and PLs were monitored continuously. Figure 7 shows the LC-MS trace for a representative PL at the beginning and end of the runs. When Ostro plates are used, the PL levels are negligible and no build-up occurs. When PPT is used, a significant amount of PLs are present and accumulate throughout the run. The result of this undesirable build-up is a continuous downward trend in area counts throughout the duration of the run (Figure 8). This in turn results in high signal variability relative to samples prepared with Ostro plates, 33% using PPT vs. 9% for Ostro samples. In addition, area counts decrease by 57% from the first injection to the final injection when PPT is used. In discovery bioanalysis, high throughput is of utmost importance. If one tries to increase throughput by shortening gradient time, the impact of residual PLs is further magnified. To demonstrate the negative effect PLs have on analytical throughput, the gradient time was decreased by half. Flow rate was increased and organic content was ramped from 50 to 98% in 0.5 minutes. 200 Ostro samples and 200 PPT samples were injected using the shorter gradient. The MRM transition 184>184 was monitored to reveal overall PL build-up and elution in the shortened gradient window (Figure 9). Using the 2 minute gradient, PLs elute within 0.2 minutes of the end of the gradient. Under the truncated gradient conditions PLs continue to elute for more than 1 minute after the end of the gradient and well into the reequilibration phase and beginning of the next injection. These resultant chromatograms demonstrate the inability to shorten gradient time with PPT due to PLs which continue to elute significantly after the gradient ends at 0.5 minutes. Overall, the Ostro plate allows for increased method robustness and reduced variability. Additionally both improved instrument uptime and the ability to significantly shorten run times are realized through the elimination of PLs, all of which are highly desirable in a discovery setting. Calibration curves from 1-500 ng/mL for each of the 26 structural analogs had a resulting average r2 value of 0.925, sufficient for discovery screens.

Average analyte recovery data.
Figure 4. Average analyte recovery data for 26 structural analogs and metabolites in plasma using an Ostro 96-well plate. Overall average recovery was 86%.
 Comparison of phospholipids.
Figure 5. Comparison of phospholipids remaining after traditional PPT and PPT using Ostro 96-well plate.
Representative chromatograms of MRM transition.
Figure 6. Representative chromatograms of MRM transition 184>184 to demonstrate total remaining residual phospholipids from traditional PPT and Ostro eluates.
Representative chromatograms of MRM transition.
Figure 7. Representative chromatograms of MRM transition 758>184 to demonstrate build-up of an individual PL over subsequent injections using traditional PPT. A gradient from 2-98% B in 2 minutes was used followed by a 0.5 minute hold at high organic.
Variability of area counts.
Figure 8. Variability of area counts over subsequent injections using Ostro 96 well plate vs. traditional PPT.
Representative chromatograms of the MRM transition.
Figure 9. Representative chromatograms of the MRM transition 184>184 to demonstrate the overall build-up of PLs over subsequent injections using traditional PPT vs. Ostro 96-well plate. A fast gradient from 50-98% in 0.5 minutes was used. When PPT is used, PLs continue to elute well after the end of the gradient and when the Ostro plate is used, the short gradient can readily be implemented without concern over PL build-up.

Conclusion

  • Simple, universal sample preparation protocol
  • Direct injection of the eluate streamlines workflow
  • Removes >99% of phospholipids from plasma resulting in improved instrument uptime and more robust methods
  • High recovery for analogs and metabolites with no method development
  • Reduces sample variability
  • Facilitates use of shorter runtimes, improving throughput

References

  1. Rainville, P.D., Mather J, Waters Application Note; 2008, 720002569EN

Featured Products

720004046, July 2011

Voltar ao início Voltar ao início