• Application Note

Combined Use of GC TOF MS and UPLC-QTof MS for Investigative Analysis of Honeybee Poisoning

Combined Use of GC TOF MS and UPLC-QTof MS for Investigative Analysis of Honeybee Poisoning

  • Tania Portolés
  • María Ibañez Martinez
  • Juan V. Sancho
  • Francisco J. López
  • Felix Hernandez
  • Antonietta Gledhill
  • Waters Corporation

Abstract

The aim of this application note is to investigate honeybee poisoning with two complementary exact mass techniques: the GC TOF MS and UPLC-QTof MS. Using a selection of MassLynx Software Application Managers in combination with libraries, untargeted residues, and their metabolites will be investigated, detected, and confirmed.

Introduction

The honeybee (Apis mellifera) is an important worldwide insect. Its pollinate activity is crucial for the production of high-quality commercial seeds and fruits1. However, the extensive use of pesticides in agricultural activities is resulting in more and more frequent honeybee poisoning.

In recent years, massive honeybee deaths have been an issue of increasing concern in many countries. Although pesticides and agricultural management are not the only factors, it is important to be able to assess the potential pesticides that contribute to this problem. This requires advanced analytical instrumentation, such as mass spectrometry (MS) analyzers that can provide selectivity, sensitivity, and qualitative information that allow for these compounds to be analyzed and identified.

Many journal publications have been written for the targeted analysis of pesticide residues using tandem quadrupole MS/MS. For this study, the specific pesticides related to the honeybee deaths are not known and therefore, exact mass time-of-flight mass spectrometry (TOF MS) is an ideal technique to perform investigative studies on these samples.

Experimental

Samples

Five honeybee samples (Samples 1 to 5) were used from different sites of the Valencia area (Spain) suspected to be contaminated by insecticides, together with one sample of nectarine flowers and leaves (Sample 6) (possibly related to the Sample 3 honeybee intoxication).

Sample preparation

  • Based on previous procedure2

Homogenize 1.5 g honeybees with 15 g anhydrous sodium sulphate and 0.5 g celite, extract with 50 mL acetone in a high speed blender for 2 min (Ultraturrax T25, Janke, and Kunkel, Germany).

Filter by gravity and dilute a 25-mL aliquot with 50 mL 2% aqueous NaCl (w/v) and extract twice with 25 mL dichloromethane.

Organic extracts are preconcentrated in a turbo evaporator under a nitrogen stream at 40 °C until ca. 5 mL.

Evaporate 2 mL-aliquots to dryness under a gentle nitrogen stream at 40 °C. For the final residue, dissolve in 1 mL of ethyl acetate (GC-MS analysis); 1 mL of methanol for (LC-MS analysis). (For LC-MS, the extract was ten-fold diluted with water before injection in the system in order to decrease the percentage of organic content.)

Instrumentation

a) GC-TOF MS:

GC system:

Agilent 6890N GC

Column:

HP-5MS (30 m x 0.25 mm i.d., 0.25 μm)

Temp ramp:

90 °C (1 min); 5 °C/min to 260 °C; 40 °C/min to 300 °C (2 min)

Injection:

1 μl. Splitless

Flow rate:

1 mL/min Helium, constant flow

Interface and source temp:

250 °C

MS system:

Waters GCT Premier Mass Spectrometer

Acquisition rate:

5 spectrum/s

Mass range:

m/z 50 to 650 Da

Multi-channel plate (MCP):

2700 V

Resolution:

8500 (FWHM) (at m/z 614)

Lock reference:

Heptacosa

b) UPLC-QTof MS:

LC system:

Waters ACQUITY UPLC System

Column:

ACQUITY UPLC BEH C18 2.1 x 50 mm, 1.7 μm

Flow rate:

0.30 mL/min

Injection volume:

10 μL

Mobile phase A:

Water and 0.1 mM ammonium acetate

Mobile phase B:

Methanol and 0.1 mM ammonium acetate

Gradient:

5% (B) to 90% (B) in 5 min

QTof MS system:

Desolvation & nebulizing gas:

Nitrogen

Desolvation gas flow:

800 L/hour

Resolution:

∼10,000 FWHM (V-mode) and 17,500 FWHM (W-mode) at m/z 556

Mass range (Da):

m/z 50 to 1000

MCP detector potential:

1750 V (+) and (-) ionization modes

Capillary voltages:

3.5 kV(+), 3.0 (-) kV

Cone voltage:

20 V

Interface temp:

400 °C

Source temp:

120 °C

Scan time:

0.1 s

Dynamic range enhancement (DRE):

Selected

Collision energy:

10 to 30 eV (for MS/MS)

Lock reference:

Leucine enkephalin, ~2 μg/mL at 30 μL/min

Data acquisition and processing

All data were acquired using MassLynx Software v.4.1 and processed using TargetLynx, ChromaLynx, and MetaboLynx XS application managers.

Results and Discussion

Two dead honeybee samples (Samples 1 and 2), suspected to be poisoned by insecticide treatment were analyzed. One sample of a live honeybee collected locally was also provided as a sample blank. An untargeted approach was applied in order to identify potential contaminants that may be present in the samples3,4.

For this experiment, accurate mass information from the GC TOF MS and QTof MS were processed using ChromaLynx to detect components in the sample. This provided deconvoluted exact mass spectra, which were then searched against libraries to produce a list of potential hits.

Within the list of potential compounds, positive findings of the insecticide coumaphos were detected in the two honeybee samples with both analytical techniques. Figure 1 shows data obtained using the GC TOF MS.

Figure 1. Confirmation of coumaphos in honeybee Sample 1 (GCTP). (a) Extracted ion chromatograms for four ions used for deconvolution. (b) Library mass spectrum at nominal masses. (c) Deconvoluted accurate mass spectrum for the compound detected. (d) Accurate mass spectrum of a coumaphos reference standard in solvent.

Metabolites/transformation products investigation

In the presence of such high levels of coumaphos, its metabolites were also investigated using the GC TOF MS and the UPLC-QTof MS.

Several metabolites/transformation products of coumaphos in various matrices have been described5,6: potasan (Compound 6), 3-chloro-7-hydroxy-4-methyl-chromen-2-one: CMHC (Compound 2), 4-methylumbelliferone (Compound 7), and coumaphos oxon (Compound 5), as shown in Figure 2.

Figure 2. Coumaphos metabolites identified in honeybees. Proposed degradation pathway.

GC TOF MS studies

Potential metabolites of coumaphos were investigated in a post-target way, i.e. searching for specific compounds after MS data acquisition. A TargetLynx processing method was developed based on the exact mass fragments ions available in the literature, and analyte confirmation was performed by comparison of the experimental intensity ratios with the theoretical ratios calculated from the library spectrum.

For the investigation of metabolite potasan (Compound 6) no previous EI spectral information was available, so a new-XIC of its theoretical exact m/z (328.0543) was performed. A chromatographic peak was observed at 12.65 min. Accurate masses from this spectrum were submitted to the elemental composition calculation program to obtain elemental compositions, which were compared to the theoretical ones. The resulting elemental compositions fit well with possible fragments of potasan, with low mass errors, as shown in Figure 3, leading to the conclusion that compound detected in honeybee Sample 1 was the metabolite potasan.

Figure 3. Positive finding of the coumaphos metabolite potasan in honeybee Sample 1.

UPLC-QTof MS

Data were processed using MetaboLynx XS Application Manager, which has been used in previous pesticide degradation/metabolism studies7. Two LC-MS data files (one corresponding to the sample, and the other one to a blank sample) were compared and the differences resulting from the presence of new compounds may be attributed to transformation processes in the sample.

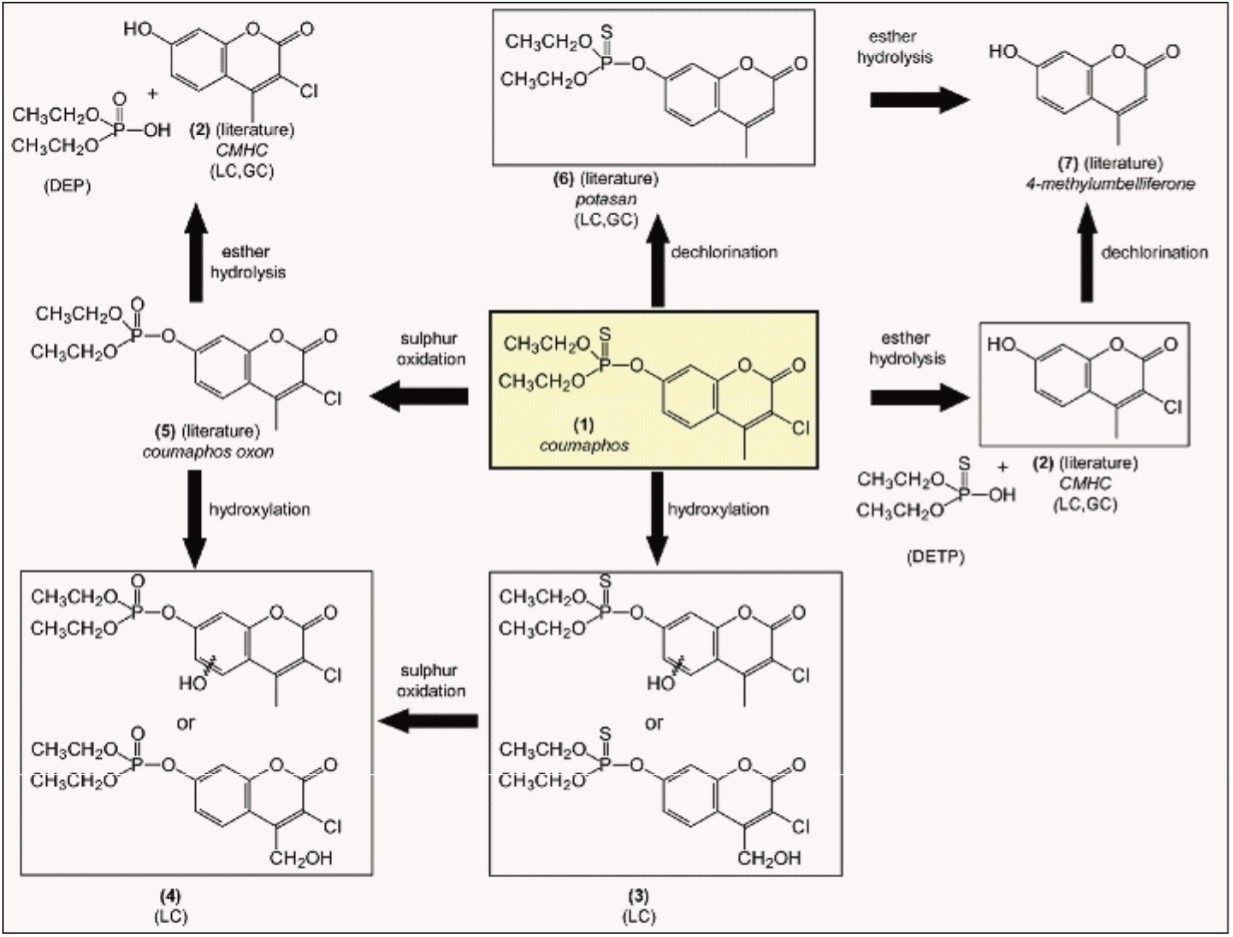
From the metabolites detected in honeybee Samples 1 and 2, four important processes were found to occur in the metabolism of coumaphos in honeybees, as shown in Figure 2: hydrolysis of the ester moiety, hydroxylation, oxidation of the sulphur atom and dechlorination. A combination of these processes was also observed.

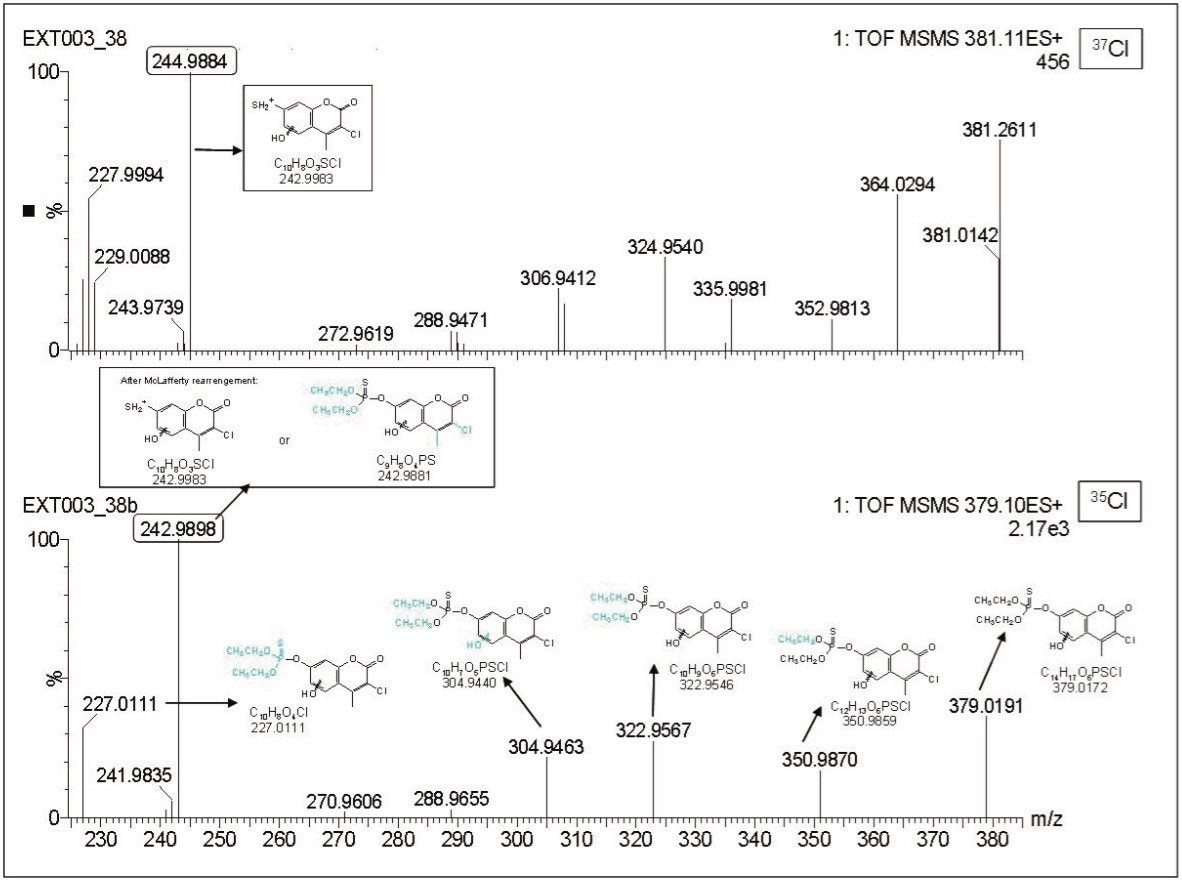
With the QTof MS data, hydroxylation was observed in the aromatic or in methyl group (Compound 3). In Figure 4, product ion spectrum of Compound 3 ([M+H]+ C14H17O6PSCl, m/z 379.0191) showed fragment ions at m/z 350.9870 (ΔmDa=0.8 compared to the theoretical exact mass), 322.9567 (ΔmDa=1.0), and 304.9463 (ΔmDa=0.6), which resulted from losses of one ethyl group, two ethyl groups and two ethyl groups plus water from the precursor ion m/z 379.0191, respectively, showing that the hydroxylation could not occur in the ethyl radicals.

Figure 4. Product ion spectra (Q TOF MS) of the hydroxylated coumaphos precursor ions (a) m/z 379 (35Cl) and (b) m/z 381 (37Cl) from Sample 1.

Performing MS/MS experiments of both precursor ions (corresponding to 35Cl and 37Cl) led to useful information. Thus, the fragment ion m/z 242.9884 was initially assigned to C9H8O4PS, which would have resulted from a hydroxylation in the aromatic ring. However, after performing MS/MS experiments (precursor ion m/z 381, 37Cl) it was observed that this fragment maintained the chlorine atom, being therefore assigned to C10H8O3SCl instead of C9H8O4PS. Then two possibilities (hydroxylation in the methyl group and hydroxylation in the aromatic ring) were still feasible. A combination of oxidation of the sulfur atom on the P=S functional group plus hydroxylation was also observed (Compound 4). Finally, the data suggested a loss of the chlorine atom (potasan, Compound 6).

The high resolution Tof MS data is useful for distinguishing between Compounds 1 and 4 which have an exact mass difference of 16 mDa. These two compounds (m/z 363) are indistinguishable by nominal mass resolution instruments. The elemental composition calculator was also used: this takes into account any potential isotope ratios that may exist. For both compounds excellent isotope fits were observed indicating the experimental isotopic pattern was consistent with the theoretical one.

Conclusion

The GC TOF MS and UPLC-QTof MS are two complementary techniques for screening untargeted compounds across a broad range of polarities and volatilities. In this example, the screening of unknown pesticides and their metabolites in honeybee samples was shown. Data obtained from both instruments concluded that coumaphos could be found in dead honeybee samples.

The possibility of performing high resolution exact mass ToF experiments using the GC TOF MS and UPLC-QTof MS helps to elucidate and/or confirm the structure of compounds detected: exact mass data product information supports structural elucidation and compound identification process.

Software solutions are important to help translate chromatographic and exact mass data into information that could be used to identify the unknown compounds.

  • Elemental Composition Calculator and i-Fit help reduce the number of potential compound hits obtained from exact mass investigation.
  • ChromaLynx Application Manager deconvolutes exact mass data and identifies possible compounds present in samples.
  • MetaboLynx XS Application Manager enables rapid identification of expected and unexpected metabolites.


References

  1. Rancan, M; Rossi, S; Sabatini, A G. Determination of Thiamethoxam residues in honeybees by high performance liquid chromatography with an electrochemical detector and post-column photochemical reactor. J Chromatogr A. 2006: 1123, 60-65.
  2. Fernandez, M; Pico, Y, Girotti, S, Manes, J. Analysis of organophosphorus pesticides in honeybee by liquid chromatography-atmospheric pressure chemical ionization-mass spectrometry. J Agric Food Chem. 2001: 49, 3540-3547.
  3. Hernández, F, Portolés, T, Pitarch, E, López, F J. Target and nontarget screening of organic micropollutants in water by solid-phase microextraction combined with gas chromatography/high-resolution time-of-flight mass spectrometry. Anal Chem. 2007: 79, 9494-9504.
  4. Ibáñ ez, M, Sancho, J V, Hernández, F, McMillan, D, Rao, R. Rapid non-target screening of organic pollutants in water by ultraperformance liquid chromatography coupled to time-of-light mass spectrometry. TrAC - Trends Ana. Chem. 2008: 27, 481-489.
  5. Olsson, A O, Nguyen, J V, Sadowski, M A, Barr, D B. A liquid chromatography/electrospray ionization-tandem mass spectrometry method for quantification of specific organophosphorus pesticide biomarkers in human urine. Ana. Bioana. Chem. 2003: 376, 808-815.
  6. Jindal, T, Singh, D K, Agarwal, H C. Persistence, degradation, and leaching of coumaphos in soil. J Environ Sc. Heal B. 2000: 35, 309-320.
  7. Ibáñez, M, Sancho, J V, Pozo, O J, Hernández, F. Use of quadrupole time-of-flight mass spectrometry in environmental analysis: Elucidation of transformation products of triazine herbicides in water after UV exposure. Anal Chem. 2004: 76, 1328-1335.

Acknowledgements

The authors are very grateful to the Serveis Centrals d’Instrumentació Científica (SCIC) of University Jaume I for the use of UPLC-QTof MS (QTof Premier) and GC-TOF MS (GCTP). They also acknowledge the financial support from the Ministerio Español de Ciencia y Tecnología (project CTQ2006-07594). The authors thank their colleague Óscar J. Pozo for his useful comments, and to Fernando Calatayud and Enrique Simó from Agrupación de Defensa Sanitaria Apícola (apiADS) de la Comunitat Valenciana for providing the honeybees samples. T. Portolés is very pleased to Ministerio de Educación y Ciencia for her pre-doctoral grant.

720003342, February 2010

Voltar ao início Voltar ao início