• Application Note

Determination of pH Stability by UPLC-MS/MS

Determination of pH Stability by UPLC-MS/MS

  • Darcy Shave
  • Peter G. Alden
  • Waters Corporation

Abstract

This application note demonstrates the 27 compounds which were analyzed with a UPLC-MS/MS protocol including MS MRM parameter optimization, MS acquisition method creation, data acquisition, data processing, and report generation.

Introduction

The purpose of stability testing is to provide insight into the stability of a drug substance or drug product over time, and under the influence of environmental factors (e.g., temperature, humidity, and light) and in vivo factors (e.g., pH and liver microsomes).

Evaluating the stability of drug substances and products is significant to determining drug quality, as it contributes to the efficacy of any drug or its dosage form. Regular testing is considered to be the only way to ensure delivery of the right therapeutic values to patients during treatment.

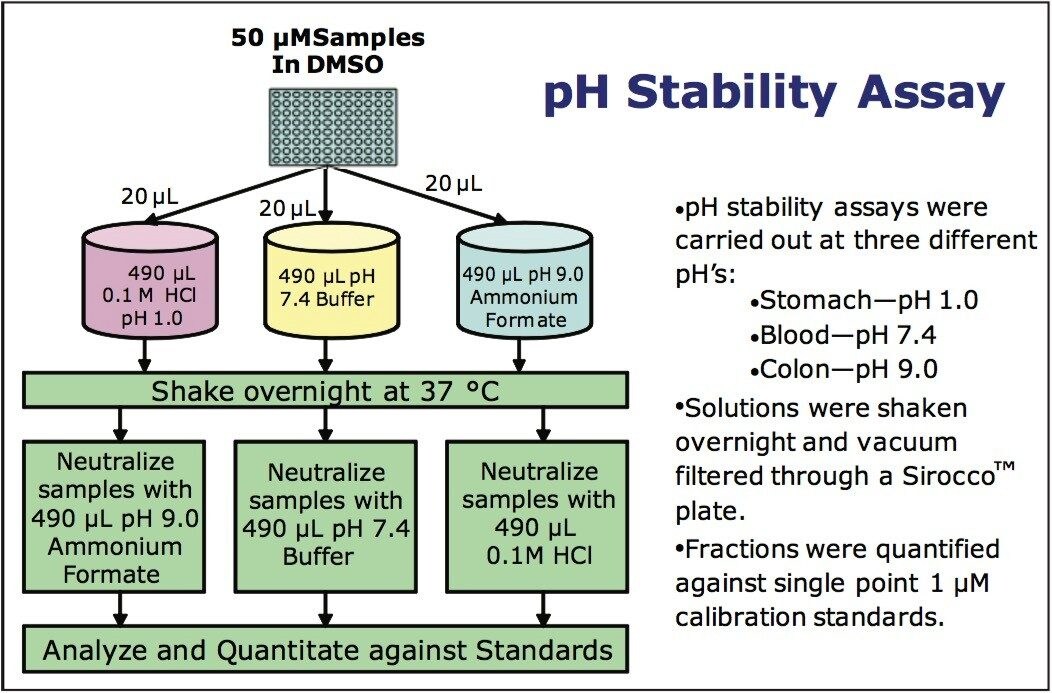
Instability due to the pH of the stomach (pH 2.0) or the intestine (pH 8.0) can significantly affect bioavailability. Compounds may also be exposed to degradation by in vitro bioassay test matrices that vary in pH. The resulting degradation can confuse structureactivity relationship (SAR) results, leading to dead ends and loss of valuable time for a drug discovery project.

It is therefore necessary to study the effect of a variety of pH levels on the stability of drug candidates.

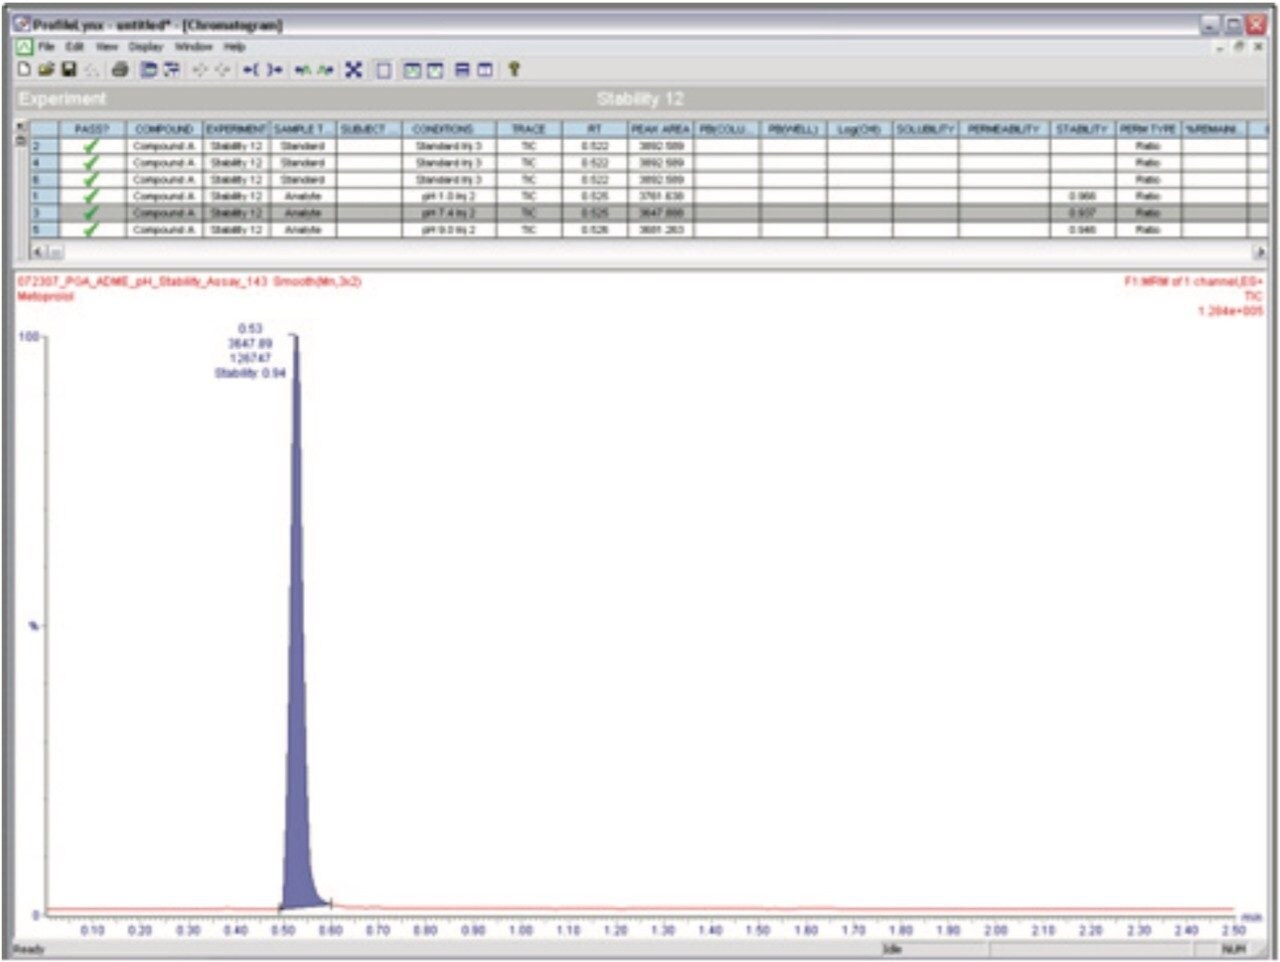
Given the detection speed and sensitivity of UPLC(r)-MS/MS, the Waters ACQUITY TQD System (Figure 1) used in conjunction with specialized software, ProfileLynx and QuanOptimize Application Managers, is the ideal choice for analysis of drug degradation resulting from pH.

Experimental

A set of 27 commercially available compounds were randomly chosen to demonstrate the ProfileLynx Application Manager.

Samples

Individual stock solutions of the 27-compound library were prepared in a 96-well plate at a concentration of 50 μM in dimethylsulfoxide (DMSO). The three different pH buffer solutions were prepared in the following manner:

  • pH 1.0: A solution of hydrochloric acid (HCl) was prepared at approximately 0.1 M and adjusted to pH 1.0 with either additional HCl or water.
  • pH 7.4: A solution of phosphate buffered saline (PBS, pH ~7) was adjusted to pH 7.4 with ammonium hydroxide.
  • pH 9.0: A 10 mM solution of ammonium formate was adjusted to pH 9.0 with ammonium hydroxide.

For each different pH assay, 20 μL of each 50 μM stock solution was transferred to a 2-mL, 96-well plate. 490 μL of the appropriate pH buffer was added to each well in the plate resulting in compound concentrations of approximately 2 μM. The plate was shaken gently on a Jitterbug shaker for 24 hours at 37 °C. The sample solutions were then quenched in the following manner:

  • pH 1.0 samples were quenched with 490 μL of pH 9.0 ammonium formate.
  • pH 7.4 samples were quenched with 490 μL of ph 7.4 PBS.
  • pH 9.0 samples were quenched with 490 μL of pH 1.0 HCl.

After quenching, the concentration of the samples would be 1.0 μM for any compounds not degraded at the pH of the buffer. 5 μL of samples at this concentration were directly injected.

Standards

A single-point standard calibration was used for quantitation of the sample solutions. Because the pH stability measurements were carried out under aqueous conditions, the standard was prepared in water at a concentration of 1.0 μM.

5 mM stock solutions of the compounds in DMSO were diluted 1:100 in 50:50 acetonitrile/water to a concentration of 50 μM.

20 μL of the 50 μM stock solutions was added to 980 μL of water, resulting in 1.0 μM standard solutions.

These samples were analyzed by UPLC-MS/MS.

The QuanOptimize Application Manager was used for automated optimization of the MS multiple reaction monitoring (MRM) conditions for each compound.

Figure 2. Flowchart of pH stability assay procedure.

LC Conditions

LC system:

Waters ACQUITY TQD System

Column:

ACQUITY UPLC BEH C18 Column 2.1 x 50 mm, 1.7 μm

Column temp:

40 °C

Flow rate:

600 μL/min

Mobile phase A:

0.1% Formic acid in water

Mobile phase B:

0.1% Formic acid in acetonitrile

Gradient:

5 to 95% B/1.3 min

MS Conditions

MS system:

Waters TQ Detector

Ionization mode:

ESI Positive

Capillary voltage:

3200 V

Source temp:

150 °C

Desolvation temp:

450 °C

Desolvation gas:

900 L/hr

Cone gas flow:

50 L/hr

Inter-scan delay:

20 ms

Inter-channel delay:

5 ms

Dwell:

200 ms

Acquisition range:

100 to 1000 m/z

Calculations

When using a single-point calibration, ProfileLynx calculates the % stability as the ratio of the amount of compound (or peak area) in the pH buffer divided by the amount of compound in the standard, resulting in a remaining percentage that should be between 0.0 and 1.0.

Results and Discussion

The pH stability of the 27 compounds was determined using MassLynx Software’s ProfileLynx Application Manager. Relative amounts were calculated using a single-point calibration, which compares the peak area of the analyte at time 0 minutes to the peak area of the analyte at time 24 hours to return a ratio.

Compounds were denoted as standard or analyte in the Sample Type column of the sample list. The standard and analyte were linked in the sample list with the Compound A column.

In the ProfileLynx browser, stability of the analyte is reported as a ratio of the peak area of the standard. Any stability values outside of a specified minimum and maximum range were automatically flagged within the ProfileLynx Results Browser (Figure 3). For this experiment, the minimum was set at 50 and the maximum at 100.

The interactive browser allowed for editing of peak integration. Peak assignments were easily changed and peak integrations were quickly optimized. Results were then exported in a format amenable to the corporate database.

Figure 3 shows an example how ProfileLynx processes and displays pH stability data and results. The results for Metaprolol shown indicate that although quite stable, some degradation has taken place, particularly at pH 7.4 and pH 9.4. It has been reported in the literature that beta-blockers such as Metaprolol1 are most stable at a pH of approximately 3 and may undergo degradation by hydrolysis at a pH of ~7.4 and higher.

Figure 3. Stability results for Metaprolol shown in ProfileLynx.

Conclusion

The potential for compound degradation by pH should be considered when developing drug candidates. Lack of knowledge of compound degradation and its affect on bioavailability can mislead research teams, confuse SAR, and lead to poorly informed decisions.

The 27 compounds in our sample set were analyzed with a UPLC-MS/MS protocol including MS MRM parameter optimization, MS acquisition method creation, data acquisition, data processing, and report generation.

Data generated from the variety of assays were all automatically processed with the same software. A single report was created for the 27 compounds that contained stability results, enabling the researcher to analyze results quickly, thus increasing throughput. Results were displayed in an interactive, graphical summary format based on sample or experiment.

Using ProfileLynx and QuanOptimize Application Managers allowed for:

  • Automated MS method development and data acquisition
  • Single approach for data processing and report generation from multiple assays
  • Complete automated analysis, processing, reporting
  • Increased laboratory throughput

References

  1. Siluk D, Mager DE, Gronich N, Abernethy D, Wainer IW. HPLC-Atmospheric Pressure Chemical Ionization Mass Spectrometric Method for Enantioselective Determination of R,S-propranolol and R,S-hyoscyamine in Human Plasma. J Chromatogr B Analyt Technol Biomed Life Sci. 2007; 15; 859(2): 213–21.

720002613, May 2008

Voltar ao início Voltar ao início