This application note demonstrates a MRM technique, using which a method was developed for the quantification of 81 pesticides and pesticide metabolites.
The limits of detection achieved for the pesticides analyzed are well below that required for surveillance monitoring in the European Union
Worldwide, there are over 800 pesticides currently in use to control undesirable weeds, insects, rodents, and fungi. The legal enforcement of regulations governing pesticide use requires the regular monitoring of agricultural produce. Food produce used for human consumption must contain less than the statutory Maximum Residue Limit (MRL) of any given pesticide. Given the large number of pesticide residues that may be found in foodstuffs, it is advantageous to determine as many as possible during a single analysis.
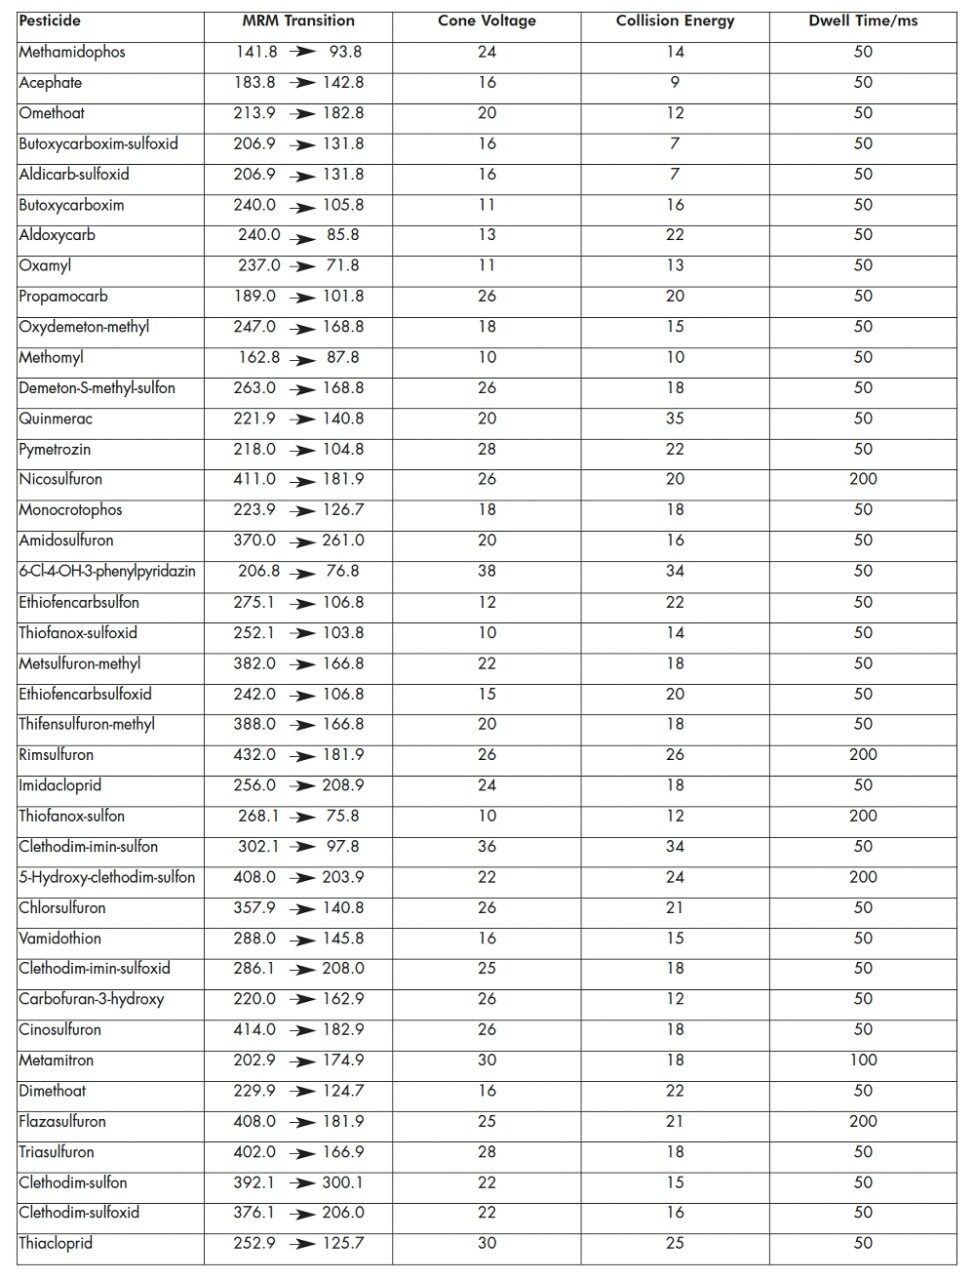
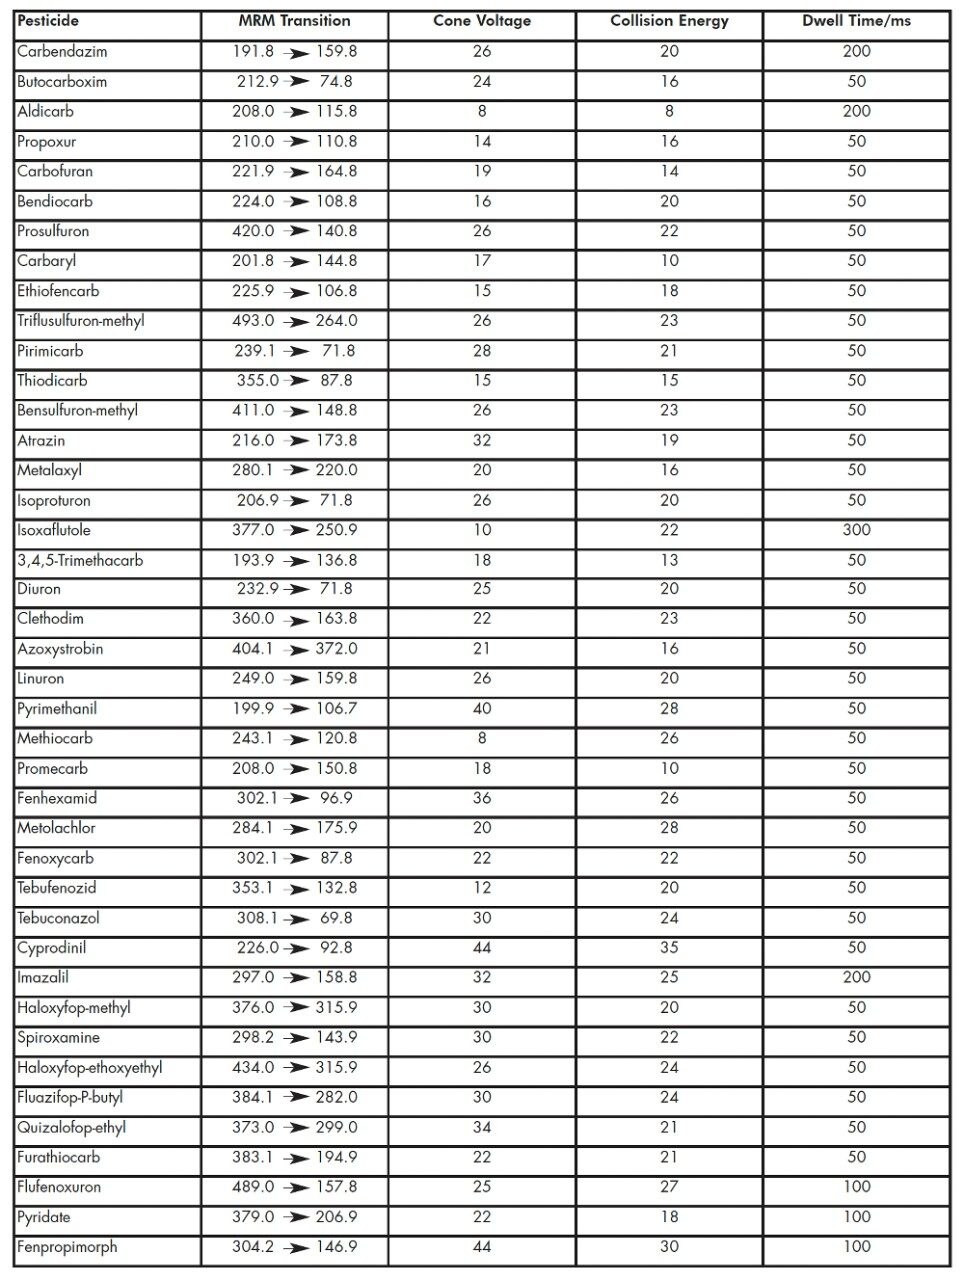
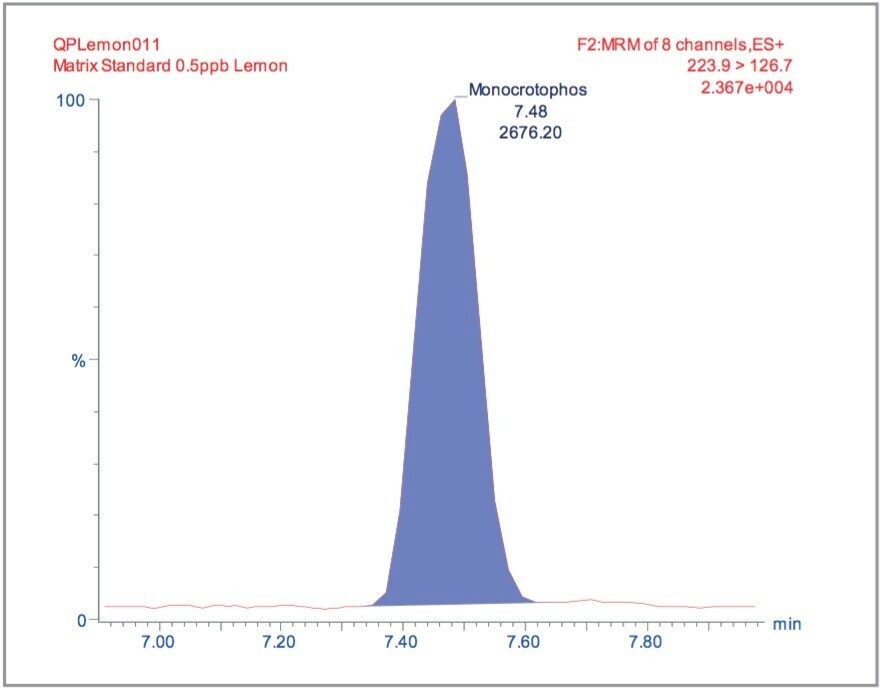
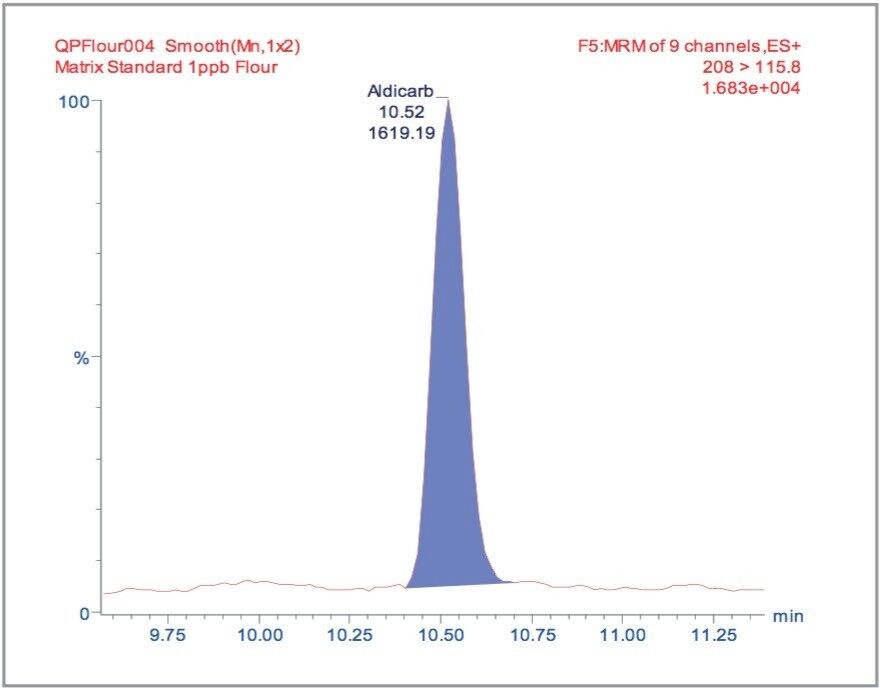
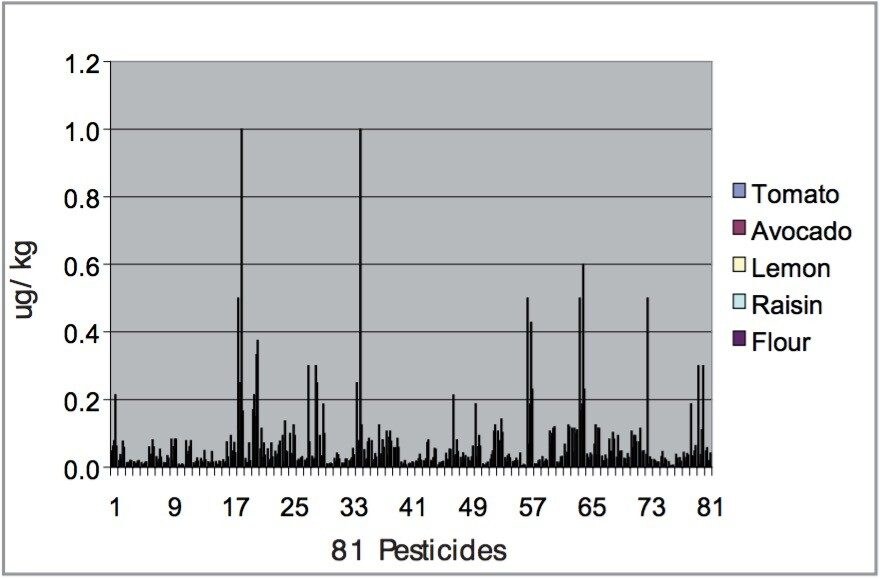
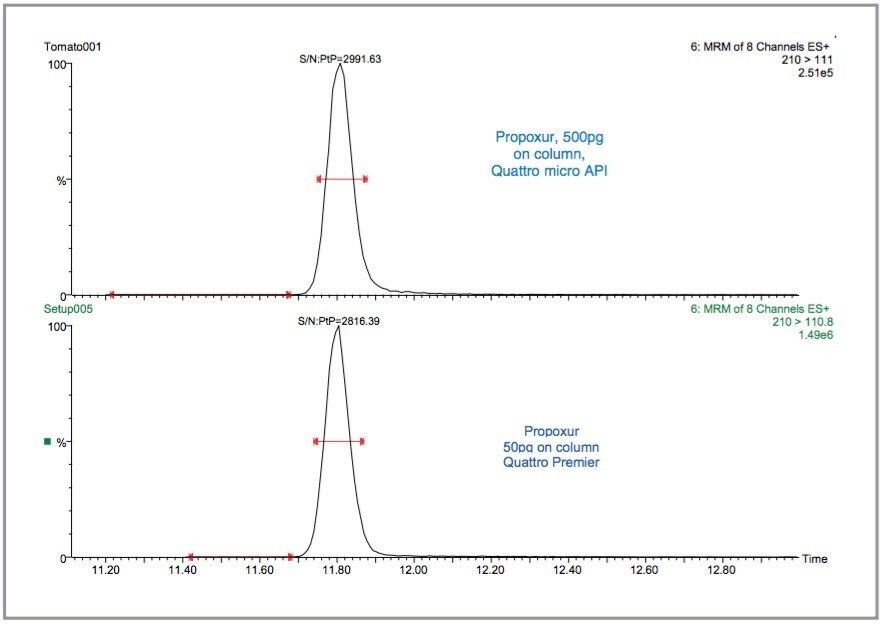
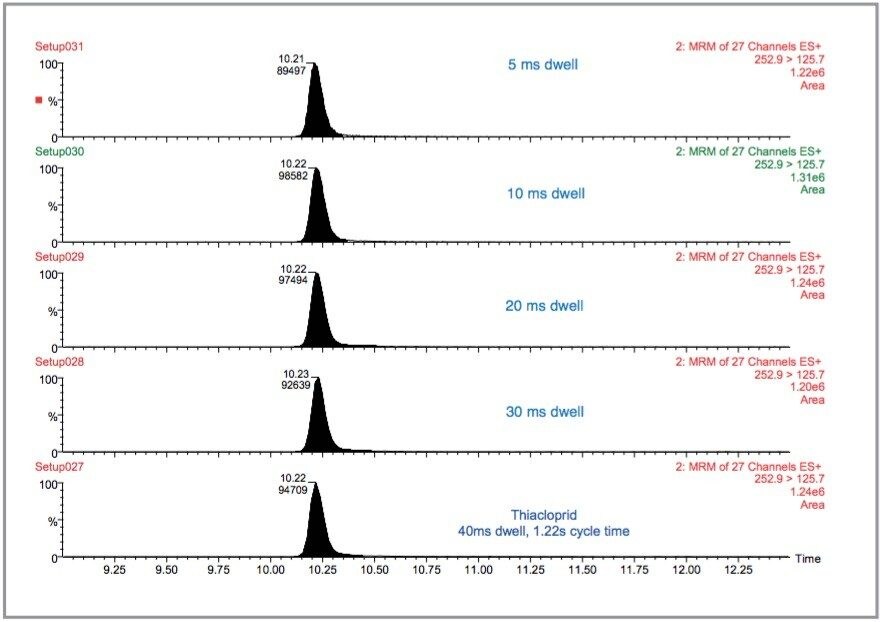
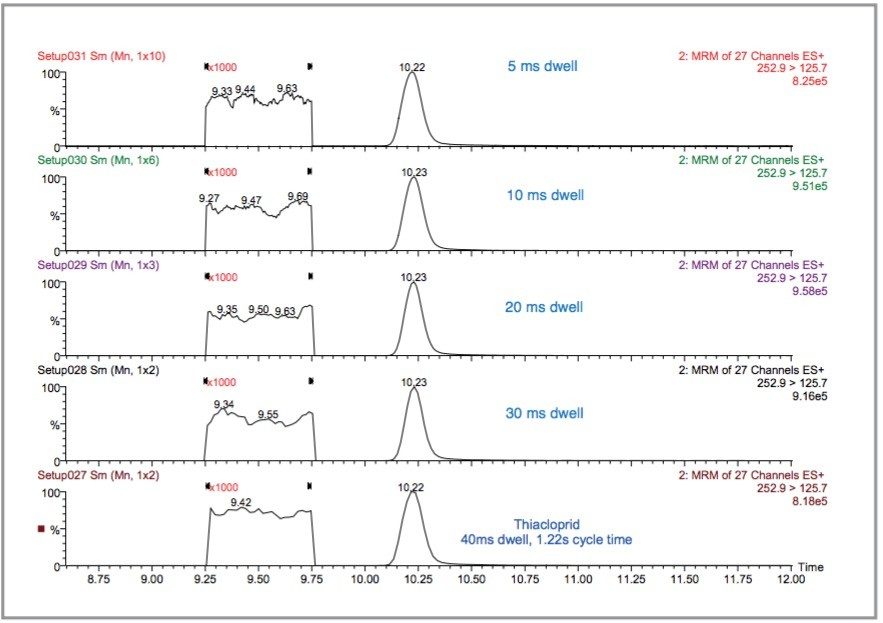
81 pesticides including: carbamates, benzimidazoles, organophosphorus, oxime carbamates, sulfonylureas, triazines, cyclohexanedione oximes, and ureas were analyzed in this study. As the number and diversity of target analytes is increased, the selectivity of the clean-up stage of sample preparation is compromised, resulting in a more complex sample matrix. Significant improvements in analytical selectivity may be achieved using triple quadrupole mass spectrometry in the Multiple Reaction Monitoring (MRM) mode.
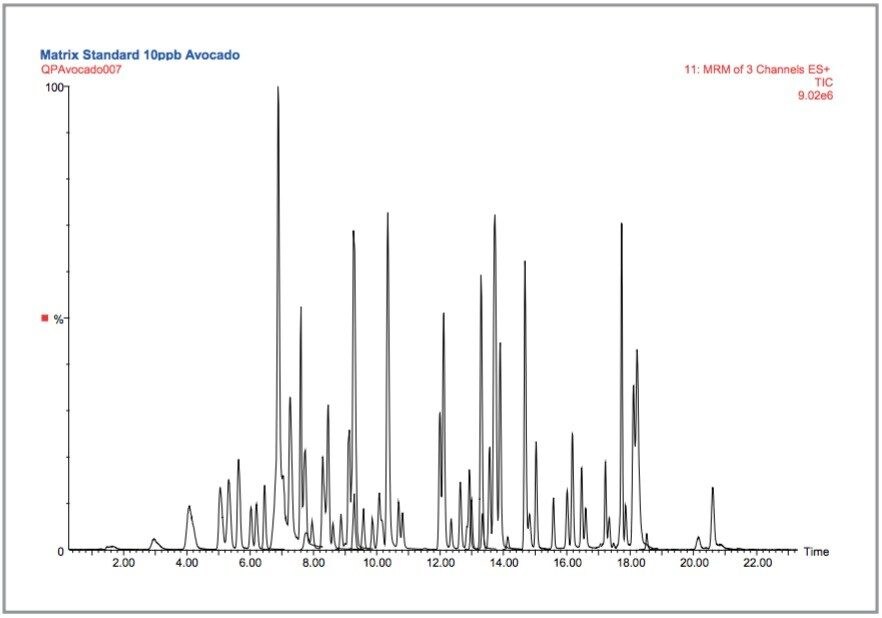
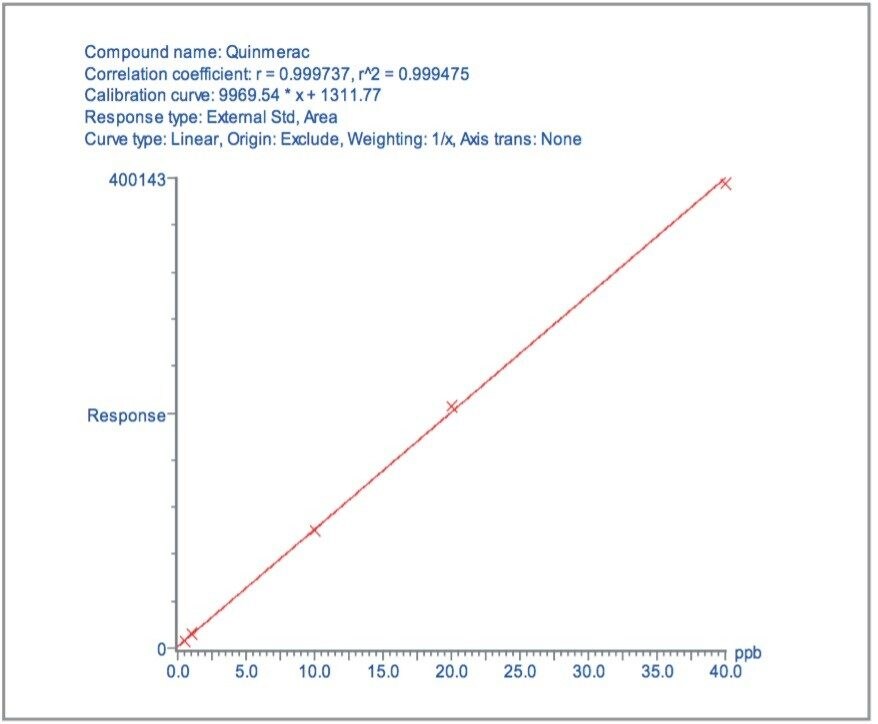
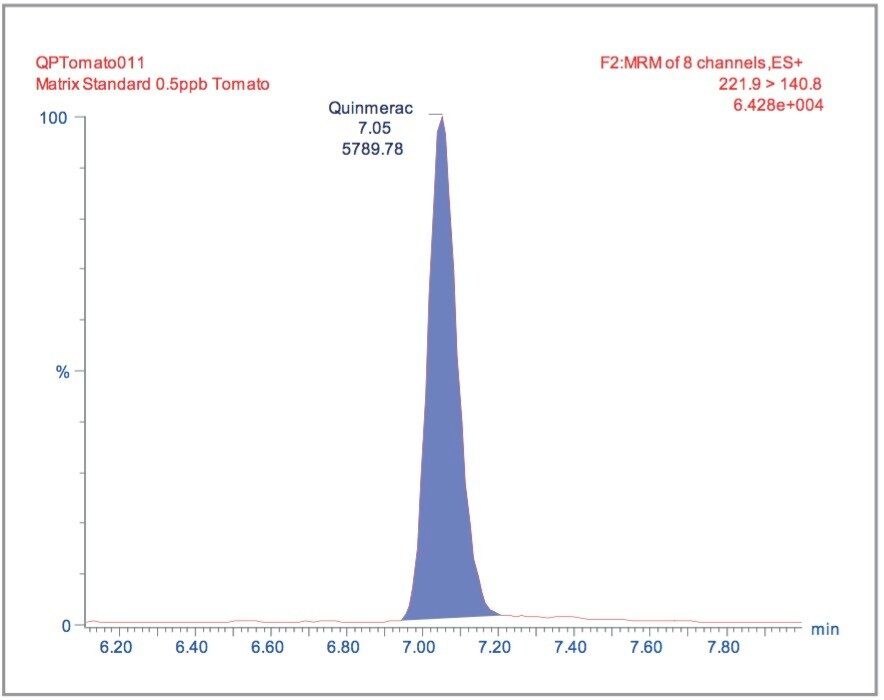
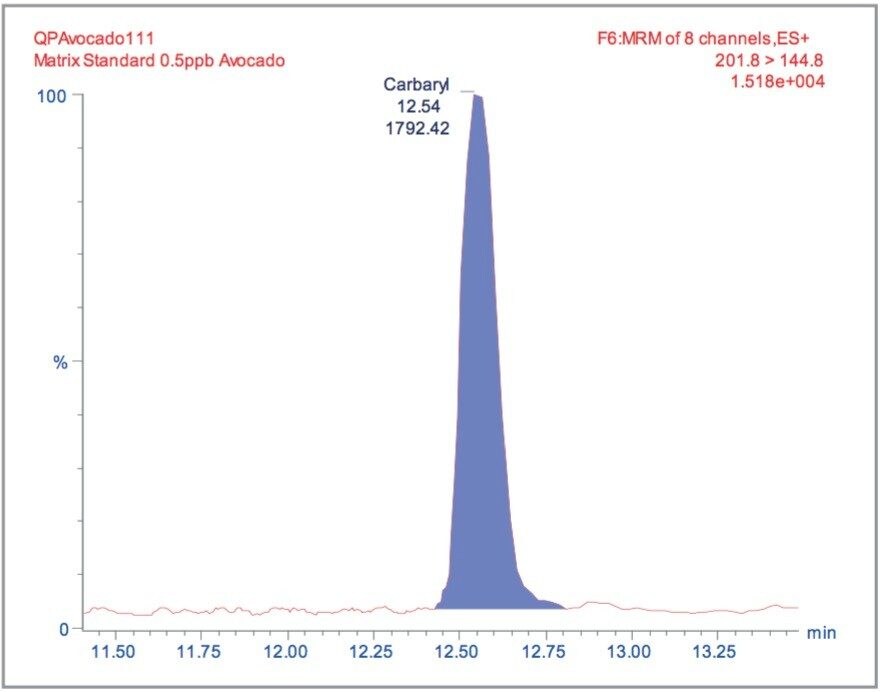
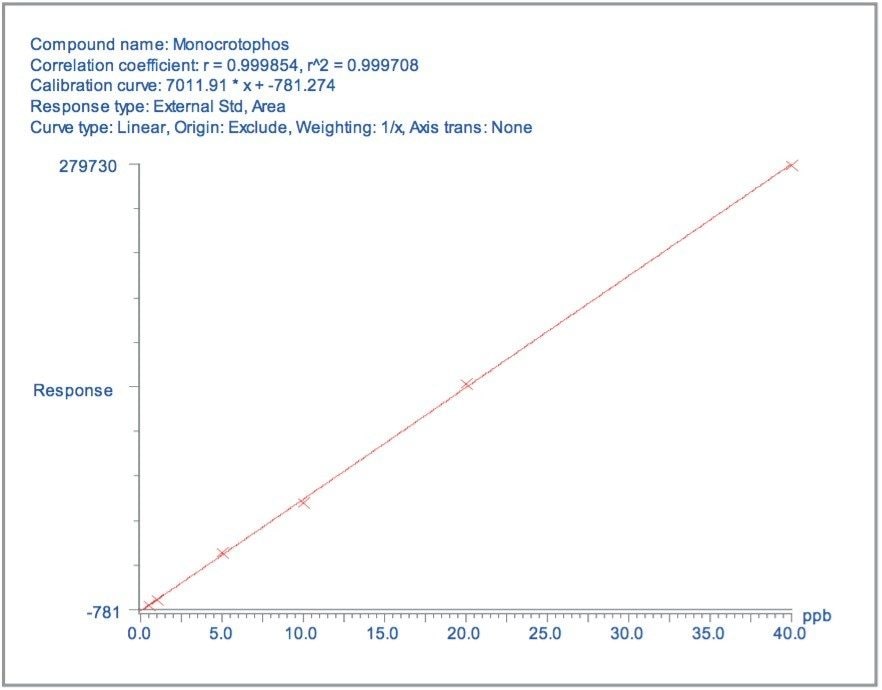
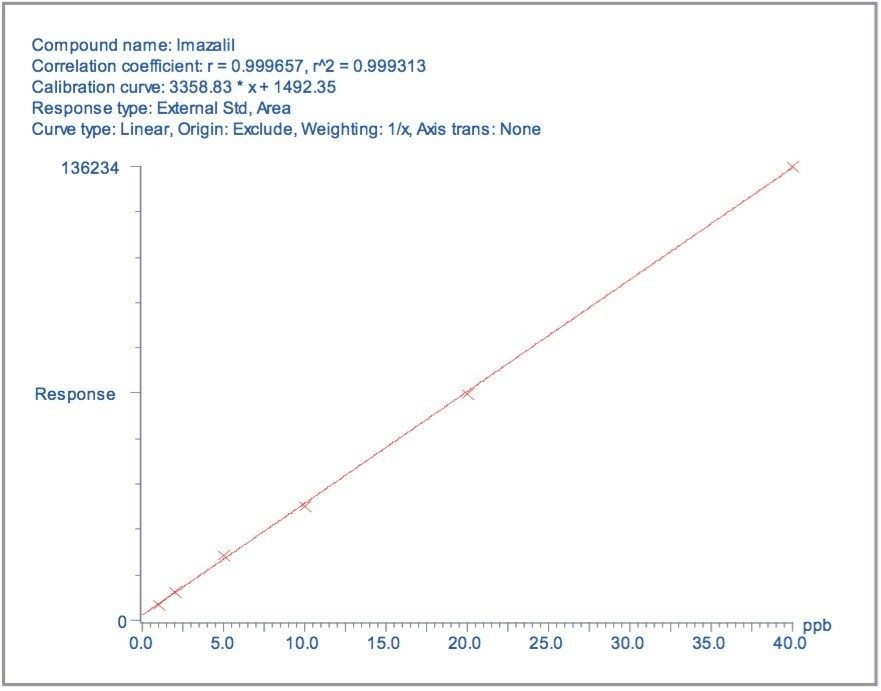
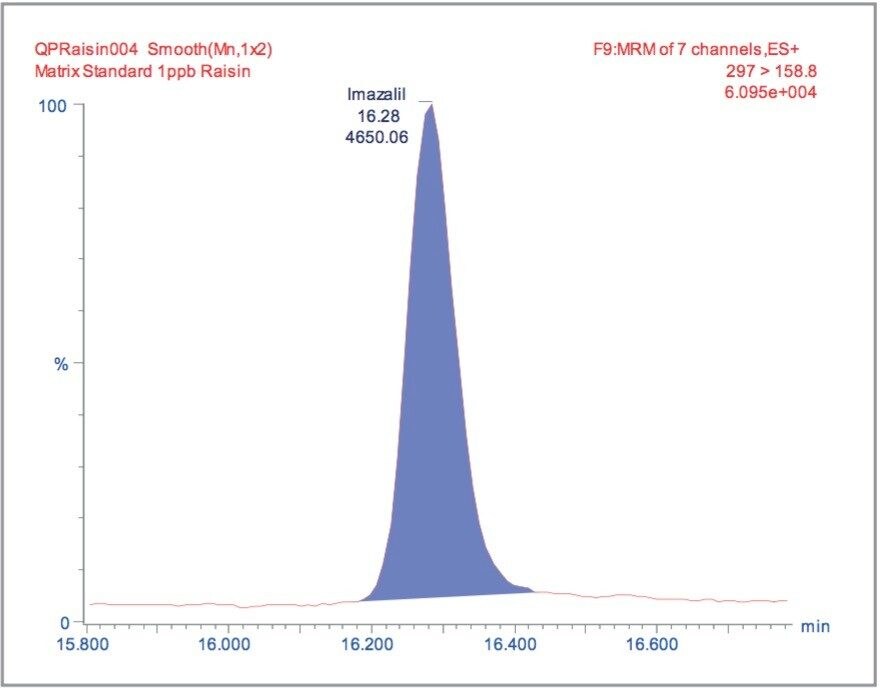
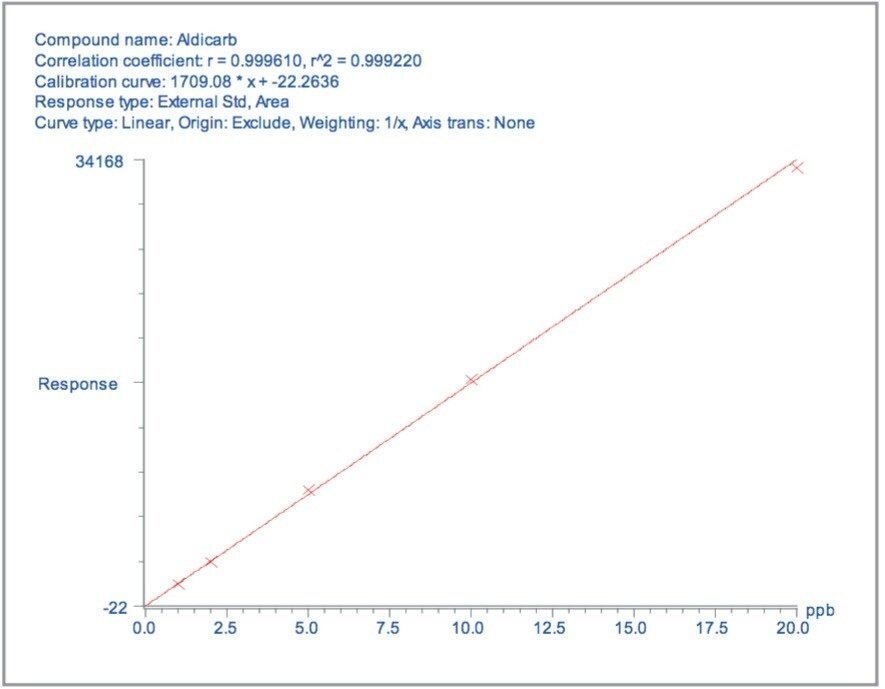
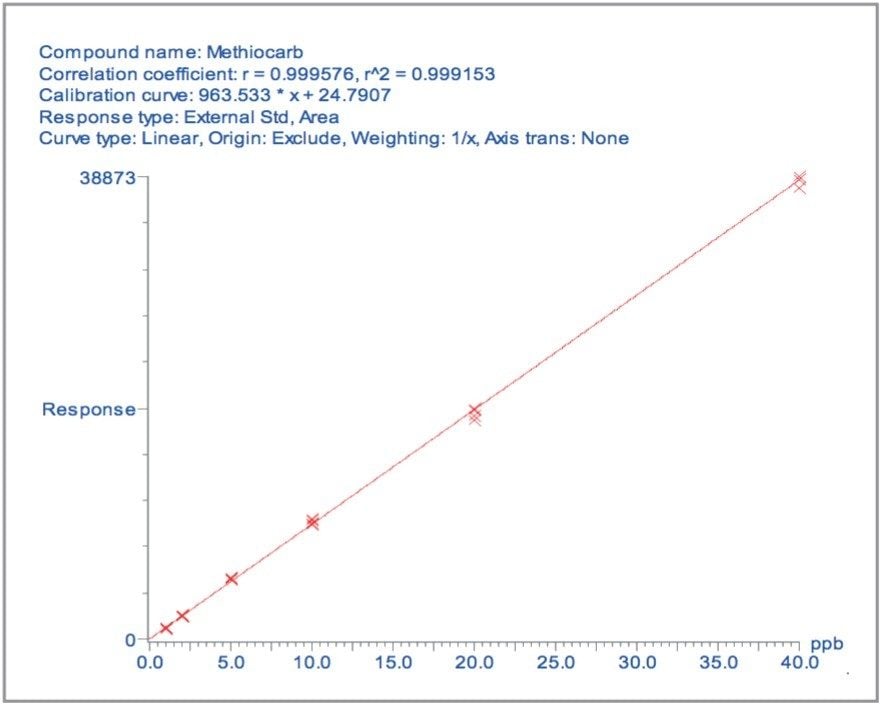
Using the MRM technique, a method was developed for the quantification of 81 pesticides and pesticide metabolites. A generic extraction procedure and clean-up was performed. The extraction and analytical methods were validated for five commodities (representative matrix): tomato (high water), avocado (high fat), lemon (low pH), raisin (high sugar), and wheat flour (dry).
Liquid chromatography separations were performed using a Waters Atlantis dC18 Column 2.1 mm i.d. x 100 mm. Experiments were performed on an Alliance HPLC System coupled to a Waters Micromass Quattro Premier Tandem Quadrupole Mass Spectrometer.
The test sample is chopped avoiding loss of juice. 10 g is transferred into a blender cup. For the dry sample materials, e.g. raisin or wheat flour, a 5 g homogenized portion is weighed into the cup. Water is added to all samples to obtain 10 mL as a sum of natural and added water. To 10 g tomato (water content 95%), lemon (water content 90%) or avocado (water content 70%) 0.5 mL, 1 mL, and 3 mL of water are added, respectively. To 5 g of raisin (water content 20%) and wheat flour (water content 10%) 9 mL and 9.5 mL of water is added, respectively. In the case of dry sample materials, it is necessary to wait 10 minutes after the addition of water. After a further addition of 20 mL methanol, the sample is blended for 2 minutes. The total volume of supernatant extract is 30 mL. In the case of very turbid extracts, an aliquot is centrifuged at 6000 rpm for 5 minutes.
6 mL of the extract is mixed with 2 mL of a solution of NaCl (20 g in 100 mL water). An aliquot of 5 mL (which contains the pesticides residues of 1.25 g normal or 0.625 g dry sample material, respectively) is transferred to a column containing 5 mL of diatomaceous earth. After a 5 minute waiting period, the column is eluted with 16 mL of dichloromethane. The eluate is gently evaporated under a stream of dry nitrogen. The dry residue is redissolved in 250 μL methanol with the help of an ultrasonic bath and further diluted with 1000 μL water. The final extract is filtered through a 0.45 μm syringe filter into a glass HPLC vial and has a matrix equivalent of 1 g/mL for normal produce or 0.5 g/mL for dry produce.
LC system: |
Alliance 2795 HPLC System |
Mobile phase A: |
Methanol/water (1:9, v/v) + 5 mM CH3CO2NH4 |
Mobile phase B: |
Methanol/water (9:1, v/v) + 5 mM CH3CO2NH4 |
Column: |
Waters Atlantis dC18, 2.1 x 100 mm, 3 μm at 30 °C |
Guard column: |
Waters Atlantis dC18, 2.1 x 20 mm, 3 μm |
Flow rate: |
0.3 mL/min |
Injection volume: |
10 μL |
Time(min) |
%B |
---|---|
0 |
0 |
15 |
100 |
29 |
100 |
29.1 |
0 |
40 |
0 |
MS system: |
Waters Quattro Premier Mass Spectrometer Electrospray mode with positive polarity |
Capillary voltage: |
0.6 kV |
Extractor: |
5 V |
RF lens: |
0 V |
Source temp.: |
120 °C |
Desolvation temp.: |
450 °C |
Cone gas flow: |
450 °C |
Desolvation gas flow: |
850 L/hr |
Collision gas pressure: |
Argon at 3.2e-3mBar |
Multiplier: |
650 V |
The MRM transitions, along with the cone voltages, collision energies and dwell times for each pesticide are listed in Table 1. The MRM transitions were distributed into eleven function windows, based on analyte retention times. This system allows the flexible use of MRM dwell times, where the signal-to-noise (S/N) ratio of less intense peaks can be increased by the use of longer dwell times whilst a short overall scan cycle time is maintained.
The Total Ion Chromatogram (TIC) for an avocado extract spiked at 10 μg/kg is illustrated in Figure 1.
Matrix matched standards were generated at the 0.5, 1, 5, 10, 20, and 40 μg/kg levels for tomato, avocado and lemon, and at the 1, 2, 5 10, 20, and 40 μg/kg levels for raisin and wheat flour. These standards were each injected four times in a typical batch analysis and then processed using Waters QuanLynx Software. Representative calibration curves for quinmerac in tomato, carbaryl in avocado, monocrotophos in lemon, imazalil in raisin and aldicarb in wheat flour are illustrated in Figures 2, 4, 6, 8, and 10, respectively.
The MRM extracted chromatogram for these compounds at the lowest calibrated level of 0.5 μg/kg in tomato, avocado and lemon, and 1 μg/kg in raisin and wheat flour are illustrated in Figures 3, 5, 7, 9, and 11, respectively.
For each matrix the lowest level calibration standard was used to estimate the Limits of Detection (LODs) for all 81 pesticides. The LODs are defined as the concentrations at which the S/N ratio is ≥3:1. The results are illustrated in Figure 12, with the least sensitive compounds in the most complex matrices giving LODs at least an order of magnitude less than those specified by the MRLs.
The S/N ratios for a 5 pg/μL standard in solvent were compared to a 50 pg/μL standard injected on the Quattro micro API using the conditions specified in Waters Application Note 720000686EN. An example of the sensitivity difference between the Quattro micro API and the Quattro Premier for propoxur is illustrated in Figure 13. In this example, 500 pg was injected on column with the Quattro micro API, compared to 50 pg with the Quattro Premier – the S/N ratios are comparable. The average increase in sensitivity across all 81 pesticides between the two instruments was calculated to be 7.2.
Four replicate batch analyzes were carried out on matrix-matched samples spiked with all 81 pesticides. The calibration curves were overlaid and a representative curve for methiocarb from the wheat flour matrix is illustrated in Figure 14. For the concentrations of 1, 2, 5, and 10 μg/kg, the mean values for all 81 pesticides were calculated to be 0.92, 1.97, 5.38, and 10.44 μg/kg, with percent relative standard deviations of 7.7, 5.2, 4.0, and 3.5, respectively. These results indicate that the method is reproducible at concentration levels that are significantly lower than the detection limits required by law.
With the sensitivity and reproducibility achieved by the Quattro Premier, the results indicate either an increased number of pesticides could be analyzed in a single run, and/or confirmatory transitions for each pesticide could be added to the method. A suitable number of data points across any of the chromatographic peaks are still required for good quantification, but more pesticides or confirmatory transitions would lead to an increase in the number of MRM transitions in a function and the overall cycle time. To overcome this the dwell time of each transition and the interchannel delay must be decreased.
The Quattro Premier incorporates a T-Wave (Travelling Wave) collision cell that minimizes ion transit times and provides optimum performance for narrow chromatographic peaks or, in this case, multiple MRM transitions. This T-Wave cell maintains signal intensity and minimizes interchannel crosstalk even with dwell and interchannel delay times of 5 ms.
To study this the original experiment, containing eleven MRM function windows, was changed to three and the inter-channel and inter-scan delays were standardised on 5 ms for each function. All the dwell times for all the pesticides were changed from those listed in Table 1 to 40, 30, 20, 10, and 5 ms. Therefore, each function contained approximately 27 MRM transitions so the overall cycle time was 1.22, 0.95, 0.68, 0.41, and 0.275 s, respectively. The results are illustrated in Figure 15 for thiacloprid where the overall cycle time has decreased by a factor of 4.4 but the peak area has only decreased by 5.5% between 40 and 5 ms. Similarly, the S/N ratios for the smoothed data between 40 and 5 ms have not significantly changed, as shown in Figure 16. This feature of the T-Wave collision cell allows fast switching between MRM transitions.
Therefore, the method could be extended to further pesticides and/or confirmatory transitions for each.
A generic extraction and LC-MS/MS method, valid for a wide range of compound classes in a representative set of matrix types, was validated and shown to be suitable for the screening of 81 pesticide residue compounds in fruit and vegetables. The limits of detection achieved for the pesticides analyzed are well below that required for surveillance monitoring in the European Union. Therefore, the method is clearly extendable to greater numbers of pesticide targets and or confirmatory transitions in a single run.
720000840, May 2004